Slovak vs Trinidadian and Tobagonian 3 or more Vehicles in Household
COMPARE
Slovak
Trinidadian and Tobagonian
3 or more Vehicles in Household
3 or more Vehicles in Household Comparison
Slovaks
Trinidadians and Tobagonians
20.1%
3 OR MORE VEHICLES IN HOUSEHOLD
83.0/ 100
METRIC RATING
147th/ 347
METRIC RANK
13.6%
3 OR MORE VEHICLES IN HOUSEHOLD
0.0/ 100
METRIC RATING
332nd/ 347
METRIC RANK
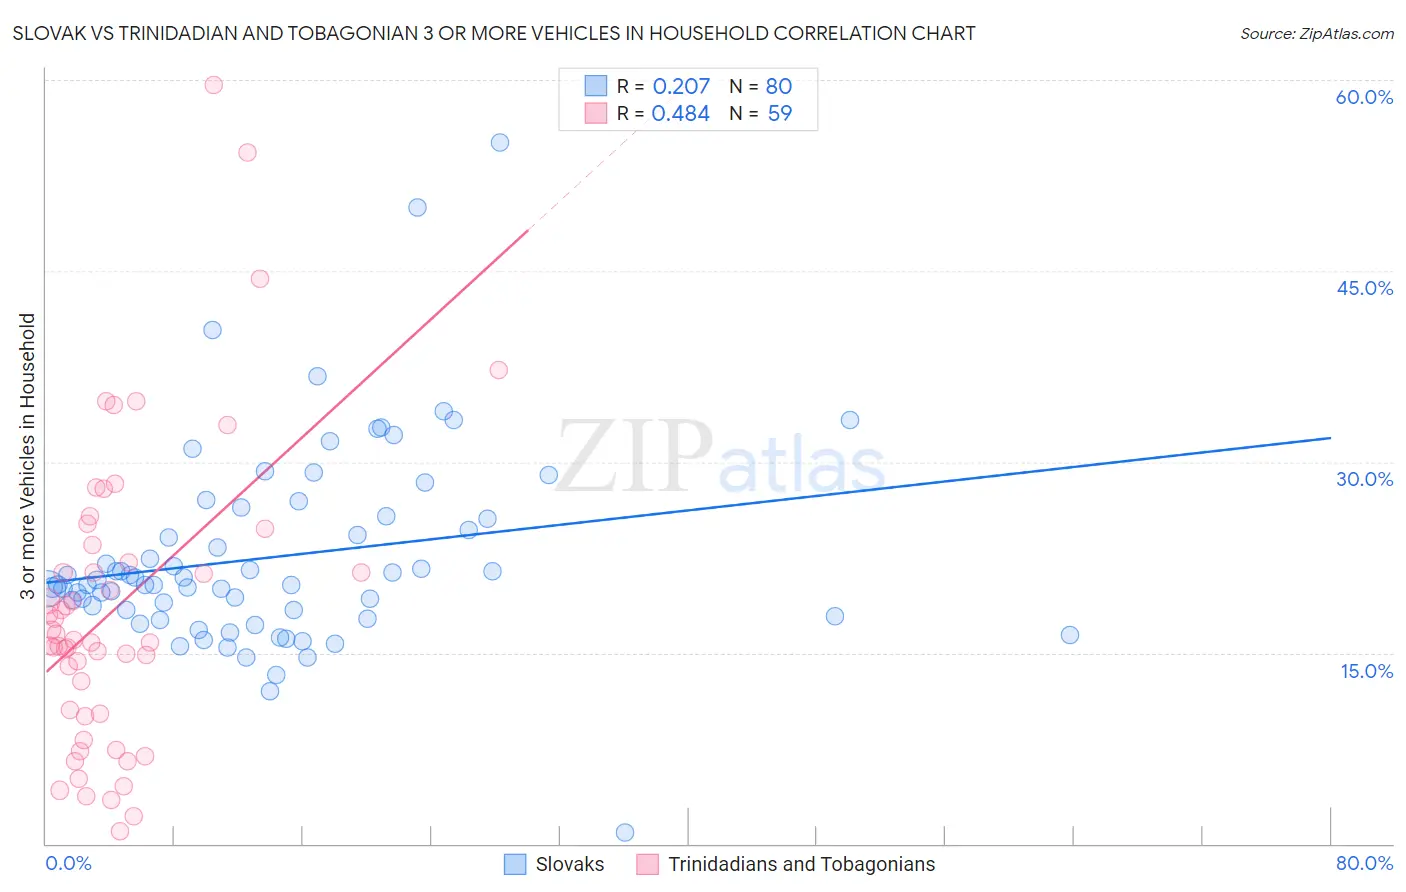
Slovak vs Trinidadian and Tobagonian 3 or more Vehicles in Household Correlation Chart
The statistical analysis conducted on geographies consisting of 397,587,914 people shows a weak positive correlation between the proportion of Slovaks and percentage of households with 3 or more vehicles available in the United States with a correlation coefficient (R) of 0.207 and weighted average of 20.1%. Similarly, the statistical analysis conducted on geographies consisting of 219,661,129 people shows a moderate positive correlation between the proportion of Trinidadians and Tobagonians and percentage of households with 3 or more vehicles available in the United States with a correlation coefficient (R) of 0.484 and weighted average of 13.6%, a difference of 47.5%.
3 or more Vehicles in Household Correlation Summary
| Measurement | Slovak | Trinidadian and Tobagonian |
| Minimum | 0.89% | 1.0% |
| Maximum | 55.1% | 59.6% |
| Range | 54.2% | 58.6% |
| Mean | 22.5% | 18.6% |
| Median | 20.4% | 16.0% |
| Interquartile 25% (IQ1) | 18.1% | 10.2% |
| Interquartile 75% (IQ3) | 25.7% | 23.5% |
| Interquartile Range (IQR) | 7.5% | 13.3% |
| Standard Deviation (Sample) | 7.9% | 11.9% |
| Standard Deviation (Population) | 7.9% | 11.8% |
Similar Demographics by 3 or more Vehicles in Household
Demographics Similar to Slovaks by 3 or more Vehicles in Household
In terms of 3 or more vehicles in household, the demographic groups most similar to Slovaks are Guatemalan (20.1%, a difference of 0.060%), Australian (20.1%, a difference of 0.080%), Palestinian (20.1%, a difference of 0.12%), Iranian (20.1%, a difference of 0.13%), and Jordanian (20.1%, a difference of 0.19%).
| Demographics | Rating | Rank | 3 or more Vehicles in Household |
| French American Indians | 85.3 /100 | #140 | Excellent 20.1% |
| Ottawa | 84.9 /100 | #141 | Excellent 20.1% |
| Jordanians | 84.4 /100 | #142 | Excellent 20.1% |
| Lithuanians | 84.4 /100 | #143 | Excellent 20.1% |
| Iranians | 84.0 /100 | #144 | Excellent 20.1% |
| Palestinians | 83.9 /100 | #145 | Excellent 20.1% |
| Australians | 83.6 /100 | #146 | Excellent 20.1% |
| Slovaks | 83.0 /100 | #147 | Excellent 20.1% |
| Guatemalans | 82.6 /100 | #148 | Excellent 20.1% |
| Immigrants | Iran | 80.9 /100 | #149 | Excellent 20.0% |
| Immigrants | Immigrants | 80.8 /100 | #150 | Excellent 20.0% |
| Taiwanese | 80.6 /100 | #151 | Excellent 20.0% |
| Lebanese | 79.8 /100 | #152 | Good 20.0% |
| Yuman | 75.6 /100 | #153 | Good 19.9% |
| Immigrants | Jordan | 75.0 /100 | #154 | Good 19.9% |
Demographics Similar to Trinidadians and Tobagonians by 3 or more Vehicles in Household
In terms of 3 or more vehicles in household, the demographic groups most similar to Trinidadians and Tobagonians are Immigrants from Cabo Verde (13.6%, a difference of 0.36%), Immigrants from Dominica (13.7%, a difference of 0.71%), West Indian (13.7%, a difference of 0.93%), Immigrants from Senegal (13.8%, a difference of 1.3%), and Immigrants from Ecuador (13.4%, a difference of 1.6%).
| Demographics | Rating | Rank | 3 or more Vehicles in Household |
| Senegalese | 0.0 /100 | #325 | Tragic 14.2% |
| Soviet Union | 0.0 /100 | #326 | Tragic 14.2% |
| Ecuadorians | 0.0 /100 | #327 | Tragic 14.1% |
| Immigrants | Albania | 0.0 /100 | #328 | Tragic 14.0% |
| Immigrants | Senegal | 0.0 /100 | #329 | Tragic 13.8% |
| West Indians | 0.0 /100 | #330 | Tragic 13.7% |
| Immigrants | Dominica | 0.0 /100 | #331 | Tragic 13.7% |
| Trinidadians and Tobagonians | 0.0 /100 | #332 | Tragic 13.6% |
| Immigrants | Cabo Verde | 0.0 /100 | #333 | Tragic 13.6% |
| Immigrants | Ecuador | 0.0 /100 | #334 | Tragic 13.4% |
| Immigrants | Trinidad and Tobago | 0.0 /100 | #335 | Tragic 13.3% |
| Barbadians | 0.0 /100 | #336 | Tragic 12.6% |
| Immigrants | Bangladesh | 0.0 /100 | #337 | Tragic 12.5% |
| Vietnamese | 0.0 /100 | #338 | Tragic 12.5% |
| Immigrants | Uzbekistan | 0.0 /100 | #339 | Tragic 12.0% |