Immigrants from Western Europe vs Immigrants from Iran 3 or more Vehicles in Household
COMPARE
Immigrants from Western Europe
Immigrants from Iran
3 or more Vehicles in Household
3 or more Vehicles in Household Comparison
Immigrants from Western Europe
Immigrants from Iran
19.5%
3 OR MORE VEHICLES IN HOUSEHOLD
53.2/ 100
METRIC RATING
171st/ 347
METRIC RANK
20.0%
3 OR MORE VEHICLES IN HOUSEHOLD
80.9/ 100
METRIC RATING
149th/ 347
METRIC RANK
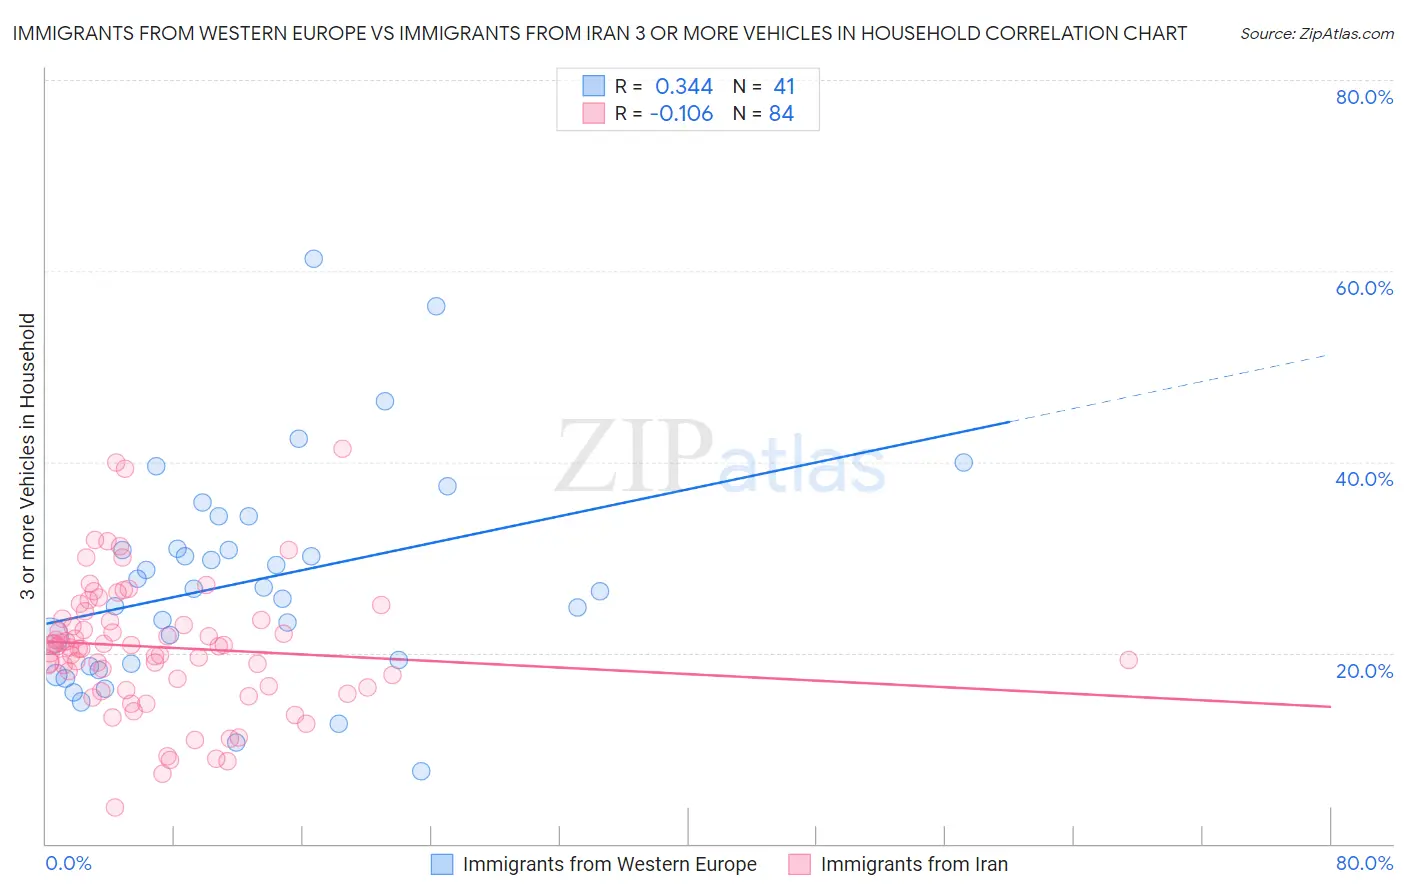
Immigrants from Western Europe vs Immigrants from Iran 3 or more Vehicles in Household Correlation Chart
The statistical analysis conducted on geographies consisting of 493,637,379 people shows a mild positive correlation between the proportion of Immigrants from Western Europe and percentage of households with 3 or more vehicles available in the United States with a correlation coefficient (R) of 0.344 and weighted average of 19.5%. Similarly, the statistical analysis conducted on geographies consisting of 279,780,113 people shows a poor negative correlation between the proportion of Immigrants from Iran and percentage of households with 3 or more vehicles available in the United States with a correlation coefficient (R) of -0.106 and weighted average of 20.0%, a difference of 2.5%.
3 or more Vehicles in Household Correlation Summary
| Measurement | Immigrants from Western Europe | Immigrants from Iran |
| Minimum | 7.5% | 3.8% |
| Maximum | 61.3% | 41.4% |
| Range | 53.7% | 37.6% |
| Mean | 27.5% | 20.6% |
| Median | 26.7% | 20.6% |
| Interquartile 25% (IQ1) | 18.7% | 16.4% |
| Interquartile 75% (IQ3) | 32.6% | 23.5% |
| Interquartile Range (IQR) | 13.9% | 7.1% |
| Standard Deviation (Sample) | 11.3% | 6.9% |
| Standard Deviation (Population) | 11.2% | 6.9% |
Similar Demographics by 3 or more Vehicles in Household
Demographics Similar to Immigrants from Western Europe by 3 or more Vehicles in Household
In terms of 3 or more vehicles in household, the demographic groups most similar to Immigrants from Western Europe are Kiowa (19.5%, a difference of 0.18%), Iraqi (19.6%, a difference of 0.21%), Immigrants from Northern Europe (19.5%, a difference of 0.23%), Immigrants from South Africa (19.5%, a difference of 0.24%), and Immigrants from Denmark (19.6%, a difference of 0.34%).
| Demographics | Rating | Rank | 3 or more Vehicles in Household |
| Yugoslavians | 62.9 /100 | #164 | Good 19.7% |
| Immigrants | Costa Rica | 61.9 /100 | #165 | Good 19.7% |
| Immigrants | Cameroon | 60.9 /100 | #166 | Good 19.7% |
| Ukrainians | 58.9 /100 | #167 | Average 19.6% |
| Peruvians | 58.8 /100 | #168 | Average 19.6% |
| Immigrants | Denmark | 57.6 /100 | #169 | Average 19.6% |
| Iraqis | 56.0 /100 | #170 | Average 19.6% |
| Immigrants | Western Europe | 53.2 /100 | #171 | Average 19.5% |
| Kiowa | 50.9 /100 | #172 | Average 19.5% |
| Immigrants | Northern Europe | 50.2 /100 | #173 | Average 19.5% |
| Immigrants | South Africa | 50.0 /100 | #174 | Average 19.5% |
| Syrians | 47.0 /100 | #175 | Average 19.5% |
| Iroquois | 46.0 /100 | #176 | Average 19.4% |
| Immigrants | Peru | 41.1 /100 | #177 | Average 19.4% |
| Immigrants | Syria | 40.3 /100 | #178 | Average 19.4% |
Demographics Similar to Immigrants from Iran by 3 or more Vehicles in Household
In terms of 3 or more vehicles in household, the demographic groups most similar to Immigrants from Iran are Immigrants (20.0%, a difference of 0.020%), Taiwanese (20.0%, a difference of 0.030%), Lebanese (20.0%, a difference of 0.13%), Guatemalan (20.1%, a difference of 0.20%), and Slovak (20.1%, a difference of 0.26%).
| Demographics | Rating | Rank | 3 or more Vehicles in Household |
| Jordanians | 84.4 /100 | #142 | Excellent 20.1% |
| Lithuanians | 84.4 /100 | #143 | Excellent 20.1% |
| Iranians | 84.0 /100 | #144 | Excellent 20.1% |
| Palestinians | 83.9 /100 | #145 | Excellent 20.1% |
| Australians | 83.6 /100 | #146 | Excellent 20.1% |
| Slovaks | 83.0 /100 | #147 | Excellent 20.1% |
| Guatemalans | 82.6 /100 | #148 | Excellent 20.1% |
| Immigrants | Iran | 80.9 /100 | #149 | Excellent 20.0% |
| Immigrants | Immigrants | 80.8 /100 | #150 | Excellent 20.0% |
| Taiwanese | 80.6 /100 | #151 | Excellent 20.0% |
| Lebanese | 79.8 /100 | #152 | Good 20.0% |
| Yuman | 75.6 /100 | #153 | Good 19.9% |
| Immigrants | Jordan | 75.0 /100 | #154 | Good 19.9% |
| Tlingit-Haida | 73.4 /100 | #155 | Good 19.9% |
| Thais | 71.1 /100 | #156 | Good 19.8% |