Immigrants from Western Europe vs Zimbabwean 3 or more Vehicles in Household
COMPARE
Immigrants from Western Europe
Zimbabwean
3 or more Vehicles in Household
3 or more Vehicles in Household Comparison
Immigrants from Western Europe
Zimbabweans
19.5%
3 OR MORE VEHICLES IN HOUSEHOLD
53.2/ 100
METRIC RATING
171st/ 347
METRIC RANK
20.3%
3 OR MORE VEHICLES IN HOUSEHOLD
88.7/ 100
METRIC RATING
129th/ 347
METRIC RANK
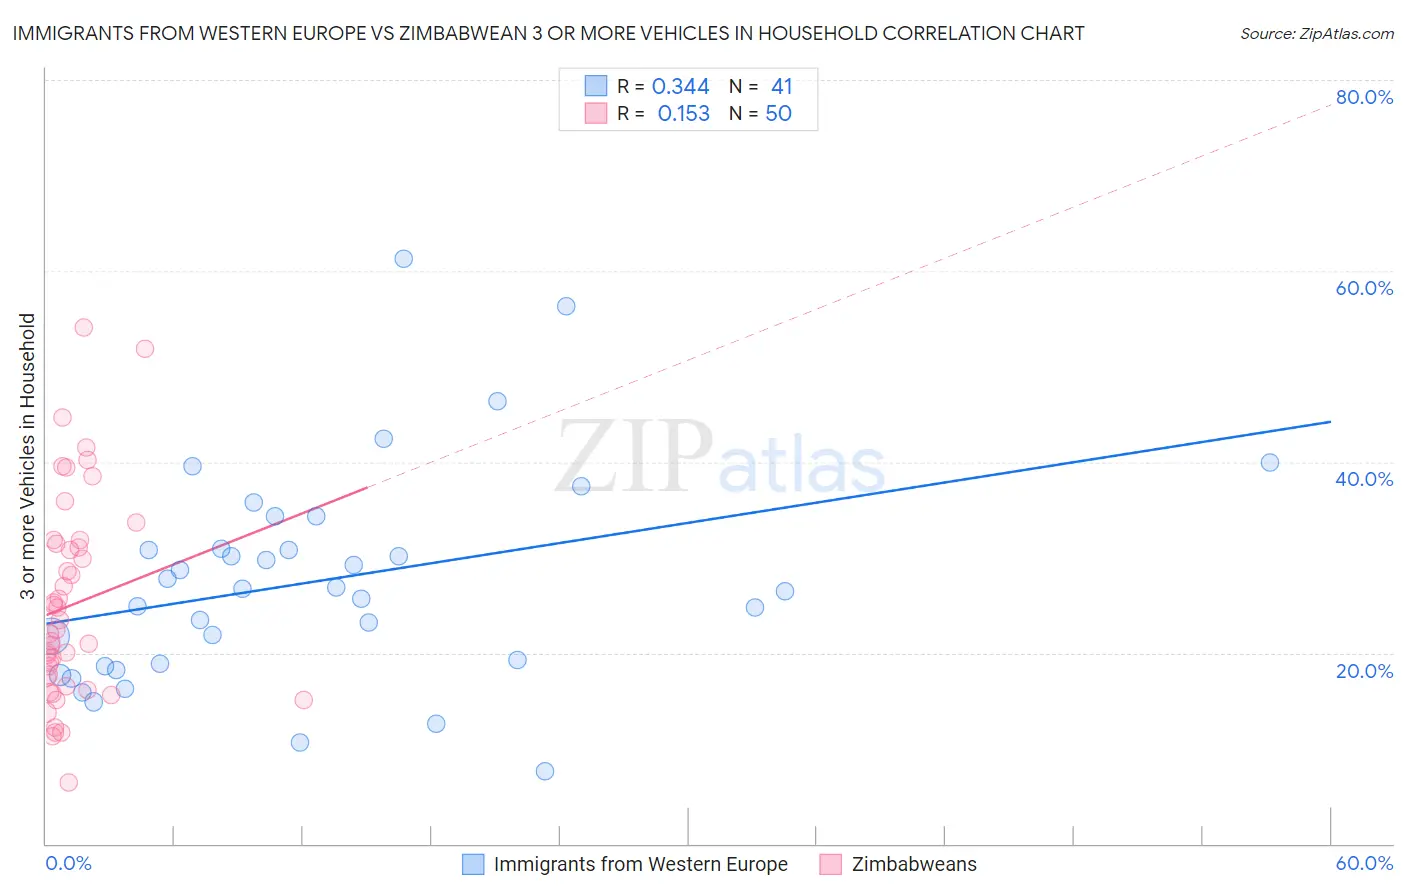
Immigrants from Western Europe vs Zimbabwean 3 or more Vehicles in Household Correlation Chart
The statistical analysis conducted on geographies consisting of 493,637,379 people shows a mild positive correlation between the proportion of Immigrants from Western Europe and percentage of households with 3 or more vehicles available in the United States with a correlation coefficient (R) of 0.344 and weighted average of 19.5%. Similarly, the statistical analysis conducted on geographies consisting of 69,187,806 people shows a poor positive correlation between the proportion of Zimbabweans and percentage of households with 3 or more vehicles available in the United States with a correlation coefficient (R) of 0.153 and weighted average of 20.3%, a difference of 3.6%.
3 or more Vehicles in Household Correlation Summary
| Measurement | Immigrants from Western Europe | Zimbabwean |
| Minimum | 7.5% | 6.4% |
| Maximum | 61.3% | 54.1% |
| Range | 53.7% | 47.7% |
| Mean | 27.5% | 25.0% |
| Median | 26.7% | 22.2% |
| Interquartile 25% (IQ1) | 18.7% | 16.5% |
| Interquartile 75% (IQ3) | 32.6% | 31.5% |
| Interquartile Range (IQR) | 13.9% | 14.9% |
| Standard Deviation (Sample) | 11.3% | 10.8% |
| Standard Deviation (Population) | 11.2% | 10.6% |
Similar Demographics by 3 or more Vehicles in Household
Demographics Similar to Immigrants from Western Europe by 3 or more Vehicles in Household
In terms of 3 or more vehicles in household, the demographic groups most similar to Immigrants from Western Europe are Kiowa (19.5%, a difference of 0.18%), Iraqi (19.6%, a difference of 0.21%), Immigrants from Northern Europe (19.5%, a difference of 0.23%), Immigrants from South Africa (19.5%, a difference of 0.24%), and Immigrants from Denmark (19.6%, a difference of 0.34%).
| Demographics | Rating | Rank | 3 or more Vehicles in Household |
| Yugoslavians | 62.9 /100 | #164 | Good 19.7% |
| Immigrants | Costa Rica | 61.9 /100 | #165 | Good 19.7% |
| Immigrants | Cameroon | 60.9 /100 | #166 | Good 19.7% |
| Ukrainians | 58.9 /100 | #167 | Average 19.6% |
| Peruvians | 58.8 /100 | #168 | Average 19.6% |
| Immigrants | Denmark | 57.6 /100 | #169 | Average 19.6% |
| Iraqis | 56.0 /100 | #170 | Average 19.6% |
| Immigrants | Western Europe | 53.2 /100 | #171 | Average 19.5% |
| Kiowa | 50.9 /100 | #172 | Average 19.5% |
| Immigrants | Northern Europe | 50.2 /100 | #173 | Average 19.5% |
| Immigrants | South Africa | 50.0 /100 | #174 | Average 19.5% |
| Syrians | 47.0 /100 | #175 | Average 19.5% |
| Iroquois | 46.0 /100 | #176 | Average 19.4% |
| Immigrants | Peru | 41.1 /100 | #177 | Average 19.4% |
| Immigrants | Syria | 40.3 /100 | #178 | Average 19.4% |
Demographics Similar to Zimbabweans by 3 or more Vehicles in Household
In terms of 3 or more vehicles in household, the demographic groups most similar to Zimbabweans are Greek (20.3%, a difference of 0.030%), Immigrants from Asia (20.2%, a difference of 0.10%), Immigrants from Canada (20.2%, a difference of 0.15%), Immigrants from North America (20.2%, a difference of 0.15%), and Polish (20.2%, a difference of 0.24%).
| Demographics | Rating | Rank | 3 or more Vehicles in Household |
| German Russians | 93.7 /100 | #122 | Exceptional 20.5% |
| Immigrants | Korea | 93.7 /100 | #123 | Exceptional 20.5% |
| Central Americans | 93.1 /100 | #124 | Exceptional 20.5% |
| Immigrants | Netherlands | 92.9 /100 | #125 | Exceptional 20.4% |
| Slavs | 92.1 /100 | #126 | Exceptional 20.4% |
| Immigrants | Bolivia | 92.0 /100 | #127 | Exceptional 20.4% |
| New Zealanders | 91.3 /100 | #128 | Exceptional 20.4% |
| Zimbabweans | 88.7 /100 | #129 | Excellent 20.3% |
| Greeks | 88.6 /100 | #130 | Excellent 20.3% |
| Immigrants | Asia | 88.1 /100 | #131 | Excellent 20.2% |
| Immigrants | Canada | 87.8 /100 | #132 | Excellent 20.2% |
| Immigrants | North America | 87.8 /100 | #133 | Excellent 20.2% |
| Poles | 87.3 /100 | #134 | Excellent 20.2% |
| Immigrants | India | 87.2 /100 | #135 | Excellent 20.2% |
| Immigrants | Nicaragua | 87.1 /100 | #136 | Excellent 20.2% |