Immigrants from South America vs Immigrants from Netherlands 3 or more Vehicles in Household

COMPARE

Immigrants from South America
Race
Ancestry
AfghanAfricanAlaska NativeAlaskan AthabascanAlbanianAleutAlsatianAmericanApacheArabArapahoArgentineanArmenianAssyrian/Chaldean/SyriacAustralianAustrianBahamianBangladeshiBarbadianBasqueBelgianBelizeanBermudanBhutaneseBlackfeetBolivianBrazilianBritishBritish West IndianBulgarianBurmeseCajunCambodianCanadianCape VerdeanCarpatho RusynCelticCentral AmericanCentral American IndianCherokeeCheyenneChickasawChileanChineseChippewaChoctawColombianColvilleComancheCosta RicanCreeCreekCroatianCrowCubanCypriotCzechCzechoslovakianDanishDelawareDominicanDutchDutch West IndianEastern EuropeanEcuadorianEgyptianEnglishEstonianEthiopianEuropeanFijianFilipinoFinnishFrenchFrench American IndianFrench CanadianGermanGerman RussianGhanaianGreekGuamanian/ChamorroGuatemalanGuyaneseHaitianHmongHonduranHopiHoumaHungarianIcelanderIndian (Asian)IndonesianInupiatIranianIraqiIrishIroquoisIsraeliItalianJamaicanJapaneseJordanianKenyanKiowaKoreanLaotianLatvianLebaneseLiberianLithuanianLumbeeLuxembourgerMacedonianMalaysianMalteseMarshalleseMenomineeMexicanMexican American IndianMongolianMoroccanNative HawaiianNavajoNepaleseNew ZealanderNicaraguanNigerianNorthern EuropeanNorwegianOkinawanOsageOttawaPaiutePakistaniPalestinianPanamanianParaguayanPennsylvania GermanPeruvianPimaPolishPortuguesePotawatomiPuebloPuerto RicanPuget Sound SalishRomanianRussianSalvadoranSamoanScandinavianScotch-IrishScottishSeminoleSenegaleseSerbianShoshoneSierra LeoneanSiouxSlavicSlovakSloveneSomaliSouth AfricanSouth AmericanSouth American IndianSoviet UnionSpaniardSpanishSpanish AmericanSpanish American IndianSri LankanSubsaharan AfricanSudaneseSwedishSwissSyrianTaiwaneseThaiTlingit-HaidaTohono O'OdhamTonganTrinidadian and TobagonianTsimshianTurkishU.S. Virgin IslanderUgandanUkrainianUruguayanUteVenezuelanVietnameseWelshWest IndianYakamaYaquiYugoslavianYumanYup'ikZimbabwean
Immigration
NonimmigrantsImmigrantsAfghanistanAfricaAlbaniaArgentinaArmeniaAsiaAustraliaAustriaBahamasBangladeshBarbadosBelarusBelgiumBelizeBoliviaBosnia and HerzegovinaBrazilBulgariaBurma/MyanmarCabo VerdeCambodiaCameroonCanadaCaribbeanCentral AmericaChileChinaColombiaCongoCosta RicaCroatiaCubaCzechoslovakiaDenmarkDominicaDominican RepublicEastern AfricaEastern AsiaEastern EuropeEcuadorEgyptEl SalvadorEnglandEritreaEthiopiaEuropeFijiFranceGermanyGhanaGreeceGrenadaGuatemalaGuyanaHaitiHondurasHong KongHungaryIndiaIndonesiaIranIraqIrelandIsraelItalyJamaicaJapanJordanKazakhstanKenyaKoreaKuwaitLaosLatin AmericaLatviaLebanonLiberiaLithuaniaMalaysiaMexicoMicronesiaMiddle AfricaMoldovaMoroccoNepalNicaraguaNigeriaNorth AmericaNorth MacedoniaNorthern AfricaNorthern EuropeNorwayOceaniaPakistanPanamaPeruPhilippinesPolandPortugalRomaniaRussiaSaudi ArabiaScotlandSenegalSerbiaSierra LeoneSingaporeSomaliaSouth AfricaSouth AmericaSouth Central AsiaSouth Eastern AsiaSouthern EuropeSpainSri LankaSt. Vincent and the GrenadinesSudanSwedenSwitzerlandSyriaTaiwanThailandTrinidad and TobagoTurkeyUgandaUkraineUruguayUzbekistanVenezuelaVietnamWest IndiesWestern AfricaWestern AsiaWestern EuropeYemenZaireZimbabweAzores
Immigrants from Netherlands
Race
Ancestry
AfghanAfricanAlaska NativeAlaskan AthabascanAlbanianAleutAlsatianAmericanApacheArabArapahoArgentineanArmenianAssyrian/Chaldean/SyriacAustralianAustrianBahamianBangladeshiBarbadianBasqueBelgianBelizeanBermudanBhutaneseBlackfeetBolivianBrazilianBritishBritish West IndianBulgarianBurmeseCajunCambodianCanadianCape VerdeanCarpatho RusynCelticCentral AmericanCentral American IndianCherokeeCheyenneChickasawChileanChineseChippewaChoctawColombianColvilleComancheCosta RicanCreeCreekCroatianCrowCubanCypriotCzechCzechoslovakianDanishDelawareDominicanDutchDutch West IndianEastern EuropeanEcuadorianEgyptianEnglishEstonianEthiopianEuropeanFijianFilipinoFinnishFrenchFrench American IndianFrench CanadianGermanGerman RussianGhanaianGreekGuamanian/ChamorroGuatemalanGuyaneseHaitianHmongHonduranHopiHoumaHungarianIcelanderIndian (Asian)IndonesianInupiatIranianIraqiIrishIroquoisIsraeliItalianJamaicanJapaneseJordanianKenyanKiowaKoreanLaotianLatvianLebaneseLiberianLithuanianLumbeeLuxembourgerMacedonianMalaysianMalteseMarshalleseMenomineeMexicanMexican American IndianMongolianMoroccanNative HawaiianNavajoNepaleseNew ZealanderNicaraguanNigerianNorthern EuropeanNorwegianOkinawanOsageOttawaPaiutePakistaniPalestinianPanamanianParaguayanPennsylvania GermanPeruvianPimaPolishPortuguesePotawatomiPuebloPuerto RicanPuget Sound SalishRomanianRussianSalvadoranSamoanScandinavianScotch-IrishScottishSeminoleSenegaleseSerbianShoshoneSierra LeoneanSiouxSlavicSlovakSloveneSomaliSouth AfricanSouth AmericanSouth American IndianSoviet UnionSpaniardSpanishSpanish AmericanSpanish American IndianSri LankanSubsaharan AfricanSudaneseSwedishSwissSyrianTaiwaneseThaiTlingit-HaidaTohono O'OdhamTonganTrinidadian and TobagonianTsimshianTurkishU.S. Virgin IslanderUgandanUkrainianUruguayanUteVenezuelanVietnameseWelshWest IndianYakamaYaquiYugoslavianYumanYup'ikZimbabwean
Immigration
NonimmigrantsImmigrantsAfghanistanAfricaAlbaniaArgentinaArmeniaAsiaAustraliaAustriaBahamasBangladeshBarbadosBelarusBelgiumBelizeBoliviaBosnia and HerzegovinaBrazilBulgariaBurma/MyanmarCabo VerdeCambodiaCameroonCanadaCaribbeanCentral AmericaChileChinaColombiaCongoCosta RicaCroatiaCubaCzechoslovakiaDenmarkDominicaDominican RepublicEastern AfricaEastern AsiaEastern EuropeEcuadorEgyptEl SalvadorEnglandEritreaEthiopiaEuropeFijiFranceGermanyGhanaGreeceGrenadaGuatemalaGuyanaHaitiHondurasHong KongHungaryIndiaIndonesiaIranIraqIrelandIsraelItalyJamaicaJapanJordanKazakhstanKenyaKoreaKuwaitLaosLatin AmericaLatviaLebanonLiberiaLithuaniaMalaysiaMexicoMicronesiaMiddle AfricaMoldovaMoroccoNepalNetherlandsNicaraguaNigeriaNorth AmericaNorth MacedoniaNorthern AfricaNorthern EuropeNorwayOceaniaPakistanPanamaPeruPhilippinesPolandPortugalRomaniaRussiaSaudi ArabiaScotlandSenegalSerbiaSierra LeoneSingaporeSomaliaSouth AfricaSouth Central AsiaSouth Eastern AsiaSouthern EuropeSpainSri LankaSt. Vincent and the GrenadinesSudanSwedenSwitzerlandSyriaTaiwanThailandTrinidad and TobagoTurkeyUgandaUkraineUruguayUzbekistanVenezuelaVietnamWest IndiesWestern AfricaWestern AsiaWestern EuropeYemenZaireZimbabweAzores
3 or more Vehicles in Household
Income
Poverty
Unemployment
Labor Participation
Family Structure
Vehicle Availability
Education Level
Disability

3 or more Vehicles in Household Comparison

Immigrants from South America

Immigrants from Netherlands

Tragic
Exceptional
16.7%
3 OR MORE VEHICLES IN HOUSEHOLD
0.1/ 100
METRIC RATING
299th/ 347
METRIC RANK
20.4%
3 OR MORE VEHICLES IN HOUSEHOLD
92.9/ 100
METRIC RATING
125th/ 347
METRIC RANK

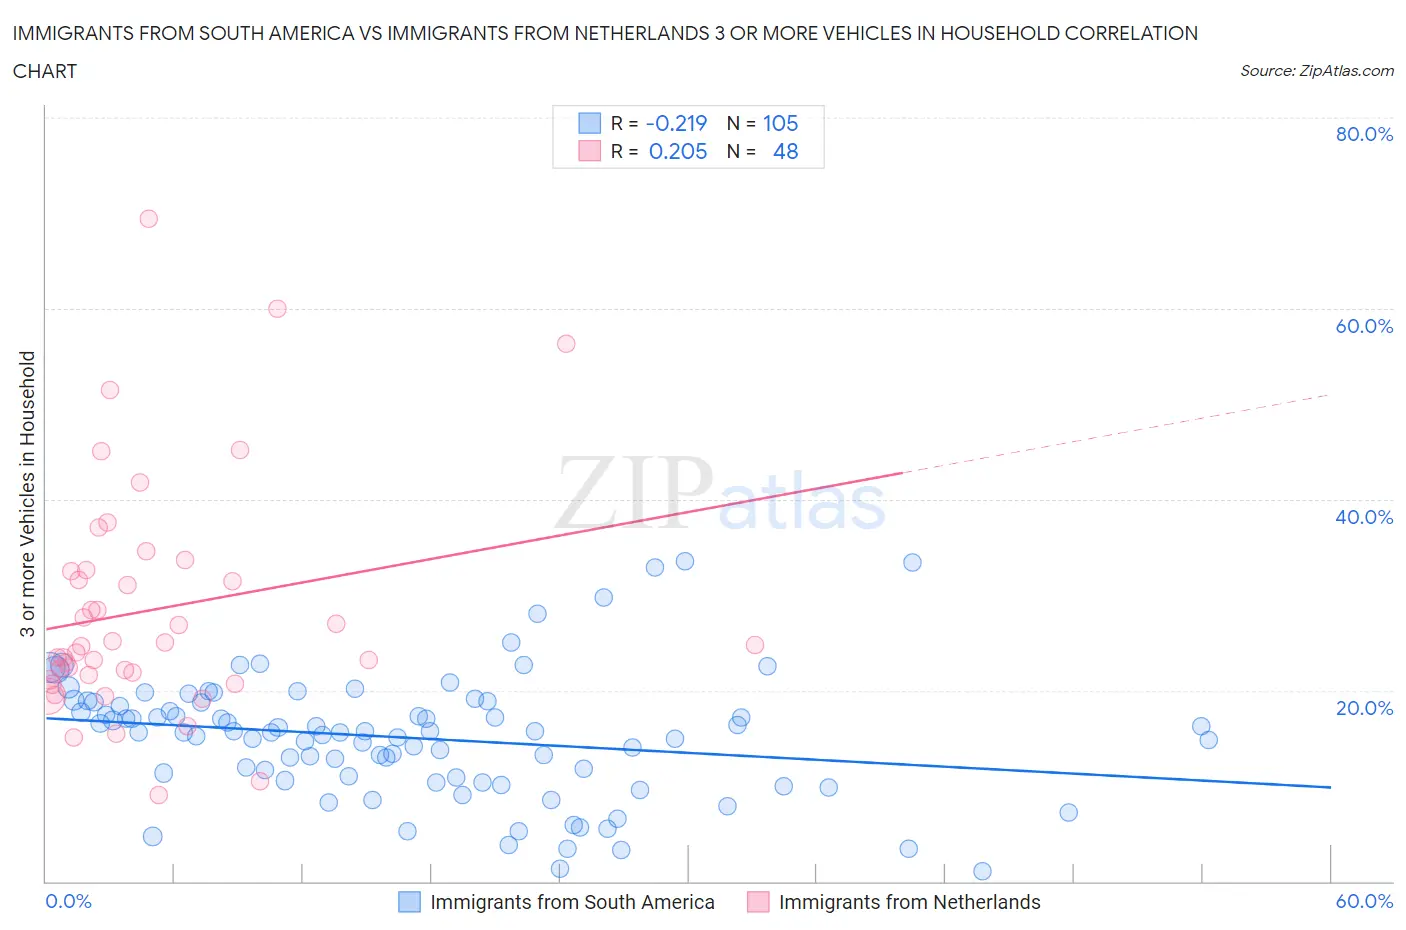
Immigrants from South America vs Immigrants from Netherlands 3 or more Vehicles in Household Correlation Chart

The statistical analysis conducted on geographies consisting of 485,824,151 people shows a weak negative correlation between the proportion of Immigrants from South America and percentage of households with 3 or more vehicles available in the United States with a correlation coefficient (R) of -0.219 and weighted average of 16.7%. Similarly, the statistical analysis conducted on geographies consisting of 237,758,469 people shows a weak positive correlation between the proportion of Immigrants from Netherlands and percentage of households with 3 or more vehicles available in the United States with a correlation coefficient (R) of 0.205 and weighted average of 20.4%, a difference of 22.4%.
Immigrants from South America vs Immigrants from Netherlands 3 or more Vehicles in Household

3 or more Vehicles in Household Correlation Summary

MeasurementImmigrants from South AmericaImmigrants from Netherlands
Minimum1.1%9.0%
Maximum33.5%69.4%
Range32.4%60.4%
Mean15.0%28.4%
Median15.6%24.7%
Interquartile 25% (IQ1)10.7%21.4%
Interquartile 75% (IQ3)18.7%32.5%
Interquartile Range (IQR)8.0%11.2%
Standard Deviation (Sample)6.5%12.3%
Standard Deviation (Population)6.4%12.2%

Similar Demographics by 3 or more Vehicles in Household

Demographics Similar to Immigrants from South America by 3 or more Vehicles in Household

In terms of 3 or more vehicles in household, the demographic groups most similar to Immigrants from South America are Immigrants from Zaire (16.7%, a difference of 0.060%), Israeli (16.8%, a difference of 0.43%), Cypriot (16.6%, a difference of 0.48%), Paraguayan (16.6%, a difference of 0.89%), and Inupiat (16.9%, a difference of 0.90%).
DemographicsRating | Rank3 or more Vehicles in Household
Immigrants | Spain
0.1
/100
|
#292
Tragic
17.0%
Bahamians
0.1
/100
|
#293
Tragic
16.9%
Immigrants | Western Africa
0.1
/100
|
#294
Tragic
16.9%
Immigrants | Russia
0.1
/100
|
#295
Tragic
16.9%
Inupiat
0.1
/100
|
#296
Tragic
16.9%
Israelis
0.1
/100
|
#297
Tragic
16.8%
Immigrants | Zaire
0.1
/100
|
#298
Tragic
16.7%
Immigrants | South America
0.1
/100
|
#299
Tragic
16.7%
Cypriots
0.0
/100
|
#300
Tragic
16.6%
Paraguayans
0.0
/100
|
#301
Tragic
16.6%
Immigrants | Greece
0.0
/100
|
#302
Tragic
16.5%
Immigrants | Serbia
0.0
/100
|
#303
Tragic
16.4%
Ghanaians
0.0
/100
|
#304
Tragic
16.4%
Immigrants | Morocco
0.0
/100
|
#305
Tragic
16.3%
Somalis
0.0
/100
|
#306
Tragic
16.2%

Demographics Similar to Immigrants from Netherlands by 3 or more Vehicles in Household

In terms of 3 or more vehicles in household, the demographic groups most similar to Immigrants from Netherlands are Central American (20.5%, a difference of 0.030%), Immigrants from Korea (20.5%, a difference of 0.20%), German Russian (20.5%, a difference of 0.21%), Slavic (20.4%, a difference of 0.21%), and Immigrants from Thailand (20.5%, a difference of 0.25%).
DemographicsRating | Rank3 or more Vehicles in Household
Costa Ricans
94.6
/100
|
#118
Exceptional
20.6%
Immigrants | Latin America
94.5
/100
|
#119
Exceptional
20.5%
Maltese
93.9
/100
|
#120
Exceptional
20.5%
Immigrants | Thailand
93.8
/100
|
#121
Exceptional
20.5%
German Russians
93.7
/100
|
#122
Exceptional
20.5%
Immigrants | Korea
93.7
/100
|
#123
Exceptional
20.5%
Central Americans
93.1
/100
|
#124
Exceptional
20.5%
Immigrants | Netherlands
92.9
/100
|
#125
Exceptional
20.4%
Slavs
92.1
/100
|
#126
Exceptional
20.4%
Immigrants | Bolivia
92.0
/100
|
#127
Exceptional
20.4%
New Zealanders
91.3
/100
|
#128
Exceptional
20.4%
Zimbabweans
88.7
/100
|
#129
Excellent
20.3%
Greeks
88.6
/100
|
#130
Excellent
20.3%
Immigrants | Asia
88.1
/100
|
#131
Excellent
20.2%
Immigrants | Canada
87.8
/100
|
#132
Excellent
20.2%