Immigrants from South America vs Immigrants from Poland 3 or more Vehicles in Household
COMPARE
Immigrants from South America
Immigrants from Poland
3 or more Vehicles in Household
3 or more Vehicles in Household Comparison
Immigrants from South America
Immigrants from Poland
16.7%
3 OR MORE VEHICLES IN HOUSEHOLD
0.1/ 100
METRIC RATING
299th/ 347
METRIC RANK
18.6%
3 OR MORE VEHICLES IN HOUSEHOLD
7.5/ 100
METRIC RATING
221st/ 347
METRIC RANK
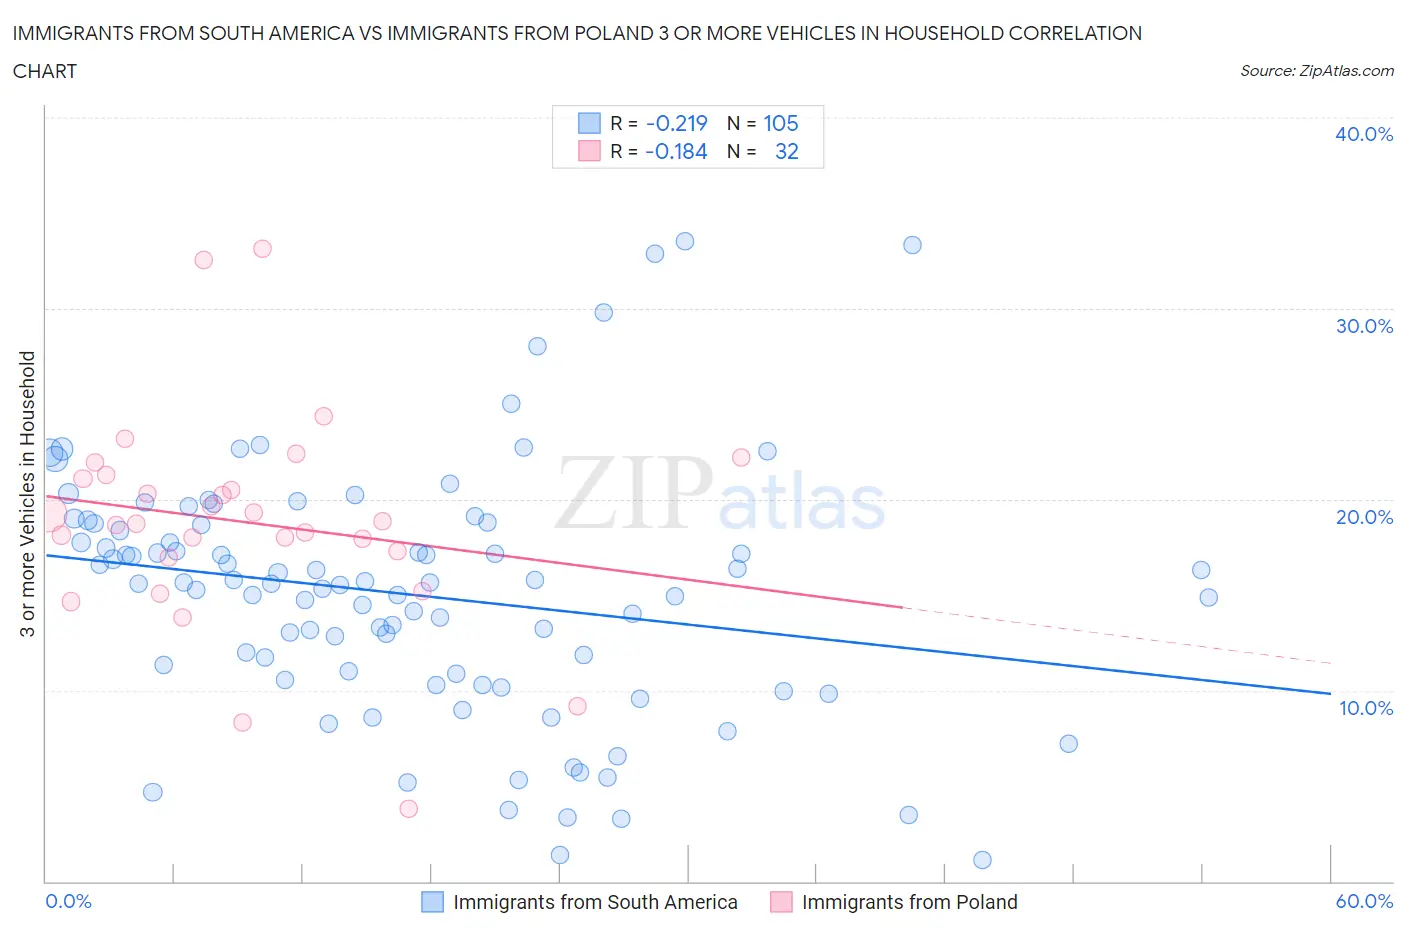
Immigrants from South America vs Immigrants from Poland 3 or more Vehicles in Household Correlation Chart
The statistical analysis conducted on geographies consisting of 485,824,151 people shows a weak negative correlation between the proportion of Immigrants from South America and percentage of households with 3 or more vehicles available in the United States with a correlation coefficient (R) of -0.219 and weighted average of 16.7%. Similarly, the statistical analysis conducted on geographies consisting of 304,731,133 people shows a poor negative correlation between the proportion of Immigrants from Poland and percentage of households with 3 or more vehicles available in the United States with a correlation coefficient (R) of -0.184 and weighted average of 18.6%, a difference of 11.2%.
3 or more Vehicles in Household Correlation Summary
| Measurement | Immigrants from South America | Immigrants from Poland |
| Minimum | 1.1% | 3.8% |
| Maximum | 33.5% | 33.1% |
| Range | 32.4% | 29.3% |
| Mean | 15.0% | 18.8% |
| Median | 15.6% | 18.8% |
| Interquartile 25% (IQ1) | 10.7% | 17.1% |
| Interquartile 75% (IQ3) | 18.7% | 21.2% |
| Interquartile Range (IQR) | 8.0% | 4.0% |
| Standard Deviation (Sample) | 6.5% | 5.7% |
| Standard Deviation (Population) | 6.4% | 5.6% |
Similar Demographics by 3 or more Vehicles in Household
Demographics Similar to Immigrants from South America by 3 or more Vehicles in Household
In terms of 3 or more vehicles in household, the demographic groups most similar to Immigrants from South America are Immigrants from Zaire (16.7%, a difference of 0.060%), Israeli (16.8%, a difference of 0.43%), Cypriot (16.6%, a difference of 0.48%), Paraguayan (16.6%, a difference of 0.89%), and Inupiat (16.9%, a difference of 0.90%).
| Demographics | Rating | Rank | 3 or more Vehicles in Household |
| Immigrants | Spain | 0.1 /100 | #292 | Tragic 17.0% |
| Bahamians | 0.1 /100 | #293 | Tragic 16.9% |
| Immigrants | Western Africa | 0.1 /100 | #294 | Tragic 16.9% |
| Immigrants | Russia | 0.1 /100 | #295 | Tragic 16.9% |
| Inupiat | 0.1 /100 | #296 | Tragic 16.9% |
| Israelis | 0.1 /100 | #297 | Tragic 16.8% |
| Immigrants | Zaire | 0.1 /100 | #298 | Tragic 16.7% |
| Immigrants | South America | 0.1 /100 | #299 | Tragic 16.7% |
| Cypriots | 0.0 /100 | #300 | Tragic 16.6% |
| Paraguayans | 0.0 /100 | #301 | Tragic 16.6% |
| Immigrants | Greece | 0.0 /100 | #302 | Tragic 16.5% |
| Immigrants | Serbia | 0.0 /100 | #303 | Tragic 16.4% |
| Ghanaians | 0.0 /100 | #304 | Tragic 16.4% |
| Immigrants | Morocco | 0.0 /100 | #305 | Tragic 16.3% |
| Somalis | 0.0 /100 | #306 | Tragic 16.2% |
Demographics Similar to Immigrants from Poland by 3 or more Vehicles in Household
In terms of 3 or more vehicles in household, the demographic groups most similar to Immigrants from Poland are Belizean (18.6%, a difference of 0.050%), Nigerian (18.6%, a difference of 0.090%), Immigrants from Armenia (18.6%, a difference of 0.29%), Immigrants from Portugal (18.6%, a difference of 0.37%), and Immigrants from Czechoslovakia (18.5%, a difference of 0.52%).
| Demographics | Rating | Rank | 3 or more Vehicles in Household |
| Immigrants | Sierra Leone | 10.8 /100 | #214 | Poor 18.7% |
| Eastern Europeans | 10.6 /100 | #215 | Poor 18.7% |
| Immigrants | Nigeria | 10.3 /100 | #216 | Poor 18.7% |
| Immigrants | Italy | 10.2 /100 | #217 | Poor 18.7% |
| Immigrants | Portugal | 8.9 /100 | #218 | Tragic 18.6% |
| Immigrants | Armenia | 8.6 /100 | #219 | Tragic 18.6% |
| Nigerians | 7.9 /100 | #220 | Tragic 18.6% |
| Immigrants | Poland | 7.5 /100 | #221 | Tragic 18.6% |
| Belizeans | 7.3 /100 | #222 | Tragic 18.6% |
| Immigrants | Czechoslovakia | 5.9 /100 | #223 | Tragic 18.5% |
| Immigrants | Argentina | 5.6 /100 | #224 | Tragic 18.5% |
| Immigrants | Lithuania | 5.6 /100 | #225 | Tragic 18.5% |
| Immigrants | Hungary | 5.5 /100 | #226 | Tragic 18.5% |
| Immigrants | Singapore | 5.4 /100 | #227 | Tragic 18.4% |
| Turks | 5.4 /100 | #228 | Tragic 18.4% |