Immigrants from Somalia vs Immigrants from Yemen 3 or more Vehicles in Household
COMPARE
Immigrants from Somalia
Immigrants from Yemen
3 or more Vehicles in Household
3 or more Vehicles in Household Comparison
Immigrants from Somalia
Immigrants from Yemen
15.9%
3 OR MORE VEHICLES IN HOUSEHOLD
0.0/ 100
METRIC RATING
309th/ 347
METRIC RANK
14.2%
3 OR MORE VEHICLES IN HOUSEHOLD
0.0/ 100
METRIC RATING
324th/ 347
METRIC RANK
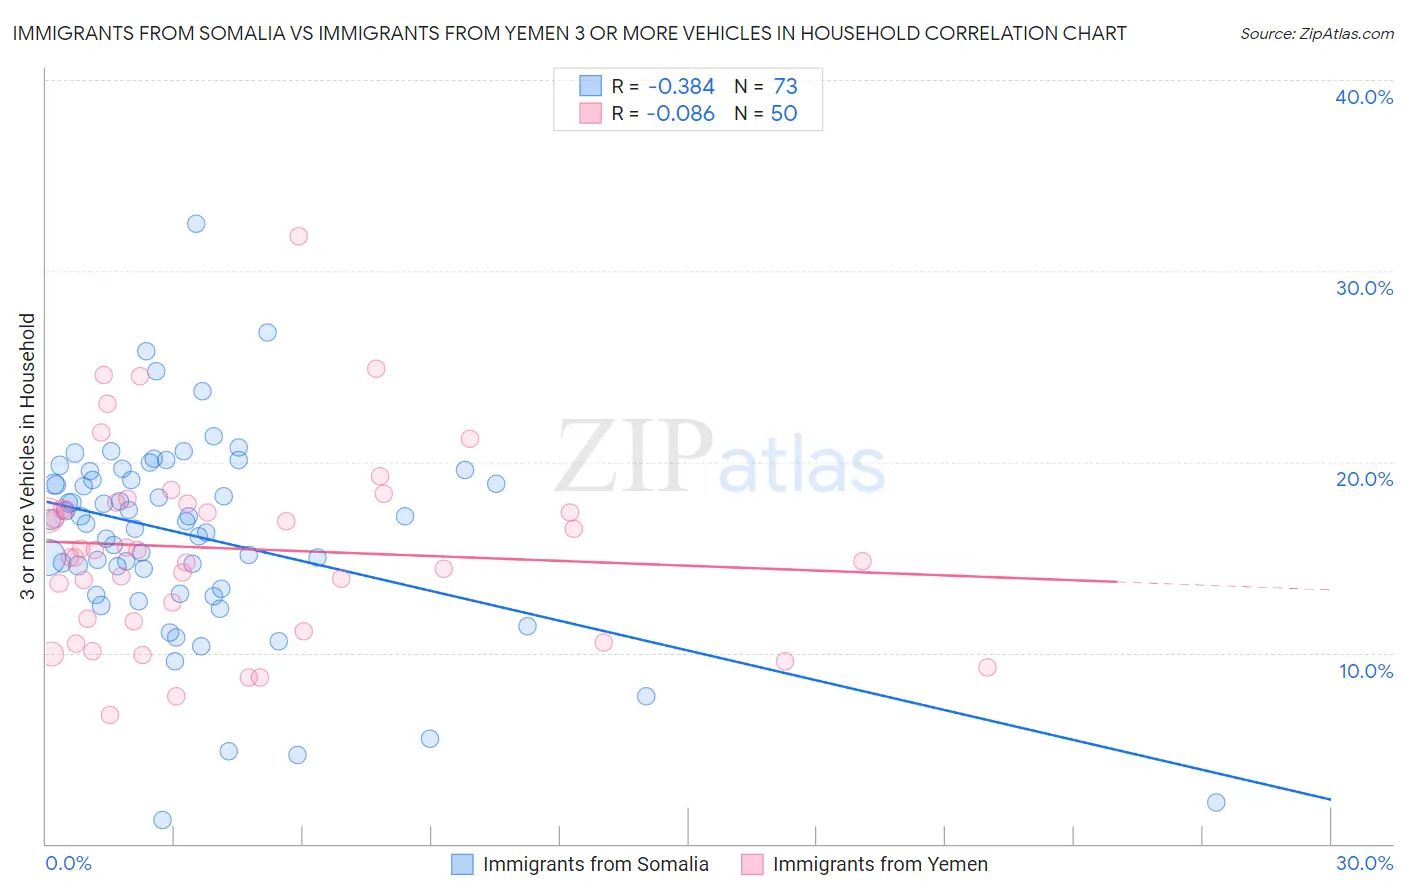
Immigrants from Somalia vs Immigrants from Yemen 3 or more Vehicles in Household Correlation Chart
The statistical analysis conducted on geographies consisting of 92,101,746 people shows a mild negative correlation between the proportion of Immigrants from Somalia and percentage of households with 3 or more vehicles available in the United States with a correlation coefficient (R) of -0.384 and weighted average of 15.9%. Similarly, the statistical analysis conducted on geographies consisting of 82,431,124 people shows a slight negative correlation between the proportion of Immigrants from Yemen and percentage of households with 3 or more vehicles available in the United States with a correlation coefficient (R) of -0.086 and weighted average of 14.2%, a difference of 11.8%.
3 or more Vehicles in Household Correlation Summary
| Measurement | Immigrants from Somalia | Immigrants from Yemen |
| Minimum | 1.3% | 6.7% |
| Maximum | 32.4% | 31.8% |
| Range | 31.2% | 25.1% |
| Mean | 16.1% | 15.5% |
| Median | 16.9% | 15.2% |
| Interquartile 25% (IQ1) | 13.2% | 11.6% |
| Interquartile 75% (IQ3) | 19.3% | 17.8% |
| Interquartile Range (IQR) | 6.1% | 6.1% |
| Standard Deviation (Sample) | 5.3% | 5.0% |
| Standard Deviation (Population) | 5.3% | 5.0% |
Demographics Similar to Immigrants from Somalia and Immigrants from Yemen by 3 or more Vehicles in Household
In terms of 3 or more vehicles in household, the demographic groups most similar to Immigrants from Somalia are Moroccan (15.9%, a difference of 0.24%), Albanian (15.8%, a difference of 0.74%), Houma (16.1%, a difference of 0.92%), Immigrants from Ghana (16.2%, a difference of 1.5%), and Somali (16.2%, a difference of 1.7%). Similarly, the demographic groups most similar to Immigrants from Yemen are Senegalese (14.2%, a difference of 0.080%), Soviet Union (14.2%, a difference of 0.41%), Immigrants from Caribbean (14.6%, a difference of 2.3%), Immigrants from West Indies (14.6%, a difference of 2.8%), and Immigrants from Jamaica (14.7%, a difference of 3.1%).
| Demographics | Rating | Rank | 3 or more Vehicles in Household |
| Somalis | 0.0 /100 | #306 | Tragic 16.2% |
| Immigrants | Ghana | 0.0 /100 | #307 | Tragic 16.2% |
| Houma | 0.0 /100 | #308 | Tragic 16.1% |
| Immigrants | Somalia | 0.0 /100 | #309 | Tragic 15.9% |
| Moroccans | 0.0 /100 | #310 | Tragic 15.9% |
| Albanians | 0.0 /100 | #311 | Tragic 15.8% |
| Puerto Ricans | 0.0 /100 | #312 | Tragic 15.6% |
| Immigrants | Israel | 0.0 /100 | #313 | Tragic 15.6% |
| Immigrants | Belarus | 0.0 /100 | #314 | Tragic 15.5% |
| Haitians | 0.0 /100 | #315 | Tragic 15.5% |
| U.S. Virgin Islanders | 0.0 /100 | #316 | Tragic 15.4% |
| Jamaicans | 0.0 /100 | #317 | Tragic 15.2% |
| Immigrants | Haiti | 0.0 /100 | #318 | Tragic 15.2% |
| Cape Verdeans | 0.0 /100 | #319 | Tragic 15.0% |
| Yup'ik | 0.0 /100 | #320 | Tragic 14.8% |
| Immigrants | Jamaica | 0.0 /100 | #321 | Tragic 14.7% |
| Immigrants | West Indies | 0.0 /100 | #322 | Tragic 14.6% |
| Immigrants | Caribbean | 0.0 /100 | #323 | Tragic 14.6% |
| Immigrants | Yemen | 0.0 /100 | #324 | Tragic 14.2% |
| Senegalese | 0.0 /100 | #325 | Tragic 14.2% |
| Soviet Union | 0.0 /100 | #326 | Tragic 14.2% |