Immigrants from Somalia vs Immigrants from Afghanistan 3 or more Vehicles in Household
COMPARE
Immigrants from Somalia
Immigrants from Afghanistan
3 or more Vehicles in Household
3 or more Vehicles in Household Comparison
Immigrants from Somalia
Immigrants from Afghanistan
15.9%
3 OR MORE VEHICLES IN HOUSEHOLD
0.0/ 100
METRIC RATING
309th/ 347
METRIC RANK
21.2%
3 OR MORE VEHICLES IN HOUSEHOLD
99.1/ 100
METRIC RATING
90th/ 347
METRIC RANK
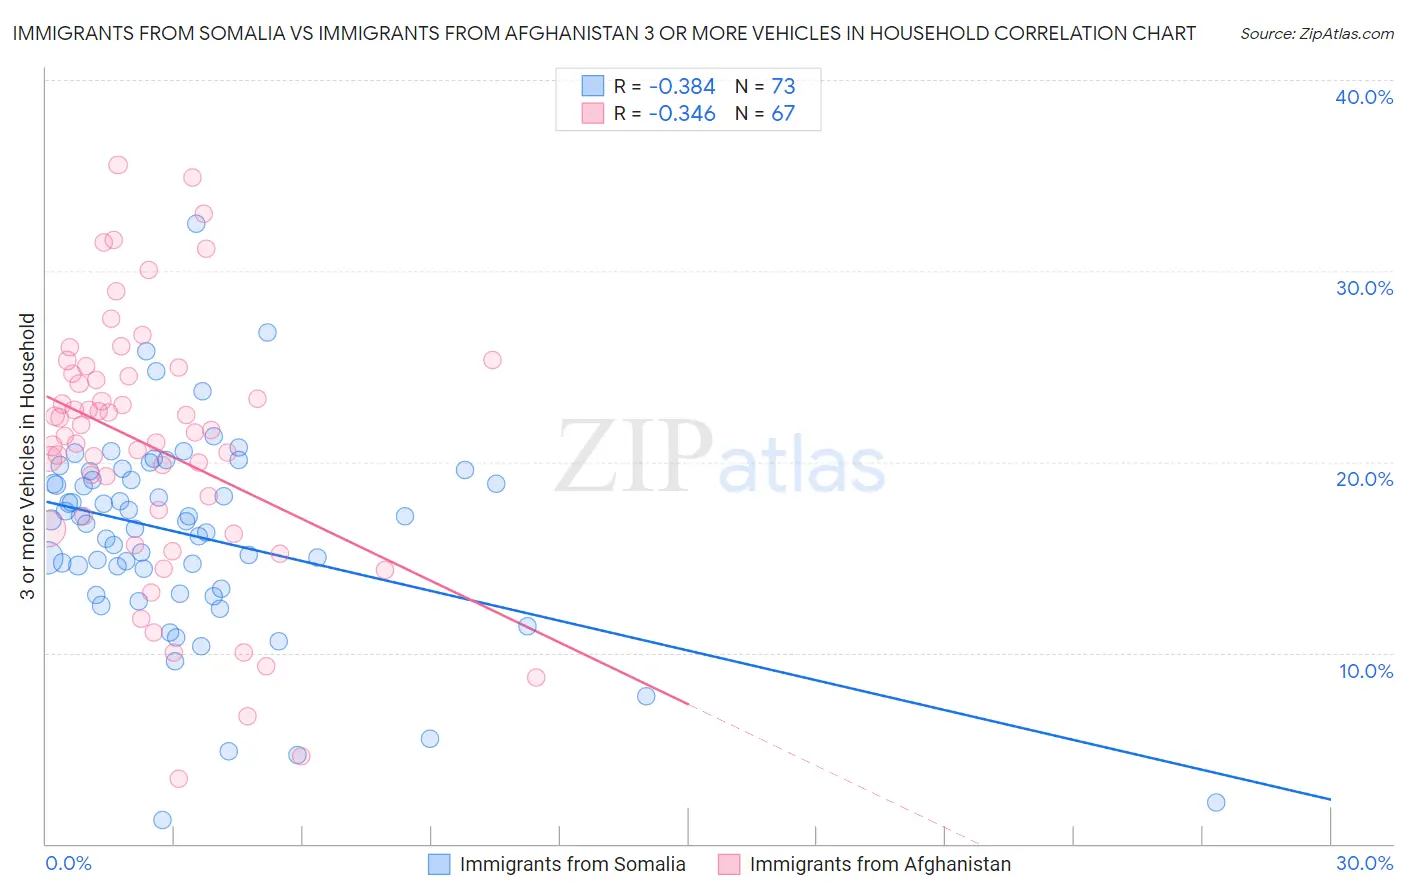
Immigrants from Somalia vs Immigrants from Afghanistan 3 or more Vehicles in Household Correlation Chart
The statistical analysis conducted on geographies consisting of 92,101,746 people shows a mild negative correlation between the proportion of Immigrants from Somalia and percentage of households with 3 or more vehicles available in the United States with a correlation coefficient (R) of -0.384 and weighted average of 15.9%. Similarly, the statistical analysis conducted on geographies consisting of 147,579,076 people shows a mild negative correlation between the proportion of Immigrants from Afghanistan and percentage of households with 3 or more vehicles available in the United States with a correlation coefficient (R) of -0.346 and weighted average of 21.2%, a difference of 33.5%.
3 or more Vehicles in Household Correlation Summary
| Measurement | Immigrants from Somalia | Immigrants from Afghanistan |
| Minimum | 1.3% | 3.4% |
| Maximum | 32.4% | 35.6% |
| Range | 31.2% | 32.2% |
| Mean | 16.1% | 20.7% |
| Median | 16.9% | 21.5% |
| Interquartile 25% (IQ1) | 13.2% | 16.5% |
| Interquartile 75% (IQ3) | 19.3% | 24.6% |
| Interquartile Range (IQR) | 6.1% | 8.1% |
| Standard Deviation (Sample) | 5.3% | 6.9% |
| Standard Deviation (Population) | 5.3% | 6.8% |
Similar Demographics by 3 or more Vehicles in Household
Demographics Similar to Immigrants from Somalia by 3 or more Vehicles in Household
In terms of 3 or more vehicles in household, the demographic groups most similar to Immigrants from Somalia are Moroccan (15.9%, a difference of 0.24%), Albanian (15.8%, a difference of 0.74%), Houma (16.1%, a difference of 0.92%), Immigrants from Ghana (16.2%, a difference of 1.5%), and Somali (16.2%, a difference of 1.7%).
| Demographics | Rating | Rank | 3 or more Vehicles in Household |
| Immigrants | Greece | 0.0 /100 | #302 | Tragic 16.5% |
| Immigrants | Serbia | 0.0 /100 | #303 | Tragic 16.4% |
| Ghanaians | 0.0 /100 | #304 | Tragic 16.4% |
| Immigrants | Morocco | 0.0 /100 | #305 | Tragic 16.3% |
| Somalis | 0.0 /100 | #306 | Tragic 16.2% |
| Immigrants | Ghana | 0.0 /100 | #307 | Tragic 16.2% |
| Houma | 0.0 /100 | #308 | Tragic 16.1% |
| Immigrants | Somalia | 0.0 /100 | #309 | Tragic 15.9% |
| Moroccans | 0.0 /100 | #310 | Tragic 15.9% |
| Albanians | 0.0 /100 | #311 | Tragic 15.8% |
| Puerto Ricans | 0.0 /100 | #312 | Tragic 15.6% |
| Immigrants | Israel | 0.0 /100 | #313 | Tragic 15.6% |
| Immigrants | Belarus | 0.0 /100 | #314 | Tragic 15.5% |
| Haitians | 0.0 /100 | #315 | Tragic 15.5% |
| U.S. Virgin Islanders | 0.0 /100 | #316 | Tragic 15.4% |
Demographics Similar to Immigrants from Afghanistan by 3 or more Vehicles in Household
In terms of 3 or more vehicles in household, the demographic groups most similar to Immigrants from Afghanistan are Marshallese (21.3%, a difference of 0.22%), Belgian (21.2%, a difference of 0.33%), Apache (21.2%, a difference of 0.41%), Immigrants from Indonesia (21.1%, a difference of 0.61%), and French (21.4%, a difference of 0.78%).
| Demographics | Rating | Rank | 3 or more Vehicles in Household |
| Chippewa | 99.6 /100 | #83 | Exceptional 21.5% |
| Icelanders | 99.6 /100 | #84 | Exceptional 21.5% |
| Laotians | 99.6 /100 | #85 | Exceptional 21.5% |
| Delaware | 99.6 /100 | #86 | Exceptional 21.5% |
| Immigrants | Azores | 99.5 /100 | #87 | Exceptional 21.5% |
| French | 99.4 /100 | #88 | Exceptional 21.4% |
| Marshallese | 99.2 /100 | #89 | Exceptional 21.3% |
| Immigrants | Afghanistan | 99.1 /100 | #90 | Exceptional 21.2% |
| Belgians | 98.9 /100 | #91 | Exceptional 21.2% |
| Apache | 98.9 /100 | #92 | Exceptional 21.2% |
| Immigrants | Indonesia | 98.8 /100 | #93 | Exceptional 21.1% |
| Immigrants | Cambodia | 98.6 /100 | #94 | Exceptional 21.1% |
| Pakistanis | 98.5 /100 | #95 | Exceptional 21.0% |
| Cree | 98.4 /100 | #96 | Exceptional 21.0% |
| Canadians | 98.3 /100 | #97 | Exceptional 21.0% |