Immigrants from Africa vs Immigrants from China 3 or more Vehicles in Household
COMPARE
Immigrants from Africa
Immigrants from China
3 or more Vehicles in Household
3 or more Vehicles in Household Comparison
Immigrants from Africa
Immigrants from China
17.6%
3 OR MORE VEHICLES IN HOUSEHOLD
0.5/ 100
METRIC RATING
272nd/ 347
METRIC RANK
18.2%
3 OR MORE VEHICLES IN HOUSEHOLD
2.9/ 100
METRIC RATING
240th/ 347
METRIC RANK
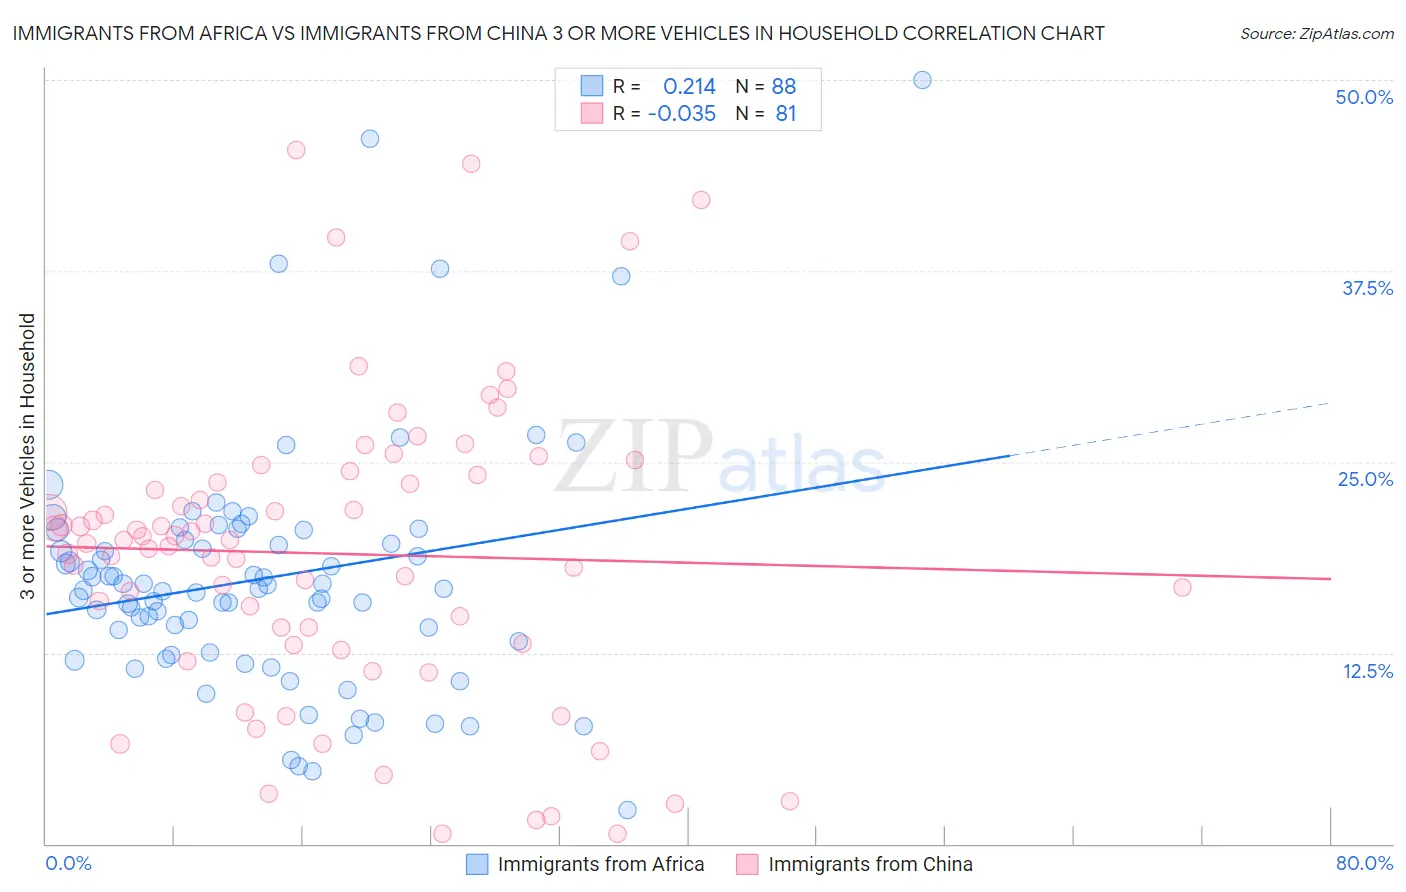
Immigrants from Africa vs Immigrants from China 3 or more Vehicles in Household Correlation Chart
The statistical analysis conducted on geographies consisting of 468,754,030 people shows a weak positive correlation between the proportion of Immigrants from Africa and percentage of households with 3 or more vehicles available in the United States with a correlation coefficient (R) of 0.214 and weighted average of 17.6%. Similarly, the statistical analysis conducted on geographies consisting of 456,383,621 people shows no correlation between the proportion of Immigrants from China and percentage of households with 3 or more vehicles available in the United States with a correlation coefficient (R) of -0.035 and weighted average of 18.2%, a difference of 3.7%.
3 or more Vehicles in Household Correlation Summary
| Measurement | Immigrants from Africa | Immigrants from China |
| Minimum | 2.2% | 0.62% |
| Maximum | 50.0% | 45.4% |
| Range | 47.8% | 44.8% |
| Mean | 17.4% | 19.0% |
| Median | 16.7% | 19.9% |
| Interquartile 25% (IQ1) | 12.9% | 13.0% |
| Interquartile 75% (IQ3) | 20.2% | 23.9% |
| Interquartile Range (IQR) | 7.3% | 10.9% |
| Standard Deviation (Sample) | 8.0% | 9.7% |
| Standard Deviation (Population) | 7.9% | 9.6% |
Similar Demographics by 3 or more Vehicles in Household
Demographics Similar to Immigrants from Africa by 3 or more Vehicles in Household
In terms of 3 or more vehicles in household, the demographic groups most similar to Immigrants from Africa are Immigrants from Sudan (17.6%, a difference of 0.040%), Immigrants from Bosnia and Herzegovina (17.5%, a difference of 0.18%), Immigrants from Nepal (17.6%, a difference of 0.41%), South American (17.6%, a difference of 0.41%), and Immigrants from France (17.6%, a difference of 0.46%).
| Demographics | Rating | Rank | 3 or more Vehicles in Household |
| Immigrants | Panama | 0.8 /100 | #265 | Tragic 17.7% |
| Macedonians | 0.8 /100 | #266 | Tragic 17.7% |
| Immigrants | Venezuela | 0.8 /100 | #267 | Tragic 17.7% |
| Immigrants | Bulgaria | 0.8 /100 | #268 | Tragic 17.7% |
| Immigrants | France | 0.6 /100 | #269 | Tragic 17.6% |
| Immigrants | Nepal | 0.6 /100 | #270 | Tragic 17.6% |
| South Americans | 0.6 /100 | #271 | Tragic 17.6% |
| Immigrants | Africa | 0.5 /100 | #272 | Tragic 17.6% |
| Immigrants | Sudan | 0.5 /100 | #273 | Tragic 17.6% |
| Immigrants | Bosnia and Herzegovina | 0.5 /100 | #274 | Tragic 17.5% |
| Immigrants | Ukraine | 0.4 /100 | #275 | Tragic 17.5% |
| Okinawans | 0.4 /100 | #276 | Tragic 17.4% |
| Brazilians | 0.4 /100 | #277 | Tragic 17.4% |
| Immigrants | Bahamas | 0.3 /100 | #278 | Tragic 17.4% |
| Immigrants | Kazakhstan | 0.3 /100 | #279 | Tragic 17.4% |
Demographics Similar to Immigrants from China by 3 or more Vehicles in Household
In terms of 3 or more vehicles in household, the demographic groups most similar to Immigrants from China are Immigrants from Honduras (18.2%, a difference of 0.13%), Immigrants from Middle Africa (18.2%, a difference of 0.13%), African (18.2%, a difference of 0.20%), Hopi (18.2%, a difference of 0.31%), and Indonesian (18.3%, a difference of 0.36%).
| Demographics | Rating | Rank | 3 or more Vehicles in Household |
| Hondurans | 4.6 /100 | #233 | Tragic 18.4% |
| Immigrants | North Macedonia | 4.4 /100 | #234 | Tragic 18.4% |
| Sierra Leoneans | 3.9 /100 | #235 | Tragic 18.3% |
| Immigrants | Malaysia | 3.6 /100 | #236 | Tragic 18.3% |
| Indonesians | 3.5 /100 | #237 | Tragic 18.3% |
| Immigrants | Honduras | 3.1 /100 | #238 | Tragic 18.2% |
| Immigrants | Middle Africa | 3.1 /100 | #239 | Tragic 18.2% |
| Immigrants | China | 2.9 /100 | #240 | Tragic 18.2% |
| Africans | 2.7 /100 | #241 | Tragic 18.2% |
| Hopi | 2.5 /100 | #242 | Tragic 18.2% |
| Immigrants | Europe | 2.4 /100 | #243 | Tragic 18.1% |
| Mongolians | 2.3 /100 | #244 | Tragic 18.1% |
| Immigrants | Belize | 2.1 /100 | #245 | Tragic 18.1% |
| Immigrants | Australia | 2.0 /100 | #246 | Tragic 18.1% |
| Carpatho Rusyns | 1.9 /100 | #247 | Tragic 18.0% |