Immigrants from Africa vs Immigrants from Norway 3 or more Vehicles in Household
COMPARE
Immigrants from Africa
Immigrants from Norway
3 or more Vehicles in Household
3 or more Vehicles in Household Comparison
Immigrants from Africa
Immigrants from Norway
17.6%
3 OR MORE VEHICLES IN HOUSEHOLD
0.5/ 100
METRIC RATING
272nd/ 347
METRIC RANK
19.0%
3 OR MORE VEHICLES IN HOUSEHOLD
19.0/ 100
METRIC RATING
199th/ 347
METRIC RANK
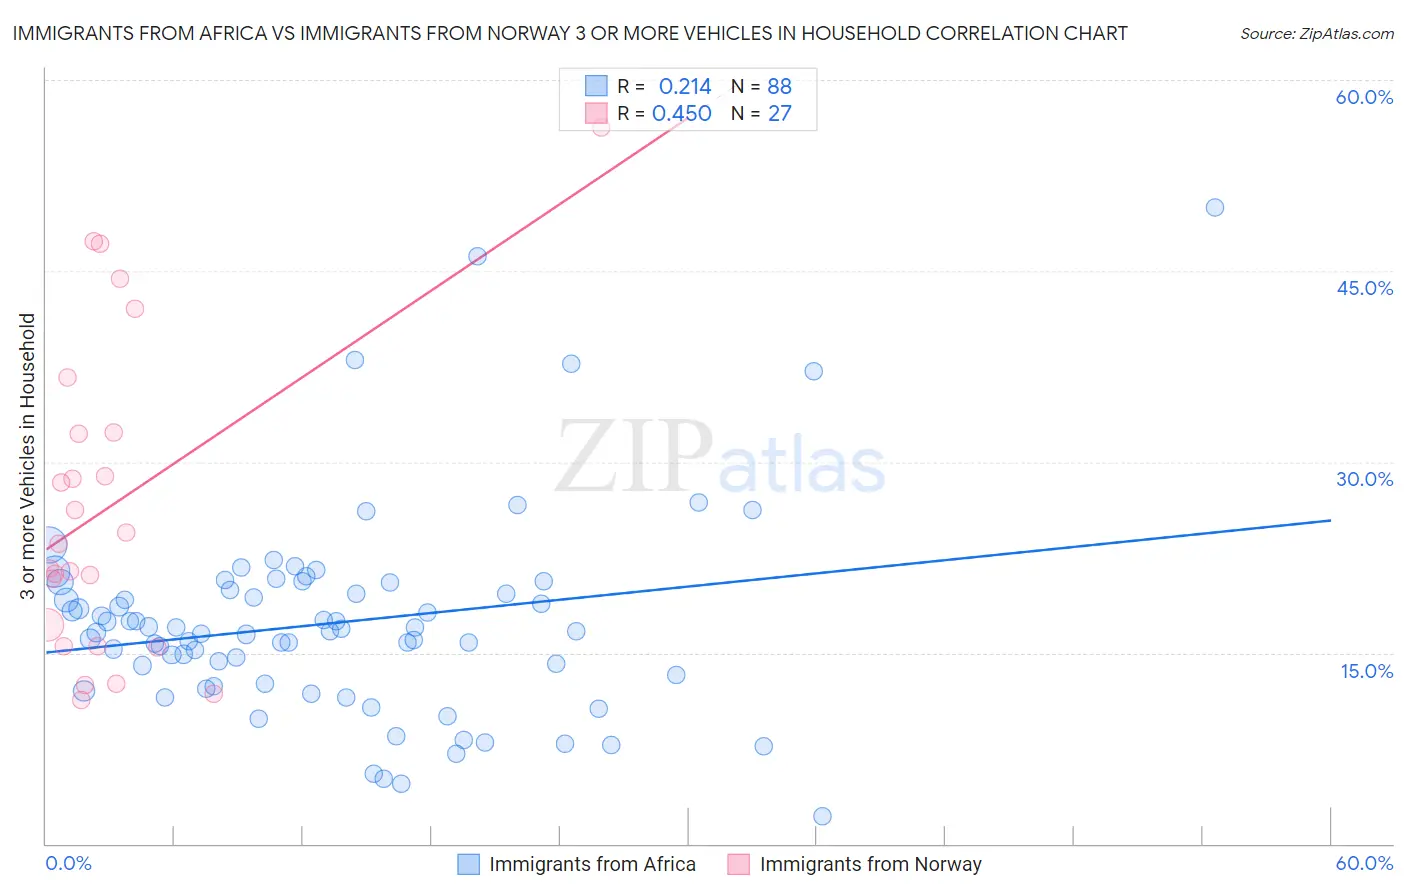
Immigrants from Africa vs Immigrants from Norway 3 or more Vehicles in Household Correlation Chart
The statistical analysis conducted on geographies consisting of 468,754,030 people shows a weak positive correlation between the proportion of Immigrants from Africa and percentage of households with 3 or more vehicles available in the United States with a correlation coefficient (R) of 0.214 and weighted average of 17.6%. Similarly, the statistical analysis conducted on geographies consisting of 116,675,464 people shows a moderate positive correlation between the proportion of Immigrants from Norway and percentage of households with 3 or more vehicles available in the United States with a correlation coefficient (R) of 0.450 and weighted average of 19.0%, a difference of 8.0%.
3 or more Vehicles in Household Correlation Summary
| Measurement | Immigrants from Africa | Immigrants from Norway |
| Minimum | 2.2% | 11.3% |
| Maximum | 50.0% | 56.2% |
| Range | 47.8% | 45.0% |
| Mean | 17.4% | 26.5% |
| Median | 16.7% | 23.6% |
| Interquartile 25% (IQ1) | 12.9% | 15.5% |
| Interquartile 75% (IQ3) | 20.2% | 32.3% |
| Interquartile Range (IQR) | 7.3% | 16.8% |
| Standard Deviation (Sample) | 8.0% | 12.3% |
| Standard Deviation (Population) | 7.9% | 12.1% |
Similar Demographics by 3 or more Vehicles in Household
Demographics Similar to Immigrants from Africa by 3 or more Vehicles in Household
In terms of 3 or more vehicles in household, the demographic groups most similar to Immigrants from Africa are Immigrants from Sudan (17.6%, a difference of 0.040%), Immigrants from Bosnia and Herzegovina (17.5%, a difference of 0.18%), Immigrants from Nepal (17.6%, a difference of 0.41%), South American (17.6%, a difference of 0.41%), and Immigrants from France (17.6%, a difference of 0.46%).
| Demographics | Rating | Rank | 3 or more Vehicles in Household |
| Immigrants | Panama | 0.8 /100 | #265 | Tragic 17.7% |
| Macedonians | 0.8 /100 | #266 | Tragic 17.7% |
| Immigrants | Venezuela | 0.8 /100 | #267 | Tragic 17.7% |
| Immigrants | Bulgaria | 0.8 /100 | #268 | Tragic 17.7% |
| Immigrants | France | 0.6 /100 | #269 | Tragic 17.6% |
| Immigrants | Nepal | 0.6 /100 | #270 | Tragic 17.6% |
| South Americans | 0.6 /100 | #271 | Tragic 17.6% |
| Immigrants | Africa | 0.5 /100 | #272 | Tragic 17.6% |
| Immigrants | Sudan | 0.5 /100 | #273 | Tragic 17.6% |
| Immigrants | Bosnia and Herzegovina | 0.5 /100 | #274 | Tragic 17.5% |
| Immigrants | Ukraine | 0.4 /100 | #275 | Tragic 17.5% |
| Okinawans | 0.4 /100 | #276 | Tragic 17.4% |
| Brazilians | 0.4 /100 | #277 | Tragic 17.4% |
| Immigrants | Bahamas | 0.3 /100 | #278 | Tragic 17.4% |
| Immigrants | Kazakhstan | 0.3 /100 | #279 | Tragic 17.4% |
Demographics Similar to Immigrants from Norway by 3 or more Vehicles in Household
In terms of 3 or more vehicles in household, the demographic groups most similar to Immigrants from Norway are Egyptian (19.0%, a difference of 0.060%), Argentinean (18.9%, a difference of 0.10%), Arab (18.9%, a difference of 0.16%), Immigrants from Japan (19.0%, a difference of 0.36%), and Central American Indian (19.0%, a difference of 0.39%).
| Demographics | Rating | Rank | 3 or more Vehicles in Household |
| Kenyans | 24.7 /100 | #192 | Fair 19.1% |
| Tsimshian | 24.4 /100 | #193 | Fair 19.1% |
| Serbians | 24.0 /100 | #194 | Fair 19.1% |
| Immigrants | Moldova | 23.6 /100 | #195 | Fair 19.1% |
| Central American Indians | 22.2 /100 | #196 | Fair 19.0% |
| Immigrants | Japan | 22.0 /100 | #197 | Fair 19.0% |
| Egyptians | 19.5 /100 | #198 | Poor 19.0% |
| Immigrants | Norway | 19.0 /100 | #199 | Poor 19.0% |
| Argentineans | 18.2 /100 | #200 | Poor 18.9% |
| Arabs | 17.7 /100 | #201 | Poor 18.9% |
| Immigrants | Austria | 15.4 /100 | #202 | Poor 18.9% |
| Tohono O'odham | 14.8 /100 | #203 | Poor 18.9% |
| Immigrants | Romania | 14.6 /100 | #204 | Poor 18.9% |
| Russians | 14.2 /100 | #205 | Poor 18.8% |
| Immigrants | Eastern Asia | 14.1 /100 | #206 | Poor 18.8% |