Dutch West Indian vs Comanche 3 or more Vehicles in Household
COMPARE
Dutch West Indian
Comanche
3 or more Vehicles in Household
3 or more Vehicles in Household Comparison
Dutch West Indians
Comanche
20.9%
3 OR MORE VEHICLES IN HOUSEHOLD
97.8/ 100
METRIC RATING
103rd/ 347
METRIC RANK
21.0%
3 OR MORE VEHICLES IN HOUSEHOLD
98.2/ 100
METRIC RATING
100th/ 347
METRIC RANK
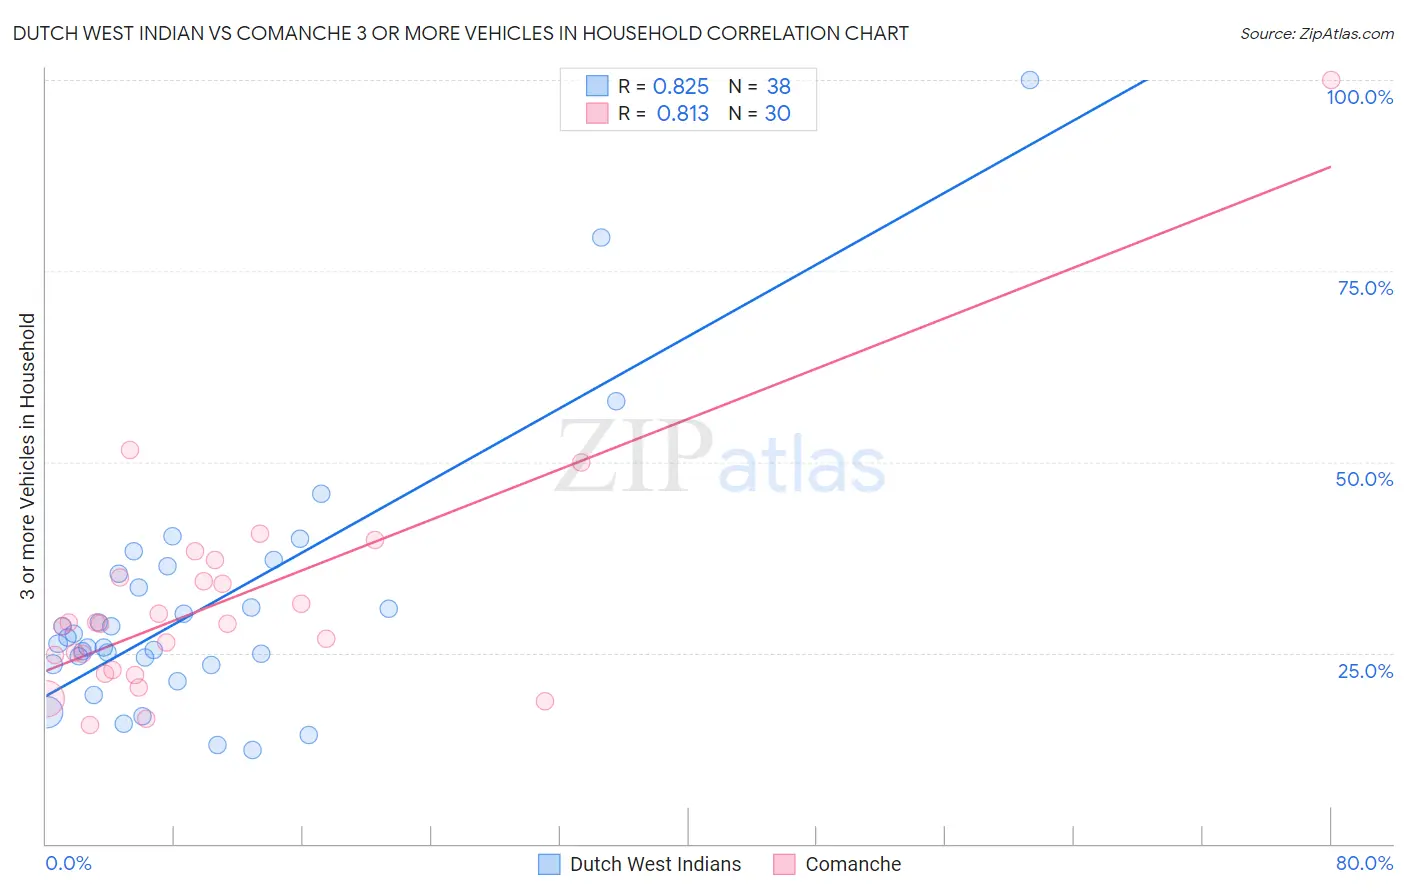
Dutch West Indian vs Comanche 3 or more Vehicles in Household Correlation Chart
The statistical analysis conducted on geographies consisting of 85,766,140 people shows a very strong positive correlation between the proportion of Dutch West Indians and percentage of households with 3 or more vehicles available in the United States with a correlation coefficient (R) of 0.825 and weighted average of 20.9%. Similarly, the statistical analysis conducted on geographies consisting of 109,768,043 people shows a very strong positive correlation between the proportion of Comanche and percentage of households with 3 or more vehicles available in the United States with a correlation coefficient (R) of 0.813 and weighted average of 21.0%, a difference of 0.38%.
3 or more Vehicles in Household Correlation Summary
| Measurement | Dutch West Indian | Comanche |
| Minimum | 12.2% | 15.6% |
| Maximum | 100.0% | 100.0% |
| Range | 87.8% | 84.4% |
| Mean | 31.1% | 31.7% |
| Median | 26.6% | 28.8% |
| Interquartile 25% (IQ1) | 23.5% | 22.8% |
| Interquartile 75% (IQ3) | 35.3% | 34.9% |
| Interquartile Range (IQR) | 11.8% | 12.1% |
| Standard Deviation (Sample) | 16.9% | 15.6% |
| Standard Deviation (Population) | 16.7% | 15.4% |
Demographics Similar to Dutch West Indians and Comanche by 3 or more Vehicles in Household
In terms of 3 or more vehicles in household, the demographic groups most similar to Dutch West Indians are Seminole (20.9%, a difference of 0.040%), Blackfeet (20.9%, a difference of 0.070%), Luxembourger (20.9%, a difference of 0.080%), Austrian (20.9%, a difference of 0.19%), and Bolivian (20.8%, a difference of 0.28%). Similarly, the demographic groups most similar to Comanche are Hmong (21.0%, a difference of 0.040%), Alaska Native (21.0%, a difference of 0.040%), Canadian (21.0%, a difference of 0.10%), Cree (21.0%, a difference of 0.21%), and Pakistani (21.0%, a difference of 0.30%).
| Demographics | Rating | Rank | 3 or more Vehicles in Household |
| Belgians | 98.9 /100 | #91 | Exceptional 21.2% |
| Apache | 98.9 /100 | #92 | Exceptional 21.2% |
| Immigrants | Indonesia | 98.8 /100 | #93 | Exceptional 21.1% |
| Immigrants | Cambodia | 98.6 /100 | #94 | Exceptional 21.1% |
| Pakistanis | 98.5 /100 | #95 | Exceptional 21.0% |
| Cree | 98.4 /100 | #96 | Exceptional 21.0% |
| Canadians | 98.3 /100 | #97 | Exceptional 21.0% |
| Hmong | 98.2 /100 | #98 | Exceptional 21.0% |
| Alaska Natives | 98.2 /100 | #99 | Exceptional 21.0% |
| Comanche | 98.2 /100 | #100 | Exceptional 21.0% |
| Blackfeet | 97.9 /100 | #101 | Exceptional 20.9% |
| Seminole | 97.8 /100 | #102 | Exceptional 20.9% |
| Dutch West Indians | 97.8 /100 | #103 | Exceptional 20.9% |
| Luxembourgers | 97.7 /100 | #104 | Exceptional 20.9% |
| Austrians | 97.5 /100 | #105 | Exceptional 20.9% |
| Bolivians | 97.4 /100 | #106 | Exceptional 20.8% |
| Immigrants | Germany | 97.4 /100 | #107 | Exceptional 20.8% |
| Immigrants | Scotland | 97.1 /100 | #108 | Exceptional 20.8% |
| Filipinos | 97.0 /100 | #109 | Exceptional 20.8% |
| Asians | 96.8 /100 | #110 | Exceptional 20.8% |
| Immigrants | Micronesia | 96.7 /100 | #111 | Exceptional 20.7% |