Dutch West Indian vs Czech 3 or more Vehicles in Household
COMPARE
Dutch West Indian
Czech
3 or more Vehicles in Household
3 or more Vehicles in Household Comparison
Dutch West Indians
Czechs
20.9%
3 OR MORE VEHICLES IN HOUSEHOLD
97.8/ 100
METRIC RATING
103rd/ 347
METRIC RANK
22.5%
3 OR MORE VEHICLES IN HOUSEHOLD
100.0/ 100
METRIC RATING
53rd/ 347
METRIC RANK
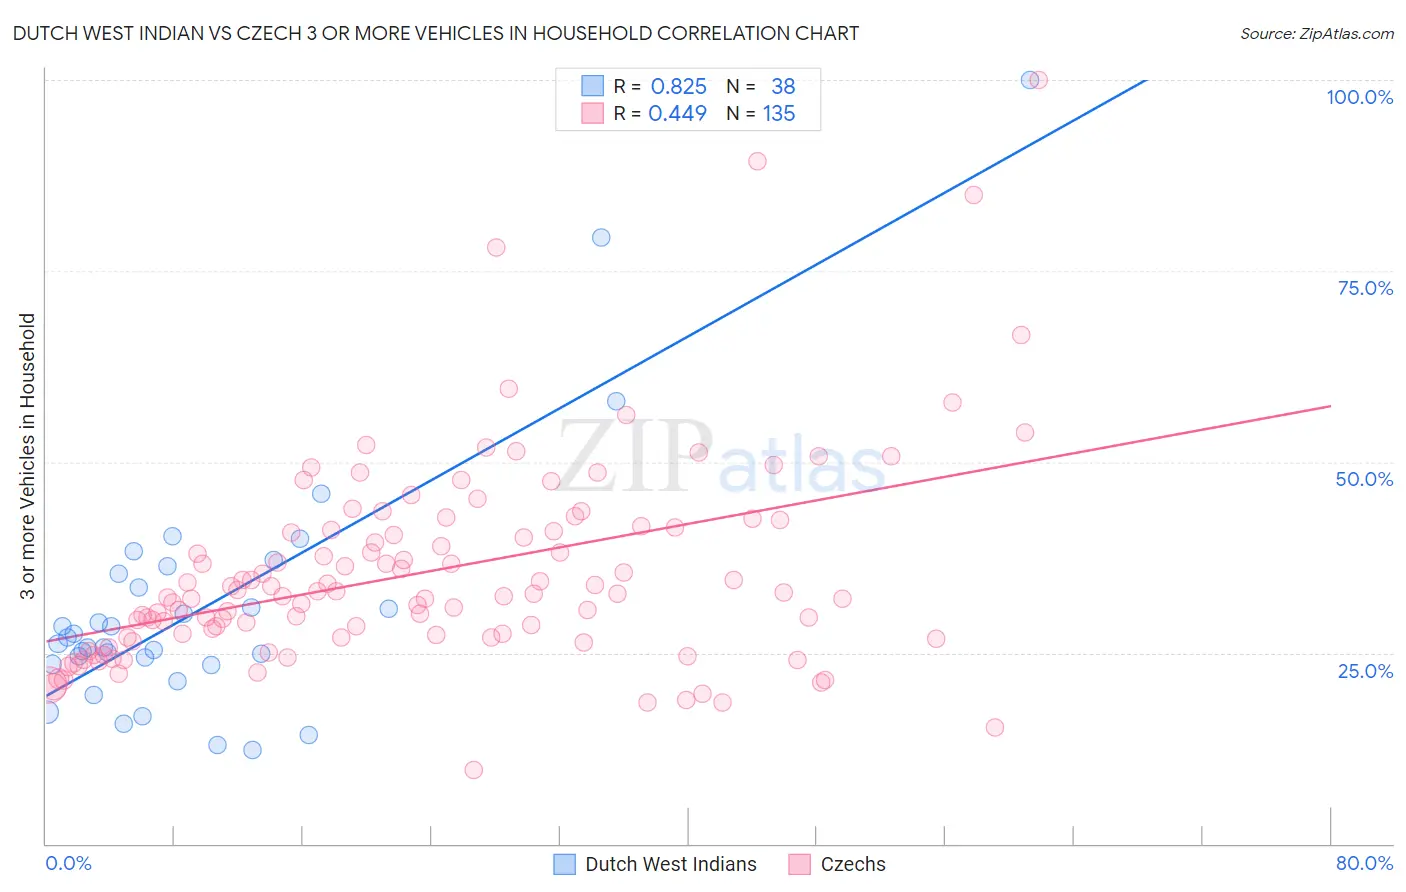
Dutch West Indian vs Czech 3 or more Vehicles in Household Correlation Chart
The statistical analysis conducted on geographies consisting of 85,766,140 people shows a very strong positive correlation between the proportion of Dutch West Indians and percentage of households with 3 or more vehicles available in the United States with a correlation coefficient (R) of 0.825 and weighted average of 20.9%. Similarly, the statistical analysis conducted on geographies consisting of 484,303,845 people shows a moderate positive correlation between the proportion of Czechs and percentage of households with 3 or more vehicles available in the United States with a correlation coefficient (R) of 0.449 and weighted average of 22.5%, a difference of 7.7%.
3 or more Vehicles in Household Correlation Summary
| Measurement | Dutch West Indian | Czech |
| Minimum | 12.2% | 9.6% |
| Maximum | 100.0% | 100.0% |
| Range | 87.8% | 90.4% |
| Mean | 31.1% | 35.5% |
| Median | 26.6% | 32.7% |
| Interquartile 25% (IQ1) | 23.5% | 27.0% |
| Interquartile 75% (IQ3) | 35.3% | 41.0% |
| Interquartile Range (IQR) | 11.8% | 14.0% |
| Standard Deviation (Sample) | 16.9% | 13.6% |
| Standard Deviation (Population) | 16.7% | 13.6% |
Similar Demographics by 3 or more Vehicles in Household
Demographics Similar to Dutch West Indians by 3 or more Vehicles in Household
In terms of 3 or more vehicles in household, the demographic groups most similar to Dutch West Indians are Seminole (20.9%, a difference of 0.040%), Blackfeet (20.9%, a difference of 0.070%), Luxembourger (20.9%, a difference of 0.080%), Austrian (20.9%, a difference of 0.19%), and Bolivian (20.8%, a difference of 0.28%).
| Demographics | Rating | Rank | 3 or more Vehicles in Household |
| Cree | 98.4 /100 | #96 | Exceptional 21.0% |
| Canadians | 98.3 /100 | #97 | Exceptional 21.0% |
| Hmong | 98.2 /100 | #98 | Exceptional 21.0% |
| Alaska Natives | 98.2 /100 | #99 | Exceptional 21.0% |
| Comanche | 98.2 /100 | #100 | Exceptional 21.0% |
| Blackfeet | 97.9 /100 | #101 | Exceptional 20.9% |
| Seminole | 97.8 /100 | #102 | Exceptional 20.9% |
| Dutch West Indians | 97.8 /100 | #103 | Exceptional 20.9% |
| Luxembourgers | 97.7 /100 | #104 | Exceptional 20.9% |
| Austrians | 97.5 /100 | #105 | Exceptional 20.9% |
| Bolivians | 97.4 /100 | #106 | Exceptional 20.8% |
| Immigrants | Germany | 97.4 /100 | #107 | Exceptional 20.8% |
| Immigrants | Scotland | 97.1 /100 | #108 | Exceptional 20.8% |
| Filipinos | 97.0 /100 | #109 | Exceptional 20.8% |
| Asians | 96.8 /100 | #110 | Exceptional 20.8% |
Demographics Similar to Czechs by 3 or more Vehicles in Household
In terms of 3 or more vehicles in household, the demographic groups most similar to Czechs are Crow (22.5%, a difference of 0.21%), Welsh (22.6%, a difference of 0.25%), White/Caucasian (22.6%, a difference of 0.29%), Sioux (22.6%, a difference of 0.30%), and Scotch-Irish (22.6%, a difference of 0.36%).
| Demographics | Rating | Rank | 3 or more Vehicles in Household |
| Americans | 100.0 /100 | #46 | Exceptional 22.6% |
| Malaysians | 100.0 /100 | #47 | Exceptional 22.6% |
| Scottish | 100.0 /100 | #48 | Exceptional 22.6% |
| Scotch-Irish | 100.0 /100 | #49 | Exceptional 22.6% |
| Sioux | 100.0 /100 | #50 | Exceptional 22.6% |
| Whites/Caucasians | 100.0 /100 | #51 | Exceptional 22.6% |
| Welsh | 100.0 /100 | #52 | Exceptional 22.6% |
| Czechs | 100.0 /100 | #53 | Exceptional 22.5% |
| Crow | 100.0 /100 | #54 | Exceptional 22.5% |
| Immigrants | Laos | 100.0 /100 | #55 | Exceptional 22.4% |
| Hispanics or Latinos | 100.0 /100 | #56 | Exceptional 22.4% |
| Pennsylvania Germans | 100.0 /100 | #57 | Exceptional 22.3% |
| Spaniards | 100.0 /100 | #58 | Exceptional 22.3% |
| Navajo | 100.0 /100 | #59 | Exceptional 22.3% |
| Finns | 99.9 /100 | #60 | Exceptional 22.3% |