Carpatho Rusyn vs Egyptian 3 or more Vehicles in Household
COMPARE
Carpatho Rusyn
Egyptian
3 or more Vehicles in Household
3 or more Vehicles in Household Comparison
Carpatho Rusyns
Egyptians
18.0%
3 OR MORE VEHICLES IN HOUSEHOLD
1.9/ 100
METRIC RATING
247th/ 347
METRIC RANK
19.0%
3 OR MORE VEHICLES IN HOUSEHOLD
19.5/ 100
METRIC RATING
198th/ 347
METRIC RANK
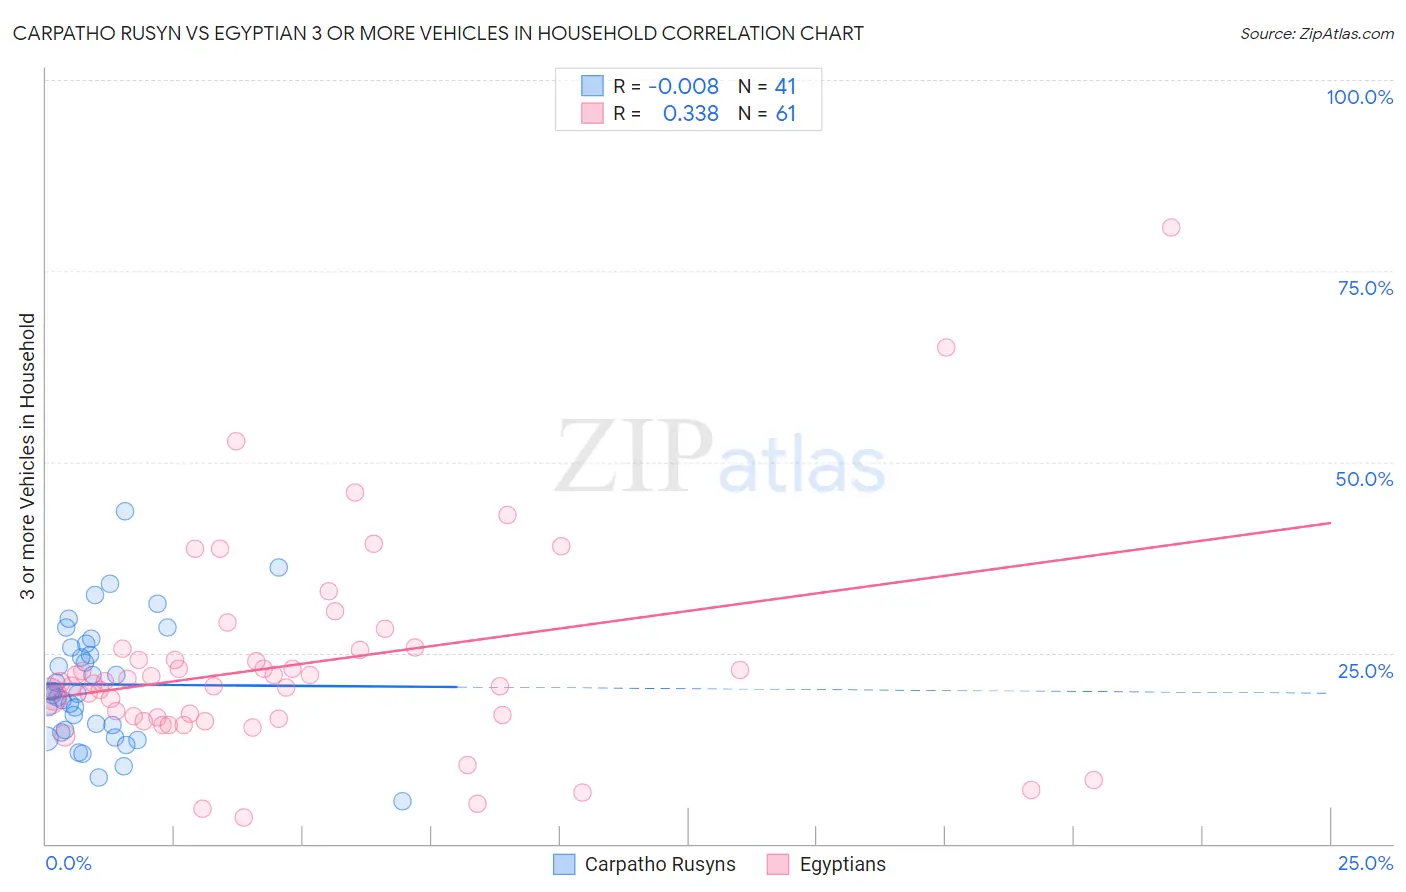
Carpatho Rusyn vs Egyptian 3 or more Vehicles in Household Correlation Chart
The statistical analysis conducted on geographies consisting of 58,865,227 people shows no correlation between the proportion of Carpatho Rusyns and percentage of households with 3 or more vehicles available in the United States with a correlation coefficient (R) of -0.008 and weighted average of 18.0%. Similarly, the statistical analysis conducted on geographies consisting of 276,676,150 people shows a mild positive correlation between the proportion of Egyptians and percentage of households with 3 or more vehicles available in the United States with a correlation coefficient (R) of 0.338 and weighted average of 19.0%, a difference of 5.2%.
3 or more Vehicles in Household Correlation Summary
| Measurement | Carpatho Rusyn | Egyptian |
| Minimum | 5.5% | 3.4% |
| Maximum | 43.5% | 80.8% |
| Range | 38.0% | 77.3% |
| Mean | 20.9% | 23.5% |
| Median | 19.7% | 21.1% |
| Interquartile 25% (IQ1) | 14.7% | 16.5% |
| Interquartile 75% (IQ3) | 26.0% | 25.5% |
| Interquartile Range (IQR) | 11.3% | 9.0% |
| Standard Deviation (Sample) | 8.0% | 13.4% |
| Standard Deviation (Population) | 7.9% | 13.3% |
Similar Demographics by 3 or more Vehicles in Household
Demographics Similar to Carpatho Rusyns by 3 or more Vehicles in Household
In terms of 3 or more vehicles in household, the demographic groups most similar to Carpatho Rusyns are Immigrants from Eastern Africa (18.0%, a difference of 0.13%), Immigrants from Australia (18.1%, a difference of 0.16%), Immigrants from Saudi Arabia (18.0%, a difference of 0.19%), Venezuelan (18.0%, a difference of 0.21%), and Immigrants from Belize (18.1%, a difference of 0.23%).
| Demographics | Rating | Rank | 3 or more Vehicles in Household |
| Immigrants | China | 2.9 /100 | #240 | Tragic 18.2% |
| Africans | 2.7 /100 | #241 | Tragic 18.2% |
| Hopi | 2.5 /100 | #242 | Tragic 18.2% |
| Immigrants | Europe | 2.4 /100 | #243 | Tragic 18.1% |
| Mongolians | 2.3 /100 | #244 | Tragic 18.1% |
| Immigrants | Belize | 2.1 /100 | #245 | Tragic 18.1% |
| Immigrants | Australia | 2.0 /100 | #246 | Tragic 18.1% |
| Carpatho Rusyns | 1.9 /100 | #247 | Tragic 18.0% |
| Immigrants | Eastern Africa | 1.8 /100 | #248 | Tragic 18.0% |
| Immigrants | Saudi Arabia | 1.7 /100 | #249 | Tragic 18.0% |
| Venezuelans | 1.7 /100 | #250 | Tragic 18.0% |
| Alsatians | 1.5 /100 | #251 | Tragic 18.0% |
| Immigrants | Southern Europe | 1.4 /100 | #252 | Tragic 17.9% |
| Immigrants | Ethiopia | 1.3 /100 | #253 | Tragic 17.9% |
| Ethiopians | 1.2 /100 | #254 | Tragic 17.9% |
Demographics Similar to Egyptians by 3 or more Vehicles in Household
In terms of 3 or more vehicles in household, the demographic groups most similar to Egyptians are Immigrants from Norway (19.0%, a difference of 0.060%), Argentinean (18.9%, a difference of 0.17%), Arab (18.9%, a difference of 0.22%), Immigrants from Japan (19.0%, a difference of 0.30%), and Central American Indian (19.0%, a difference of 0.32%).
| Demographics | Rating | Rank | 3 or more Vehicles in Household |
| South American Indians | 25.4 /100 | #191 | Fair 19.1% |
| Kenyans | 24.7 /100 | #192 | Fair 19.1% |
| Tsimshian | 24.4 /100 | #193 | Fair 19.1% |
| Serbians | 24.0 /100 | #194 | Fair 19.1% |
| Immigrants | Moldova | 23.6 /100 | #195 | Fair 19.1% |
| Central American Indians | 22.2 /100 | #196 | Fair 19.0% |
| Immigrants | Japan | 22.0 /100 | #197 | Fair 19.0% |
| Egyptians | 19.5 /100 | #198 | Poor 19.0% |
| Immigrants | Norway | 19.0 /100 | #199 | Poor 19.0% |
| Argentineans | 18.2 /100 | #200 | Poor 18.9% |
| Arabs | 17.7 /100 | #201 | Poor 18.9% |
| Immigrants | Austria | 15.4 /100 | #202 | Poor 18.9% |
| Tohono O'odham | 14.8 /100 | #203 | Poor 18.9% |
| Immigrants | Romania | 14.6 /100 | #204 | Poor 18.9% |
| Russians | 14.2 /100 | #205 | Poor 18.8% |