Carpatho Rusyn vs Immigrants from Italy 3 or more Vehicles in Household
COMPARE
Carpatho Rusyn
Immigrants from Italy
3 or more Vehicles in Household
3 or more Vehicles in Household Comparison
Carpatho Rusyns
Immigrants from Italy
18.0%
3 OR MORE VEHICLES IN HOUSEHOLD
1.9/ 100
METRIC RATING
247th/ 347
METRIC RANK
18.7%
3 OR MORE VEHICLES IN HOUSEHOLD
10.2/ 100
METRIC RATING
217th/ 347
METRIC RANK
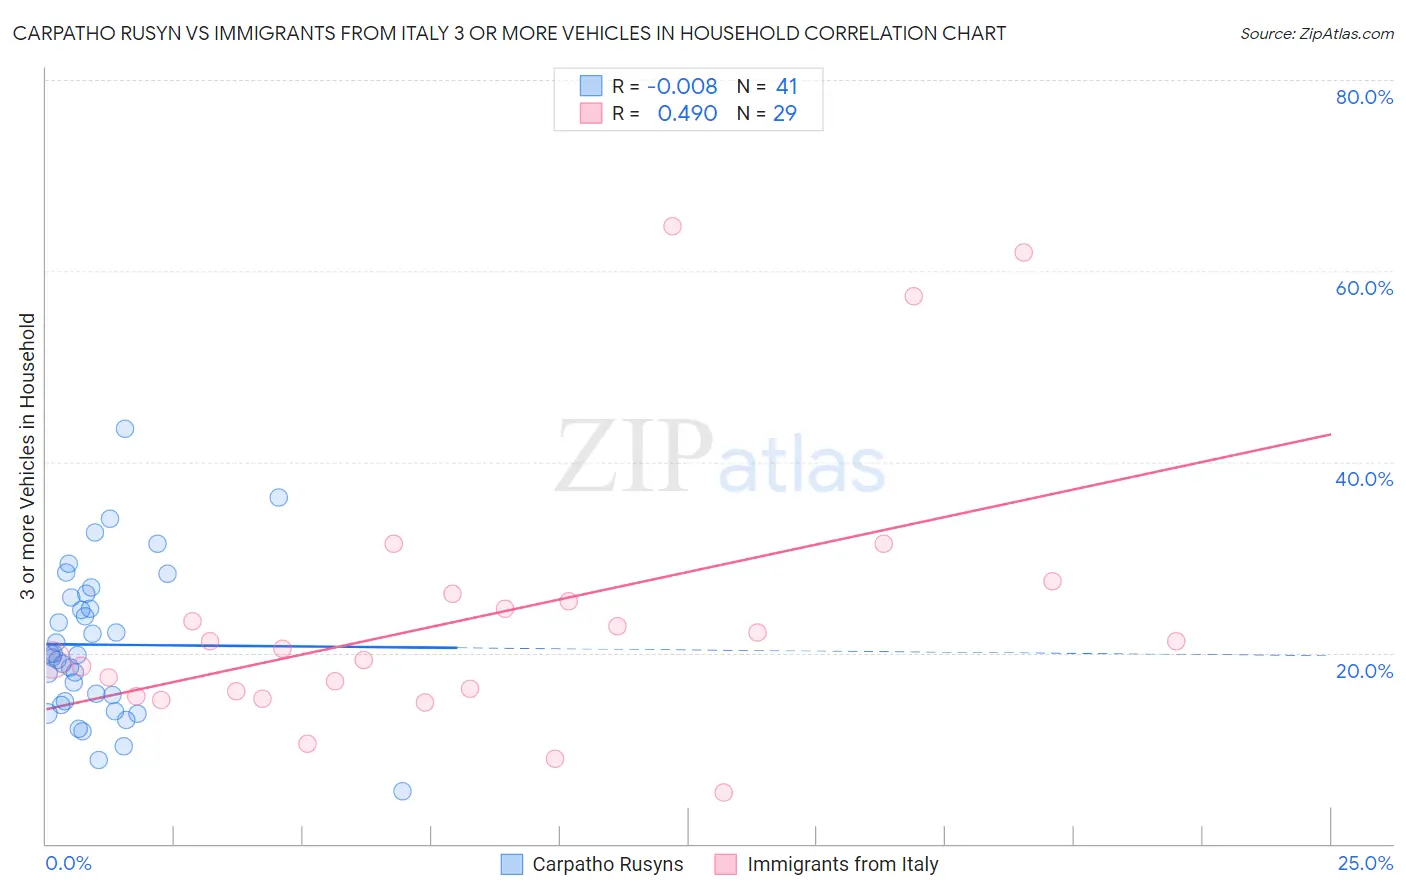
Carpatho Rusyn vs Immigrants from Italy 3 or more Vehicles in Household Correlation Chart
The statistical analysis conducted on geographies consisting of 58,865,227 people shows no correlation between the proportion of Carpatho Rusyns and percentage of households with 3 or more vehicles available in the United States with a correlation coefficient (R) of -0.008 and weighted average of 18.0%. Similarly, the statistical analysis conducted on geographies consisting of 324,064,061 people shows a moderate positive correlation between the proportion of Immigrants from Italy and percentage of households with 3 or more vehicles available in the United States with a correlation coefficient (R) of 0.490 and weighted average of 18.7%, a difference of 3.6%.
3 or more Vehicles in Household Correlation Summary
| Measurement | Carpatho Rusyn | Immigrants from Italy |
| Minimum | 5.5% | 5.4% |
| Maximum | 43.5% | 64.7% |
| Range | 38.0% | 59.3% |
| Mean | 20.9% | 23.8% |
| Median | 19.7% | 20.4% |
| Interquartile 25% (IQ1) | 14.7% | 15.7% |
| Interquartile 75% (IQ3) | 26.0% | 25.7% |
| Interquartile Range (IQR) | 11.3% | 10.0% |
| Standard Deviation (Sample) | 8.0% | 14.3% |
| Standard Deviation (Population) | 7.9% | 14.1% |
Similar Demographics by 3 or more Vehicles in Household
Demographics Similar to Carpatho Rusyns by 3 or more Vehicles in Household
In terms of 3 or more vehicles in household, the demographic groups most similar to Carpatho Rusyns are Immigrants from Eastern Africa (18.0%, a difference of 0.13%), Immigrants from Australia (18.1%, a difference of 0.16%), Immigrants from Saudi Arabia (18.0%, a difference of 0.19%), Venezuelan (18.0%, a difference of 0.21%), and Immigrants from Belize (18.1%, a difference of 0.23%).
| Demographics | Rating | Rank | 3 or more Vehicles in Household |
| Immigrants | China | 2.9 /100 | #240 | Tragic 18.2% |
| Africans | 2.7 /100 | #241 | Tragic 18.2% |
| Hopi | 2.5 /100 | #242 | Tragic 18.2% |
| Immigrants | Europe | 2.4 /100 | #243 | Tragic 18.1% |
| Mongolians | 2.3 /100 | #244 | Tragic 18.1% |
| Immigrants | Belize | 2.1 /100 | #245 | Tragic 18.1% |
| Immigrants | Australia | 2.0 /100 | #246 | Tragic 18.1% |
| Carpatho Rusyns | 1.9 /100 | #247 | Tragic 18.0% |
| Immigrants | Eastern Africa | 1.8 /100 | #248 | Tragic 18.0% |
| Immigrants | Saudi Arabia | 1.7 /100 | #249 | Tragic 18.0% |
| Venezuelans | 1.7 /100 | #250 | Tragic 18.0% |
| Alsatians | 1.5 /100 | #251 | Tragic 18.0% |
| Immigrants | Southern Europe | 1.4 /100 | #252 | Tragic 17.9% |
| Immigrants | Ethiopia | 1.3 /100 | #253 | Tragic 17.9% |
| Ethiopians | 1.2 /100 | #254 | Tragic 17.9% |
Demographics Similar to Immigrants from Italy by 3 or more Vehicles in Household
In terms of 3 or more vehicles in household, the demographic groups most similar to Immigrants from Italy are Immigrants from Nigeria (18.7%, a difference of 0.020%), Eastern European (18.7%, a difference of 0.080%), Immigrants from Sierra Leone (18.7%, a difference of 0.13%), Panamanian (18.8%, a difference of 0.28%), and Immigrants from Cuba (18.8%, a difference of 0.28%).
| Demographics | Rating | Rank | 3 or more Vehicles in Household |
| Bulgarians | 13.1 /100 | #210 | Poor 18.8% |
| Immigrants | Kenya | 12.4 /100 | #211 | Poor 18.8% |
| Panamanians | 11.6 /100 | #212 | Poor 18.8% |
| Immigrants | Cuba | 11.6 /100 | #213 | Poor 18.8% |
| Immigrants | Sierra Leone | 10.8 /100 | #214 | Poor 18.7% |
| Eastern Europeans | 10.6 /100 | #215 | Poor 18.7% |
| Immigrants | Nigeria | 10.3 /100 | #216 | Poor 18.7% |
| Immigrants | Italy | 10.2 /100 | #217 | Poor 18.7% |
| Immigrants | Portugal | 8.9 /100 | #218 | Tragic 18.6% |
| Immigrants | Armenia | 8.6 /100 | #219 | Tragic 18.6% |
| Nigerians | 7.9 /100 | #220 | Tragic 18.6% |
| Immigrants | Poland | 7.5 /100 | #221 | Tragic 18.6% |
| Belizeans | 7.3 /100 | #222 | Tragic 18.6% |
| Immigrants | Czechoslovakia | 5.9 /100 | #223 | Tragic 18.5% |
| Immigrants | Argentina | 5.6 /100 | #224 | Tragic 18.5% |