Carpatho Rusyn 1 or more Vehicles in Household
COMPARE
Carpatho Rusyn
Select to Compare
1 or more Vehicles in Household
Carpatho Rusyn 1 or more Vehicles in Household
89.5%
1+ VEHICLES AVAILABLE
37.8/ 100
METRIC RATING
189th/ 347
METRIC RANK
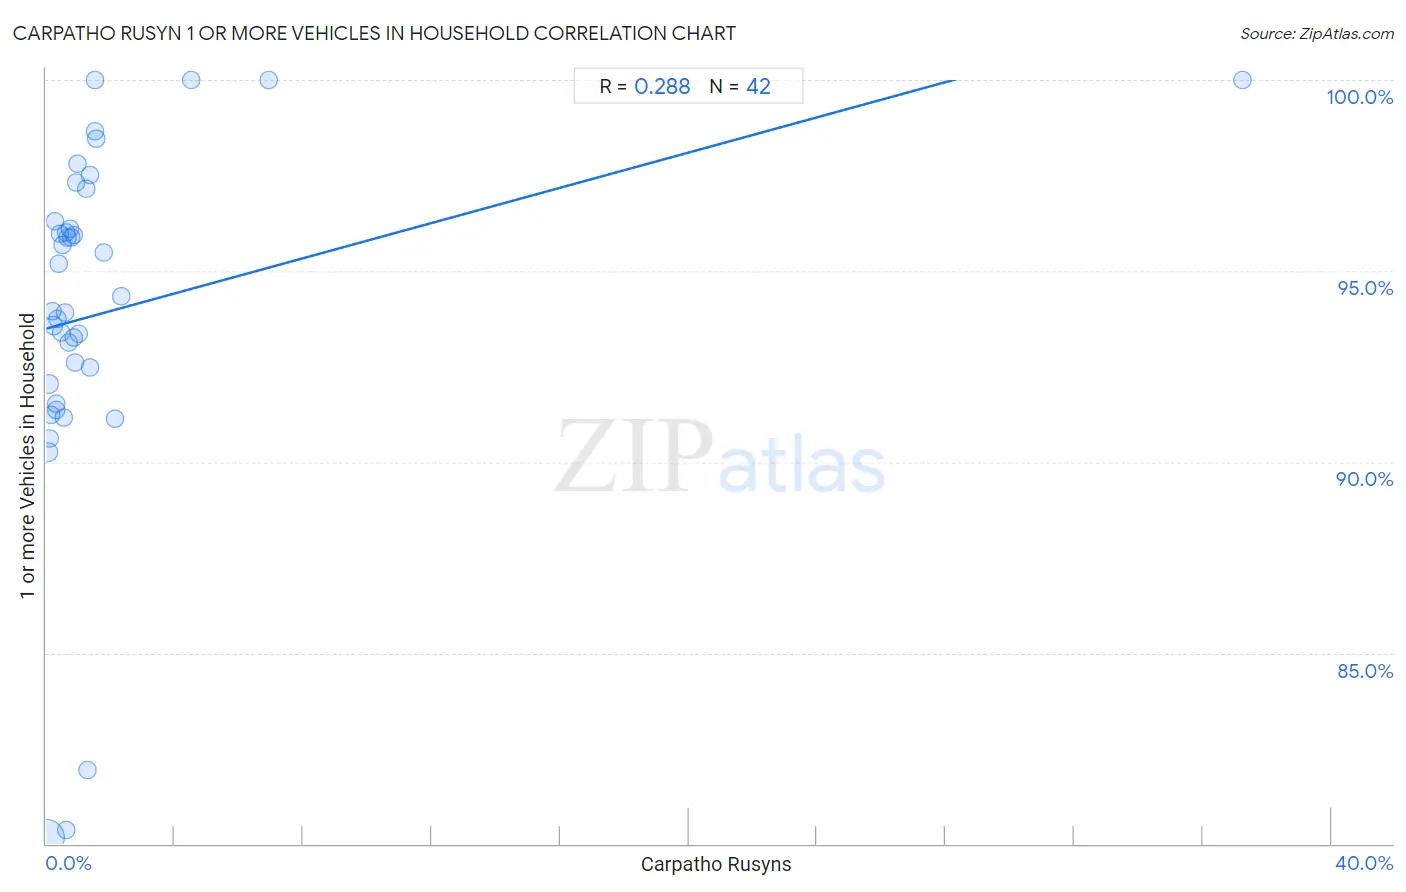
Carpatho Rusyn 1 or more Vehicles in Household Correlation Chart
The statistical analysis conducted on geographies consisting of 58,871,690 people shows a weak positive correlation between the proportion of Carpatho Rusyns and percentage of households with 1 or more vehicles available in the United States with a correlation coefficient (R) of 0.288 and weighted average of 89.5%. On average, for every 1% (one percent) increase in Carpatho Rusyns within a typical geography, there is an increase of 0.23% in percentage of households with 1 or more vehicles available.
It is essential to understand that the correlation between the percentage of Carpatho Rusyns and percentage of households with 1 or more vehicles available does not imply a direct cause-and-effect relationship. It remains uncertain whether the presence of Carpatho Rusyns influences an upward or downward trend in the level of percentage of households with 1 or more vehicles available within an area, or if Carpatho Rusyns simply ended up residing in those areas with higher or lower levels of percentage of households with 1 or more vehicles available due to other factors.
Demographics Similar to Carpatho Rusyns by 1 or more Vehicles in Household
In terms of 1 or more vehicles in household, the demographic groups most similar to Carpatho Rusyns are Shoshone (89.5%, a difference of 0.0%), Immigrants from Poland (89.5%, a difference of 0.010%), Immigrants from Nepal (89.5%, a difference of 0.020%), Immigrants from North Macedonia (89.5%, a difference of 0.020%), and South American (89.5%, a difference of 0.030%).
| Demographics | Rating | Rank | 1 or more Vehicles in Household |
| Ukrainians | 42.4 /100 | #182 | Average 89.6% |
| Ethiopians | 41.2 /100 | #183 | Average 89.6% |
| Immigrants from Bulgaria | 40.7 /100 | #184 | Average 89.6% |
| Immigrants from Brazil | 40.1 /100 | #185 | Average 89.6% |
| Pueblo | 39.9 /100 | #186 | Fair 89.6% |
| South Americans | 39.6 /100 | #187 | Fair 89.5% |
| Immigrants from Nepal | 38.9 /100 | #188 | Fair 89.5% |
| Carpatho Rusyns | 37.8 /100 | #189 | Fair 89.5% |
| Shoshone | 37.5 /100 | #190 | Fair 89.5% |
| Immigrants from Poland | 37.1 /100 | #191 | Fair 89.5% |
| Immigrants from North Macedonia | 36.5 /100 | #192 | Fair 89.5% |
| Immigrants from Northern Europe | 35.5 /100 | #193 | Fair 89.5% |
| Immigrants from Eritrea | 33.2 /100 | #194 | Fair 89.4% |
| Immigrants from Armenia | 31.8 /100 | #195 | Fair 89.4% |
| Crow | 24.3 /100 | #196 | Fair 89.3% |
Carpatho Rusyn 1 or more Vehicles in Household Correlation Summary
| Measurement | Carpatho Rusyn Data | 1 or more Vehicles in Household Data |
| Minimum | 0.0073% | 80.2% |
| Maximum | 37.3% | 100.0% |
| Range | 37.2% | 19.8% |
| Mean | 1.9% | 93.9% |
| Median | 0.73% | 94.1% |
| Interquartile 25% (IQ1) | 0.36% | 92.0% |
| Interquartile 75% (IQ3) | 1.3% | 96.3% |
| Interquartile Range (IQR) | 0.99% | 4.3% |
| Standard Deviation (Sample) | 5.7% | 4.6% |
| Standard Deviation (Population) | 5.7% | 4.5% |
Correlation Details
| Carpatho Rusyn Percentile | Sample Size | 1 or more Vehicles in Household |
[ 0.0% - 0.5% ] 0.0073% | 48,800,227 | 80.2% |
[ 0.0% - 0.5% ] 0.047% | 4,982,615 | 90.3% |
[ 0.0% - 0.5% ] 0.083% | 1,908,544 | 92.0% |
[ 0.0% - 0.5% ] 0.12% | 1,197,439 | 90.6% |
[ 0.0% - 0.5% ] 0.16% | 397,987 | 91.2% |
[ 0.0% - 0.5% ] 0.19% | 325,327 | 93.9% |
[ 0.0% - 0.5% ] 0.22% | 312,934 | 93.6% |
[ 0.0% - 0.5% ] 0.26% | 124,552 | 96.3% |
[ 0.0% - 0.5% ] 0.29% | 231,207 | 91.4% |
[ 0.0% - 0.5% ] 0.33% | 104,929 | 91.5% |
[ 0.0% - 0.5% ] 0.36% | 53,874 | 93.8% |
[ 0.0% - 0.5% ] 0.39% | 54,755 | 95.2% |
[ 0.0% - 0.5% ] 0.43% | 30,200 | 96.0% |
[ 0.0% - 0.5% ] 0.47% | 123,172 | 93.4% |
[ 0.0% - 0.5% ] 0.50% | 28,082 | 95.7% |
[ 0.5% - 1.0% ] 0.54% | 10,950 | 91.2% |
[ 0.5% - 1.0% ] 0.56% | 10,632 | 93.9% |
[ 0.5% - 1.0% ] 0.61% | 61,067 | 96.0% |
[ 0.5% - 1.0% ] 0.63% | 12,042 | 80.4% |
[ 0.5% - 1.0% ] 0.67% | 3,560 | 95.9% |
[ 0.5% - 1.0% ] 0.71% | 8,503 | 93.1% |
[ 0.5% - 1.0% ] 0.75% | 17,748 | 96.1% |
[ 0.5% - 1.0% ] 0.77% | 1,550 | 95.9% |
[ 0.5% - 1.0% ] 0.85% | 3,275 | 93.3% |
[ 0.5% - 1.0% ] 0.88% | 20,914 | 96.0% |
[ 0.5% - 1.0% ] 0.91% | 3,853 | 92.6% |
[ 0.5% - 1.0% ] 0.95% | 5,584 | 97.3% |
[ 0.5% - 1.0% ] 0.97% | 617 | 97.8% |
[ 1.0% - 1.5% ] 1.01% | 7,408 | 93.4% |
[ 1.0% - 1.5% ] 1.23% | 9,985 | 97.1% |
[ 1.0% - 1.5% ] 1.29% | 3,031 | 81.9% |
[ 1.0% - 1.5% ] 1.34% | 7,514 | 92.5% |
[ 1.0% - 1.5% ] 1.36% | 1,841 | 97.5% |
[ 1.5% - 2.0% ] 1.50% | 466 | 98.7% |
[ 1.5% - 2.0% ] 1.53% | 721 | 100.0% |
[ 1.5% - 2.0% ] 1.56% | 831 | 98.4% |
[ 1.5% - 2.0% ] 1.78% | 957 | 95.5% |
[ 2.0% - 2.5% ] 2.15% | 325 | 91.1% |
[ 2.0% - 2.5% ] 2.35% | 85 | 94.3% |
[ 4.5% - 5.0% ] 4.53% | 265 | 100.0% |
[ 6.5% - 7.0% ] 6.93% | 1,918 | 100.0% |
[ 37.0% - 37.5% ] 37.25% | 204 | 100.0% |