Albanian vs Immigrants from Burma/Myanmar 3 or more Vehicles in Household
COMPARE
Albanian
Immigrants from Burma/Myanmar
3 or more Vehicles in Household
3 or more Vehicles in Household Comparison
Albanians
Immigrants from Burma/Myanmar
15.8%
3 OR MORE VEHICLES IN HOUSEHOLD
0.0/ 100
METRIC RATING
311th/ 347
METRIC RANK
18.8%
3 OR MORE VEHICLES IN HOUSEHOLD
13.6/ 100
METRIC RATING
208th/ 347
METRIC RANK
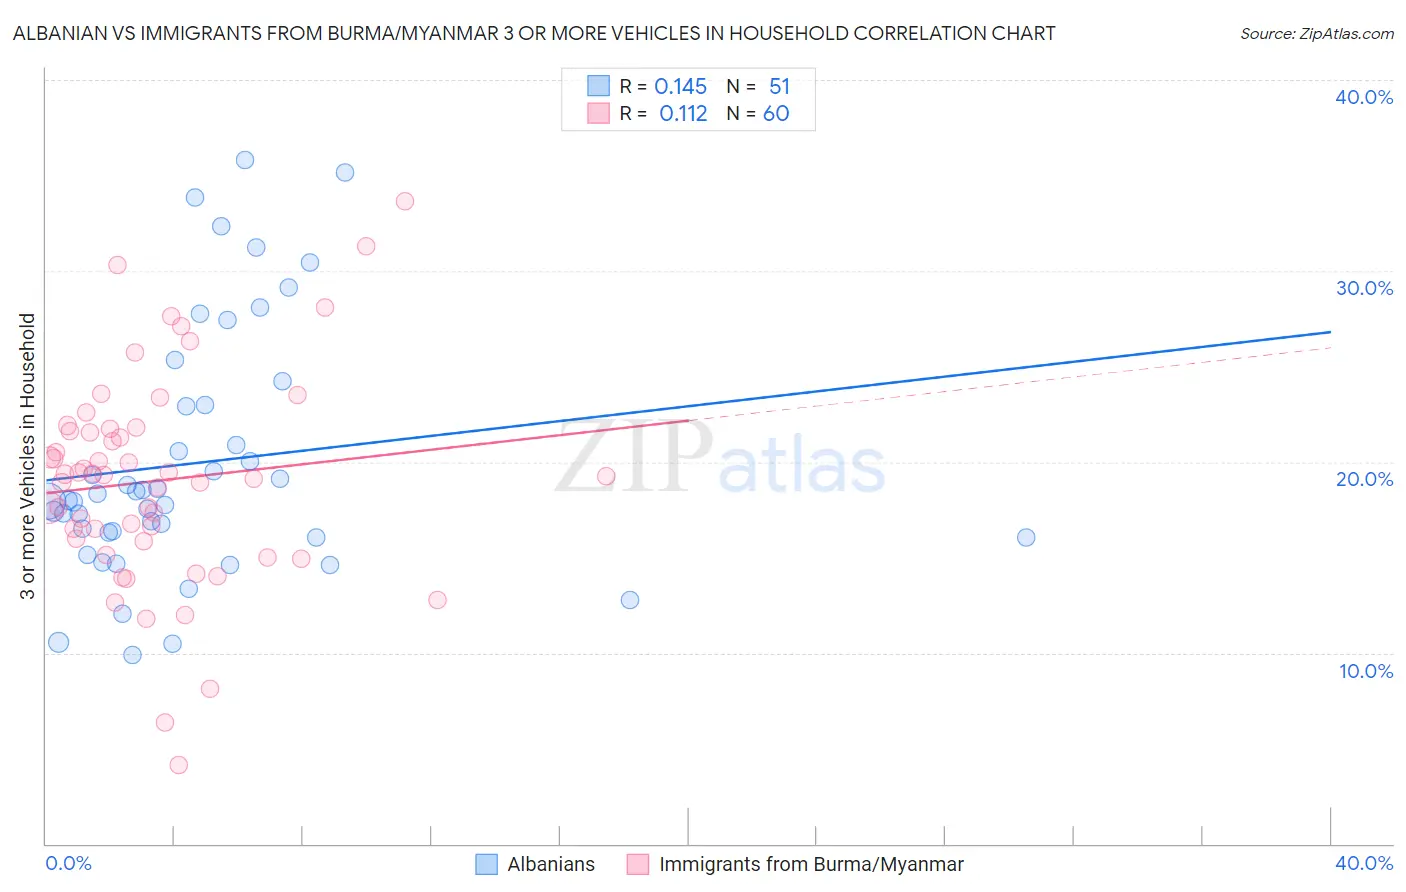
Albanian vs Immigrants from Burma/Myanmar 3 or more Vehicles in Household Correlation Chart
The statistical analysis conducted on geographies consisting of 193,117,321 people shows a poor positive correlation between the proportion of Albanians and percentage of households with 3 or more vehicles available in the United States with a correlation coefficient (R) of 0.145 and weighted average of 15.8%. Similarly, the statistical analysis conducted on geographies consisting of 172,233,426 people shows a poor positive correlation between the proportion of Immigrants from Burma/Myanmar and percentage of households with 3 or more vehicles available in the United States with a correlation coefficient (R) of 0.112 and weighted average of 18.8%, a difference of 19.1%.
3 or more Vehicles in Household Correlation Summary
| Measurement | Albanian | Immigrants from Burma/Myanmar |
| Minimum | 9.9% | 4.1% |
| Maximum | 35.8% | 33.6% |
| Range | 25.9% | 29.5% |
| Mean | 20.0% | 19.0% |
| Median | 18.0% | 19.3% |
| Interquartile 25% (IQ1) | 16.1% | 15.9% |
| Interquartile 75% (IQ3) | 23.0% | 21.7% |
| Interquartile Range (IQR) | 6.9% | 5.8% |
| Standard Deviation (Sample) | 6.5% | 5.6% |
| Standard Deviation (Population) | 6.4% | 5.5% |
Similar Demographics by 3 or more Vehicles in Household
Demographics Similar to Albanians by 3 or more Vehicles in Household
In terms of 3 or more vehicles in household, the demographic groups most similar to Albanians are Moroccan (15.9%, a difference of 0.50%), Immigrants from Somalia (15.9%, a difference of 0.74%), Puerto Rican (15.6%, a difference of 1.1%), Immigrants from Israel (15.6%, a difference of 1.2%), and Houma (16.1%, a difference of 1.7%).
| Demographics | Rating | Rank | 3 or more Vehicles in Household |
| Ghanaians | 0.0 /100 | #304 | Tragic 16.4% |
| Immigrants | Morocco | 0.0 /100 | #305 | Tragic 16.3% |
| Somalis | 0.0 /100 | #306 | Tragic 16.2% |
| Immigrants | Ghana | 0.0 /100 | #307 | Tragic 16.2% |
| Houma | 0.0 /100 | #308 | Tragic 16.1% |
| Immigrants | Somalia | 0.0 /100 | #309 | Tragic 15.9% |
| Moroccans | 0.0 /100 | #310 | Tragic 15.9% |
| Albanians | 0.0 /100 | #311 | Tragic 15.8% |
| Puerto Ricans | 0.0 /100 | #312 | Tragic 15.6% |
| Immigrants | Israel | 0.0 /100 | #313 | Tragic 15.6% |
| Immigrants | Belarus | 0.0 /100 | #314 | Tragic 15.5% |
| Haitians | 0.0 /100 | #315 | Tragic 15.5% |
| U.S. Virgin Islanders | 0.0 /100 | #316 | Tragic 15.4% |
| Jamaicans | 0.0 /100 | #317 | Tragic 15.2% |
| Immigrants | Haiti | 0.0 /100 | #318 | Tragic 15.2% |
Demographics Similar to Immigrants from Burma/Myanmar by 3 or more Vehicles in Household
In terms of 3 or more vehicles in household, the demographic groups most similar to Immigrants from Burma/Myanmar are Immigrants from Chile (18.8%, a difference of 0.010%), Immigrants from Egypt (18.8%, a difference of 0.010%), Immigrants from Eastern Asia (18.8%, a difference of 0.090%), Bulgarian (18.8%, a difference of 0.090%), and Russian (18.8%, a difference of 0.10%).
| Demographics | Rating | Rank | 3 or more Vehicles in Household |
| Arabs | 17.7 /100 | #201 | Poor 18.9% |
| Immigrants | Austria | 15.4 /100 | #202 | Poor 18.9% |
| Tohono O'odham | 14.8 /100 | #203 | Poor 18.9% |
| Immigrants | Romania | 14.6 /100 | #204 | Poor 18.9% |
| Russians | 14.2 /100 | #205 | Poor 18.8% |
| Immigrants | Eastern Asia | 14.1 /100 | #206 | Poor 18.8% |
| Immigrants | Chile | 13.6 /100 | #207 | Poor 18.8% |
| Immigrants | Burma/Myanmar | 13.6 /100 | #208 | Poor 18.8% |
| Immigrants | Egypt | 13.5 /100 | #209 | Poor 18.8% |
| Bulgarians | 13.1 /100 | #210 | Poor 18.8% |
| Immigrants | Kenya | 12.4 /100 | #211 | Poor 18.8% |
| Panamanians | 11.6 /100 | #212 | Poor 18.8% |
| Immigrants | Cuba | 11.6 /100 | #213 | Poor 18.8% |
| Immigrants | Sierra Leone | 10.8 /100 | #214 | Poor 18.7% |
| Eastern Europeans | 10.6 /100 | #215 | Poor 18.7% |