Fort Yates, ND Map & Demographics
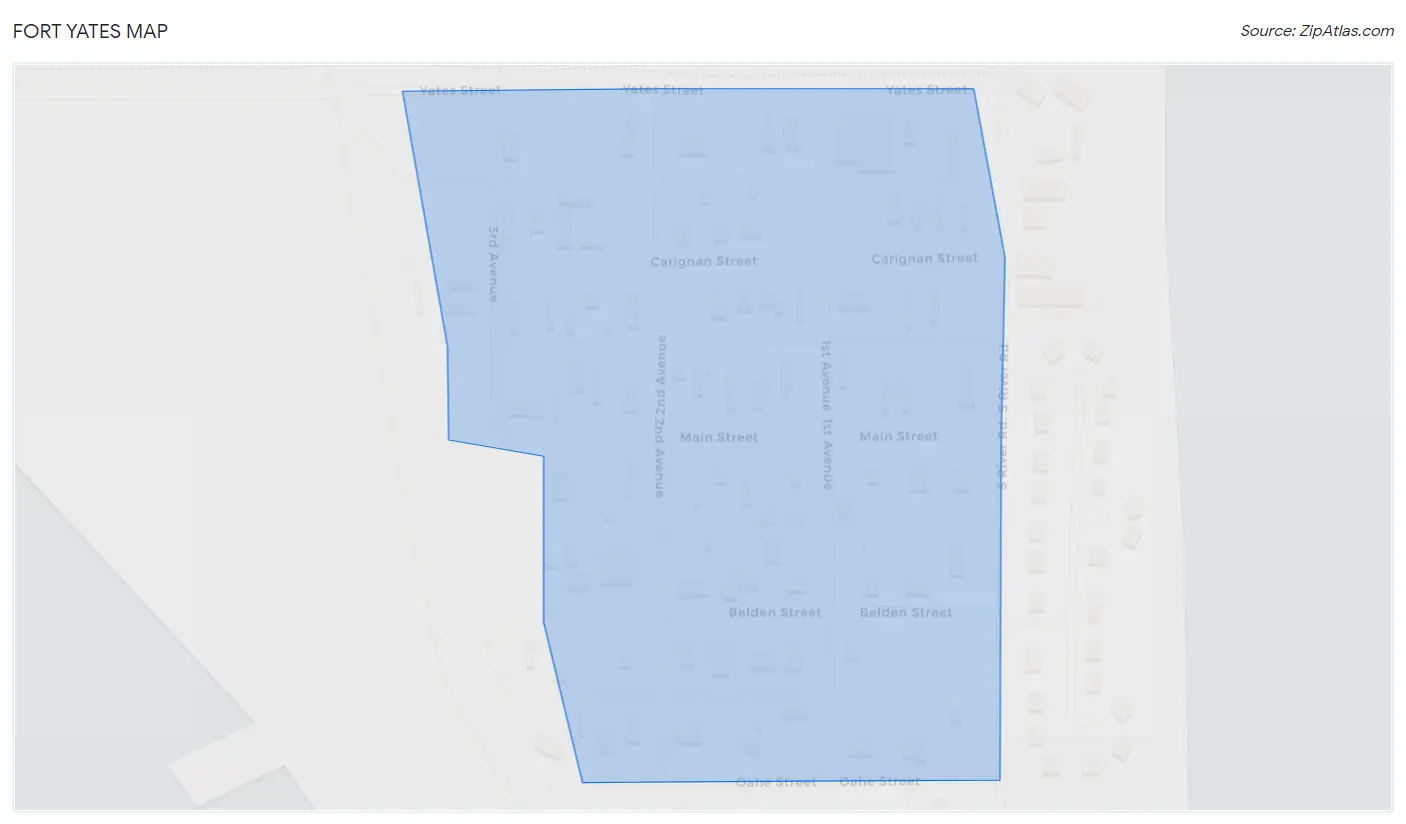
Fort Yates Map
Fort Yates Overview
$23,319
PER CAPITA INCOME
$73,438
AVG FAMILY INCOME
$72,813
AVG HOUSEHOLD INCOME
1.1%
WAGE / INCOME GAP [ % ]
98.9¢/ $1
WAGE / INCOME GAP [ $ ]
0.40
INEQUALITY / GINI INDEX
144
TOTAL POPULATION
88
MALE POPULATION
56
FEMALE POPULATION
157.14
MALES / 100 FEMALES
63.64
FEMALES / 100 MALES
36.5
MEDIAN AGE
3.8
AVG FAMILY SIZE
3.1
AVG HOUSEHOLD SIZE
51
LABOR FORCE [ PEOPLE ]
47.2%
PERCENT IN LABOR FORCE
11.8%
UNEMPLOYMENT RATE
Fort Yates Zip Codes
Fort Yates Area Codes
Income in Fort Yates
Income Overview in Fort Yates
Per Capita Income in Fort Yates is $23,319, while median incomes of families and households are $73,438 and $72,813 respectively.
| Characteristic | Number | Measure |
| Per Capita Income | 144 | $23,319 |
| Median Family Income | 33 | $73,438 |
| Mean Family Income | 33 | $77,097 |
| Median Household Income | 47 | $72,813 |
| Mean Household Income | 47 | $74,260 |
| Income Deficit | 33 | $0 |
| Wage / Income Gap (%) | 144 | 1.12% |
| Wage / Income Gap ($) | 144 | 98.88¢ per $1 |
| Gini / Inequality Index | 144 | 0.40 |
Earnings by Sex in Fort Yates
Average Earnings in Fort Yates are $55,313, $55,000 for men and $55,625 for women, a difference of 1.1%.
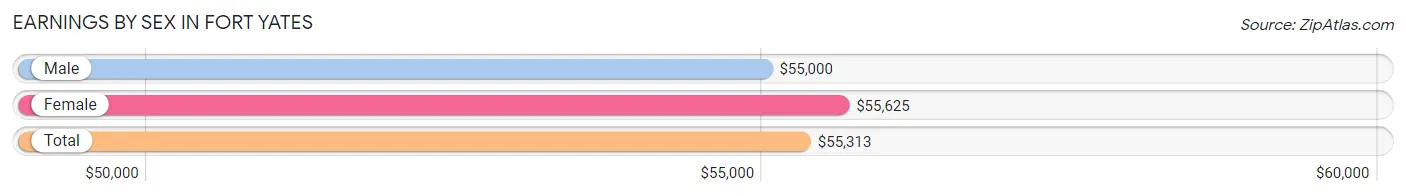
| Sex | Number | Average Earnings |
| Male | 28 (54.9%) | $55,000 |
| Female | 23 (45.1%) | $55,625 |
| Total | 51 (100.0%) | $55,313 |
Earnings by Sex by Income Bracket in Fort Yates
The most common earnings brackets in Fort Yates are $65,000 to $74,999 for men (7 | 25.0%) and $55,000 to $64,999 for women (10 | 43.5%).
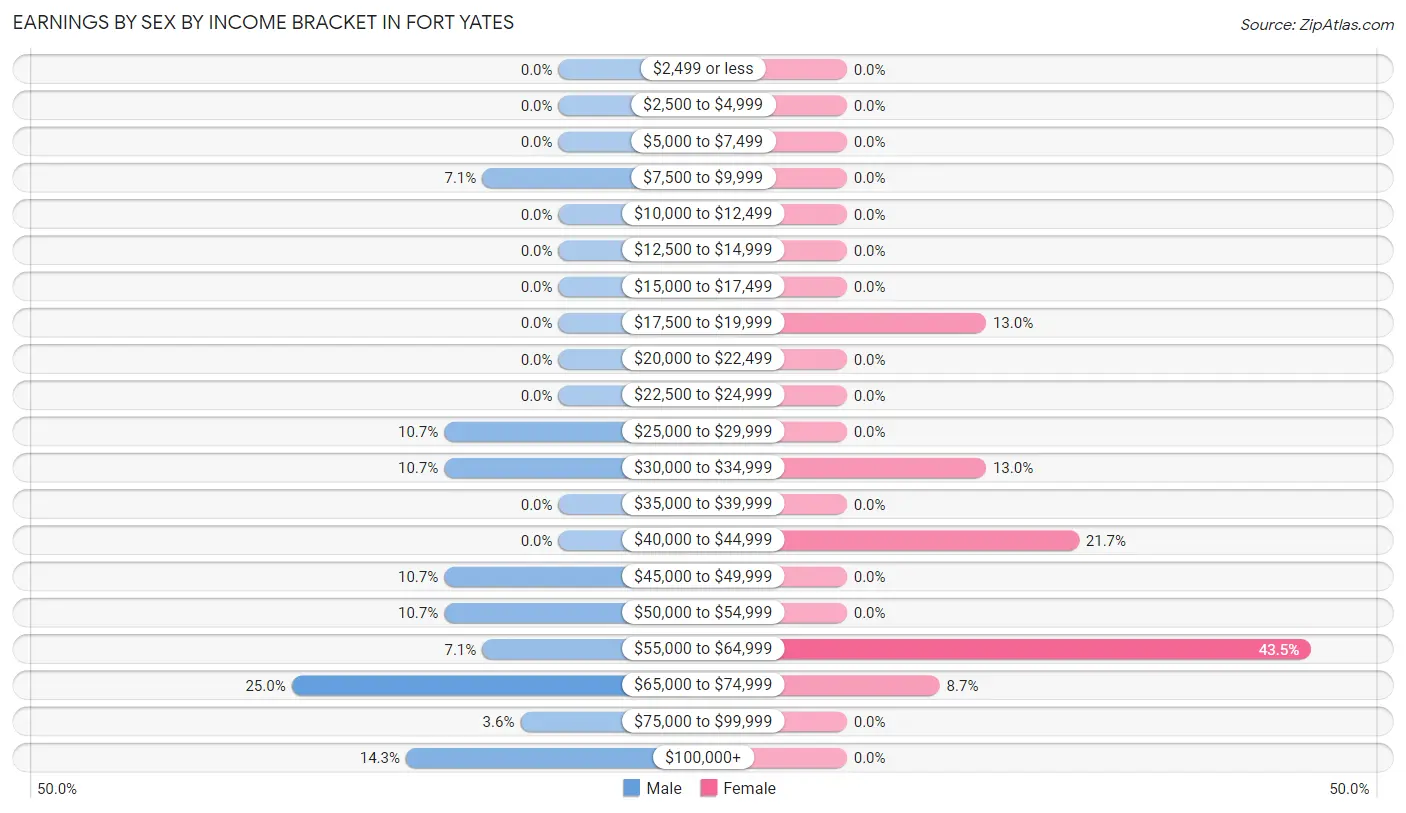
| Income | Male | Female |
| $2,499 or less | 0 (0.0%) | 0 (0.0%) |
| $2,500 to $4,999 | 0 (0.0%) | 0 (0.0%) |
| $5,000 to $7,499 | 0 (0.0%) | 0 (0.0%) |
| $7,500 to $9,999 | 2 (7.1%) | 0 (0.0%) |
| $10,000 to $12,499 | 0 (0.0%) | 0 (0.0%) |
| $12,500 to $14,999 | 0 (0.0%) | 0 (0.0%) |
| $15,000 to $17,499 | 0 (0.0%) | 0 (0.0%) |
| $17,500 to $19,999 | 0 (0.0%) | 3 (13.0%) |
| $20,000 to $22,499 | 0 (0.0%) | 0 (0.0%) |
| $22,500 to $24,999 | 0 (0.0%) | 0 (0.0%) |
| $25,000 to $29,999 | 3 (10.7%) | 0 (0.0%) |
| $30,000 to $34,999 | 3 (10.7%) | 3 (13.0%) |
| $35,000 to $39,999 | 0 (0.0%) | 0 (0.0%) |
| $40,000 to $44,999 | 0 (0.0%) | 5 (21.7%) |
| $45,000 to $49,999 | 3 (10.7%) | 0 (0.0%) |
| $50,000 to $54,999 | 3 (10.7%) | 0 (0.0%) |
| $55,000 to $64,999 | 2 (7.1%) | 10 (43.5%) |
| $65,000 to $74,999 | 7 (25.0%) | 2 (8.7%) |
| $75,000 to $99,999 | 1 (3.6%) | 0 (0.0%) |
| $100,000+ | 4 (14.3%) | 0 (0.0%) |
| Total | 28 (100.0%) | 23 (100.0%) |
Earnings by Sex by Educational Attainment in Fort Yates
Average earnings in Fort Yates are $56,250 for men and $55,625 for women, a difference of 1.1%. Men with an educational attainment of high school diploma enjoy the highest average annual earnings of $55,625, while those with college or associate's degree education earn the least with $52,917. Women with an educational attainment of graduate degree earn the most with the average annual earnings of $61,250, while those with bachelor's degree education have the smallest earnings of $55,625.
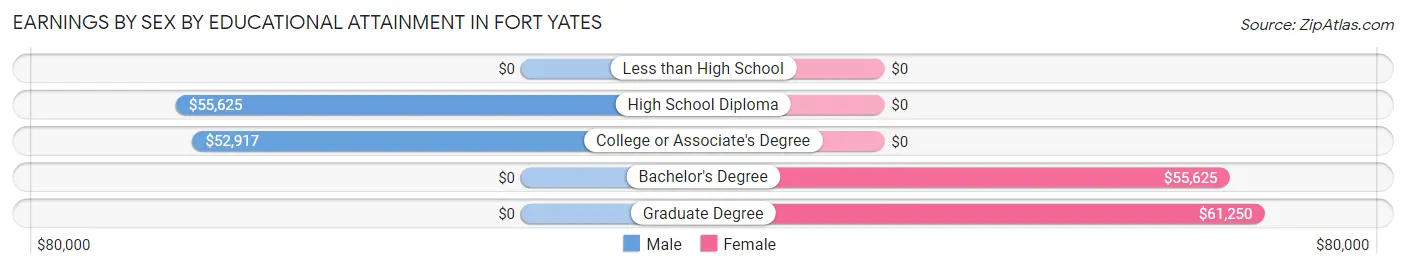
| Educational Attainment | Male Income | Female Income |
| Less than High School | - | - |
| High School Diploma | $55,625 | $0 |
| College or Associate's Degree | $52,917 | $0 |
| Bachelor's Degree | - | - |
| Graduate Degree | - | - |
| Total | $56,250 | $55,625 |
Family Income in Fort Yates
Family Income Brackets in Fort Yates
According to the Fort Yates family income data, there are 11 families falling into the $100,000 to $149,999 income range, which is the most common income bracket and makes up 33.3% of all families.
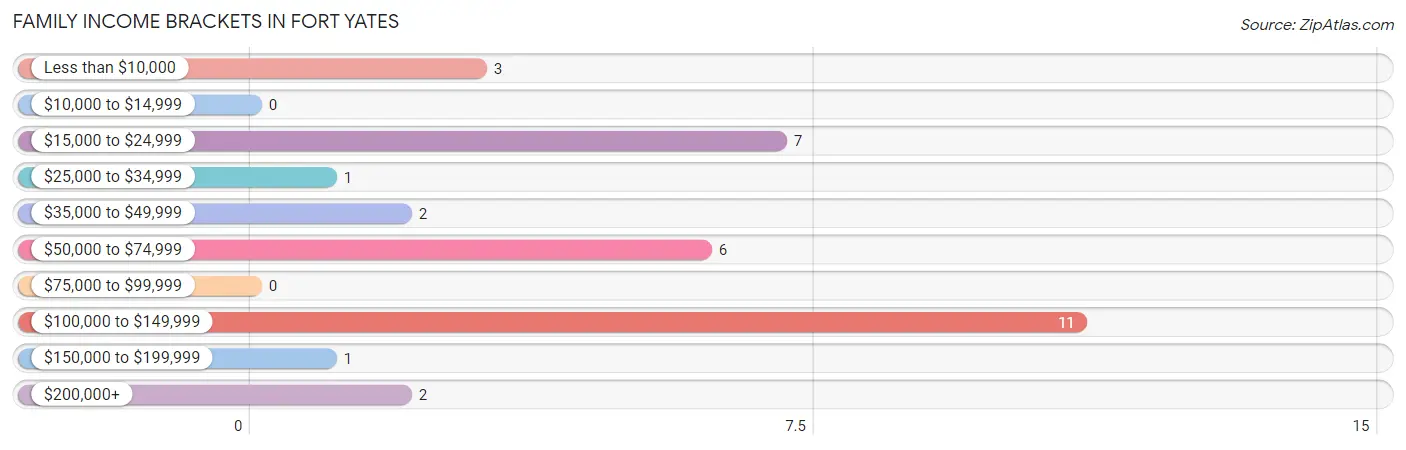
| Income Bracket | # Families | % Families |
| Less than $10,000 | 3 | 9.1% |
| $10,000 to $14,999 | 0 | 0.0% |
| $15,000 to $24,999 | 7 | 21.2% |
| $25,000 to $34,999 | 1 | 3.0% |
| $35,000 to $49,999 | 2 | 6.1% |
| $50,000 to $74,999 | 6 | 18.2% |
| $75,000 to $99,999 | 0 | 0.0% |
| $100,000 to $149,999 | 11 | 33.3% |
| $150,000 to $199,999 | 1 | 3.0% |
| $200,000+ | 2 | 6.1% |
Family Income by Famaliy Size in Fort Yates
2-person families (15 | 45.5%) account for the highest median family income in Fort Yates with $72,813 per family, while 2-person families (15 | 45.5%) have the highest median income of $36,406 per family member.
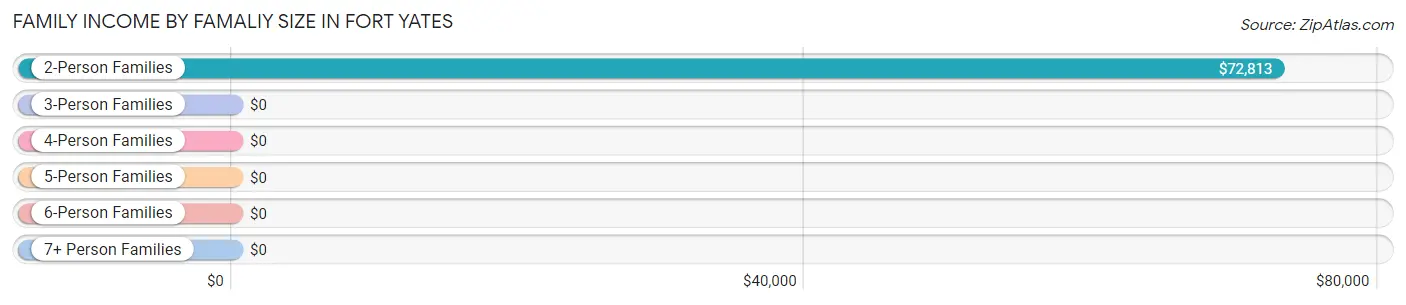
| Income Bracket | # Families | Median Income |
| 2-Person Families | 15 (45.5%) | $72,813 |
| 3-Person Families | 7 (21.2%) | $0 |
| 4-Person Families | 7 (21.2%) | $0 |
| 5-Person Families | 2 (6.1%) | $0 |
| 6-Person Families | 0 (0.0%) | $0 |
| 7+ Person Families | 2 (6.1%) | $0 |
| Total | 33 (100.0%) | $73,438 |
Family Income by Number of Earners in Fort Yates
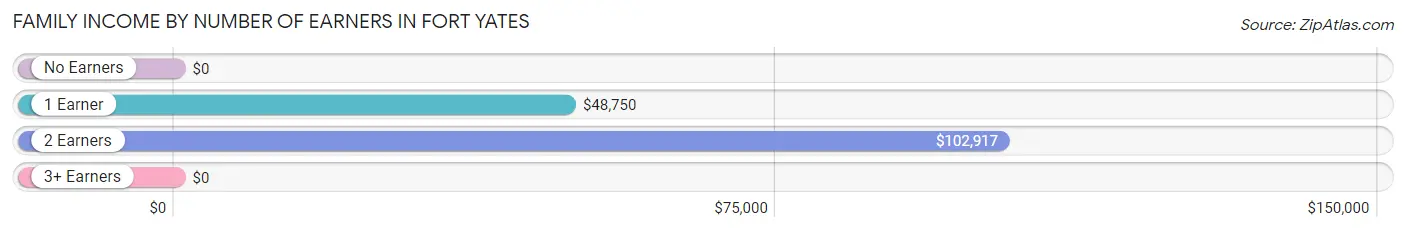
| Number of Earners | # Families | Median Income |
| No Earners | 8 (24.2%) | $0 |
| 1 Earner | 10 (30.3%) | $48,750 |
| 2 Earners | 15 (45.5%) | $102,917 |
| 3+ Earners | 0 (0.0%) | $0 |
| Total | 33 (100.0%) | $73,438 |
Household Income in Fort Yates
Household Income Brackets in Fort Yates
With 14 households falling in the category, the $100,000 to $149,999 income range is the most frequent in Fort Yates, accounting for 29.8% of all households.
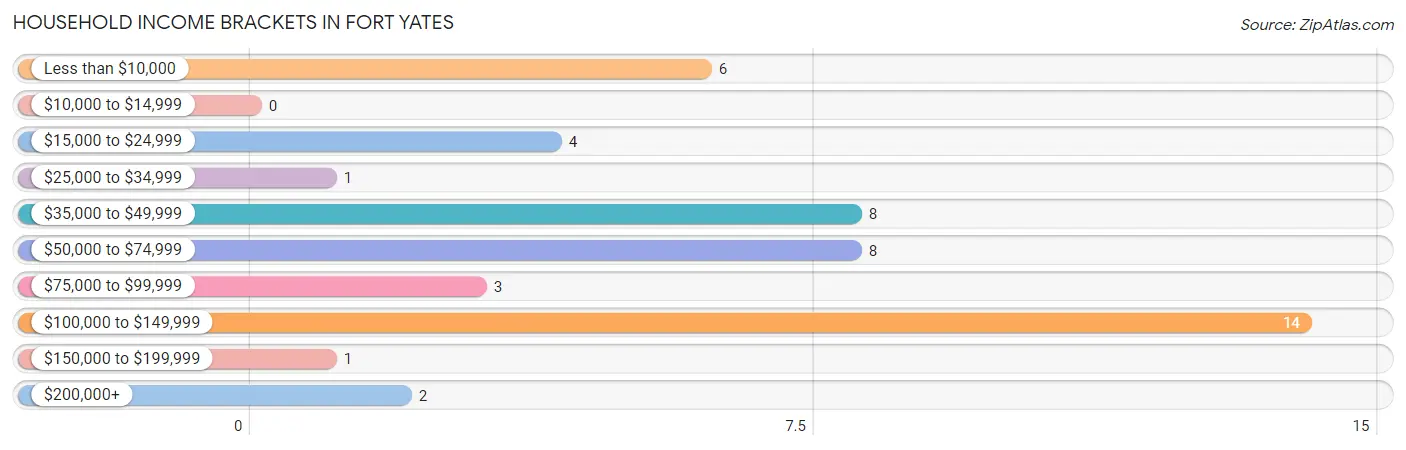
| Income Bracket | # Households | % Households |
| Less than $10,000 | 6 | 12.8% |
| $10,000 to $14,999 | 0 | 0.0% |
| $15,000 to $24,999 | 4 | 8.5% |
| $25,000 to $34,999 | 1 | 2.1% |
| $35,000 to $49,999 | 8 | 17.0% |
| $50,000 to $74,999 | 8 | 17.0% |
| $75,000 to $99,999 | 3 | 6.4% |
| $100,000 to $149,999 | 14 | 29.8% |
| $150,000 to $199,999 | 1 | 2.1% |
| $200,000+ | 2 | 4.3% |
Household Income by Householder Age in Fort Yates
The median household income in Fort Yates is $72,813, with the highest median household income of $76,250 found in the 45 to 64 years age bracket for the primary householder. A total of 31 households (66.0%) fall into this category.
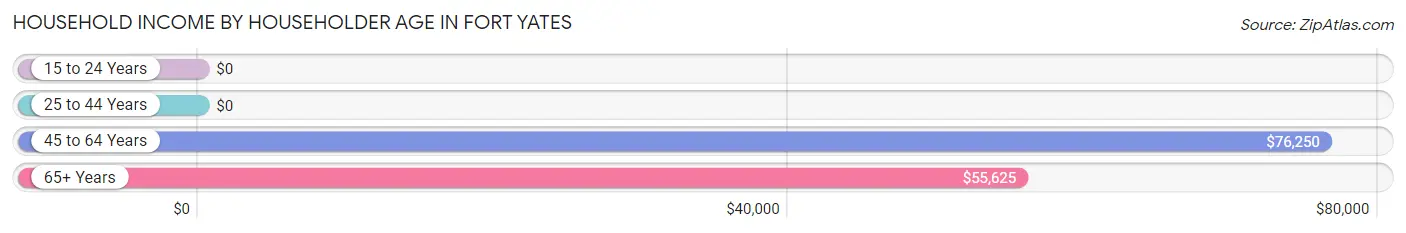
| Income Bracket | # Households | Median Income |
| 15 to 24 Years | 0 (0.0%) | $0 |
| 25 to 44 Years | 8 (17.0%) | $0 |
| 45 to 64 Years | 31 (66.0%) | $76,250 |
| 65+ Years | 8 (17.0%) | $55,625 |
| Total | 47 (100.0%) | $72,813 |
Poverty in Fort Yates
Income Below Poverty by Sex and Age in Fort Yates
With 27.3% poverty level for males and 28.6% for females among the residents of Fort Yates, 5 year old males and under 5 year old females are the most vulnerable to poverty, with 3 males (100.0%) and 3 females (100.0%) in their respective age groups living below the poverty level.
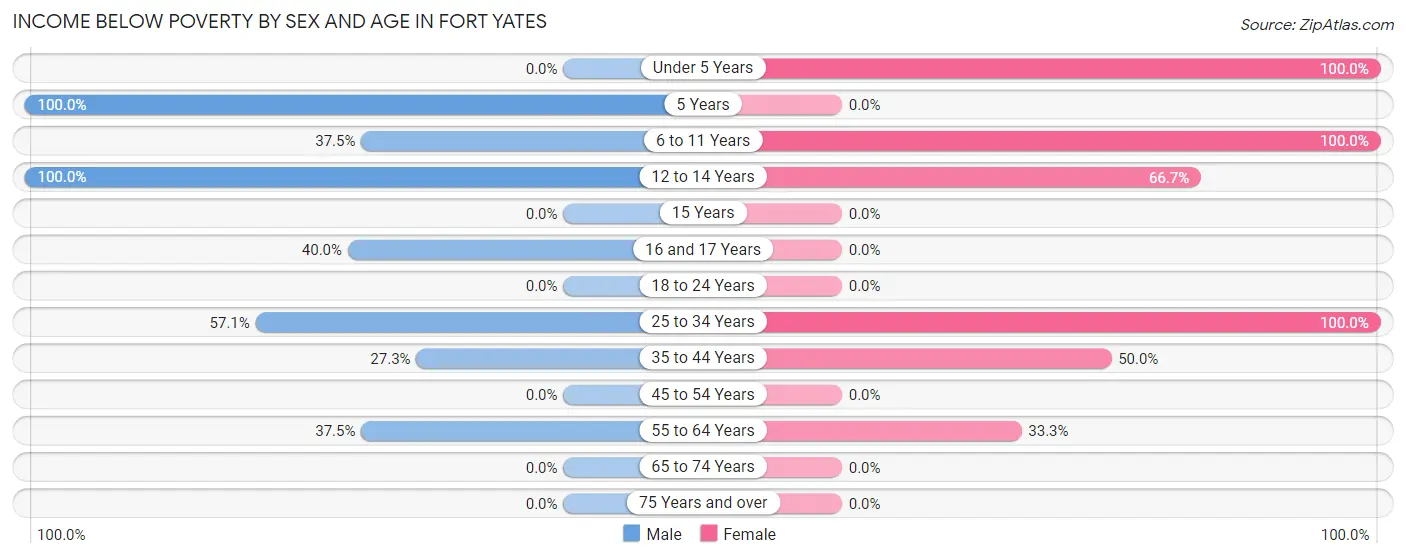
| Age Bracket | Male | Female |
| Under 5 Years | 0 (0.0%) | 3 (100.0%) |
| 5 Years | 3 (100.0%) | 0 (0.0%) |
| 6 to 11 Years | 6 (37.5%) | 2 (100.0%) |
| 12 to 14 Years | 3 (100.0%) | 4 (66.7%) |
| 15 Years | 0 (0.0%) | 0 (0.0%) |
| 16 and 17 Years | 2 (40.0%) | 0 (0.0%) |
| 18 to 24 Years | 0 (0.0%) | 0 (0.0%) |
| 25 to 34 Years | 4 (57.1%) | 3 (100.0%) |
| 35 to 44 Years | 3 (27.3%) | 2 (50.0%) |
| 45 to 54 Years | 0 (0.0%) | 0 (0.0%) |
| 55 to 64 Years | 3 (37.5%) | 2 (33.3%) |
| 65 to 74 Years | 0 (0.0%) | 0 (0.0%) |
| 75 Years and over | 0 (0.0%) | 0 (0.0%) |
| Total | 24 (27.3%) | 16 (28.6%) |
Income Above Poverty by Sex and Age in Fort Yates
According to the poverty statistics in Fort Yates, males aged 15 years and females aged 18 to 24 years are the age groups that are most secure financially, with 100.0% of males and 100.0% of females in these age groups living above the poverty line.
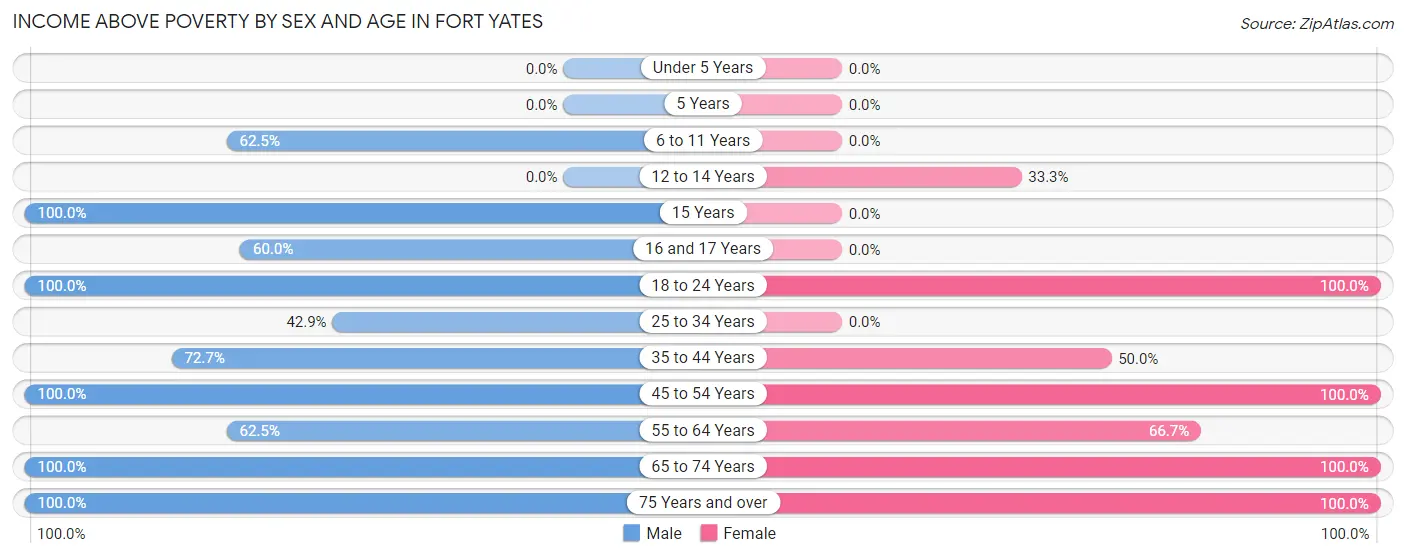
| Age Bracket | Male | Female |
| Under 5 Years | 0 (0.0%) | 0 (0.0%) |
| 5 Years | 0 (0.0%) | 0 (0.0%) |
| 6 to 11 Years | 10 (62.5%) | 0 (0.0%) |
| 12 to 14 Years | 0 (0.0%) | 2 (33.3%) |
| 15 Years | 3 (100.0%) | 0 (0.0%) |
| 16 and 17 Years | 3 (60.0%) | 0 (0.0%) |
| 18 to 24 Years | 7 (100.0%) | 12 (100.0%) |
| 25 to 34 Years | 3 (42.9%) | 0 (0.0%) |
| 35 to 44 Years | 8 (72.7%) | 2 (50.0%) |
| 45 to 54 Years | 21 (100.0%) | 14 (100.0%) |
| 55 to 64 Years | 5 (62.5%) | 4 (66.7%) |
| 65 to 74 Years | 3 (100.0%) | 4 (100.0%) |
| 75 Years and over | 1 (100.0%) | 2 (100.0%) |
| Total | 64 (72.7%) | 40 (71.4%) |
Income Below Poverty Among Married-Couple Families in Fort Yates
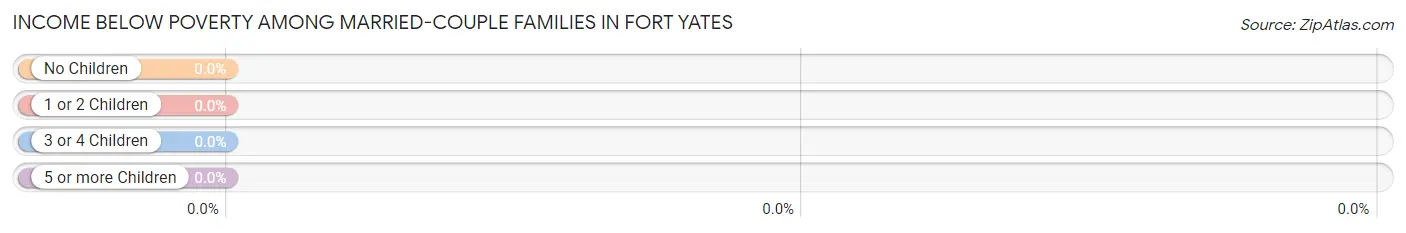
| Children | Above Poverty | Below Poverty |
| No Children | 6 (100.0%) | 0 (0.0%) |
| 1 or 2 Children | 4 (100.0%) | 0 (0.0%) |
| 3 or 4 Children | 0 (0.0%) | 0 (0.0%) |
| 5 or more Children | 0 (0.0%) | 0 (0.0%) |
| Total | 10 (100.0%) | 0 (0.0%) |
Income Below Poverty Among Single-Parent Households in Fort Yates
According to the poverty data in Fort Yates, 42.9% or 3 single-father households and 18.8% or 3 single-mother households are living below the poverty line. Among single-father households, those with 3 or 4 children have the highest poverty rate, with 3 households (50.0%) experiencing poverty. Likewise, among single-mother households, those with 3 or 4 children have the highest poverty rate, with 3 households (100.0%) falling below the poverty line.
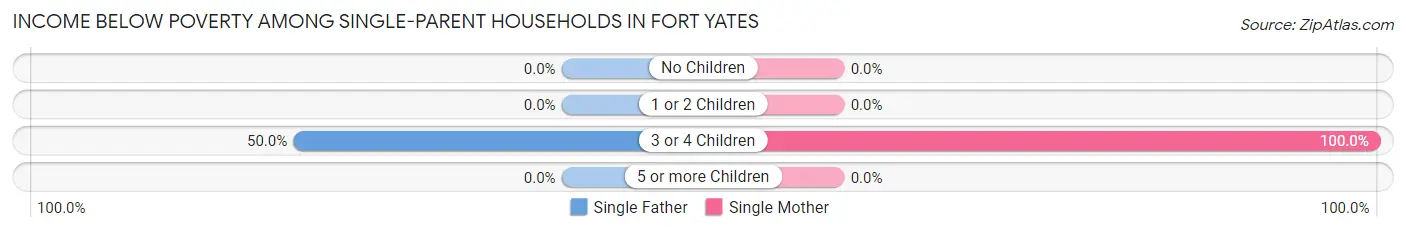
| Children | Single Father | Single Mother |
| No Children | 0 (0.0%) | 0 (0.0%) |
| 1 or 2 Children | 0 (0.0%) | 0 (0.0%) |
| 3 or 4 Children | 3 (50.0%) | 3 (100.0%) |
| 5 or more Children | 0 (0.0%) | 0 (0.0%) |
| Total | 3 (42.9%) | 3 (18.8%) |
Income Below Poverty Among Married-Couple vs Single-Parent Households in Fort Yates
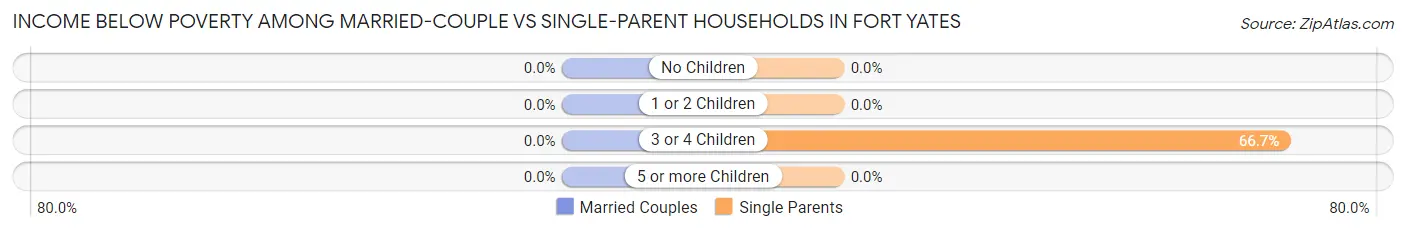
| Children | Married-Couple Families | Single-Parent Households |
| No Children | 0 (0.0%) | 0 (0.0%) |
| 1 or 2 Children | 0 (0.0%) | 0 (0.0%) |
| 3 or 4 Children | 0 (0.0%) | 6 (66.7%) |
| 5 or more Children | 0 (0.0%) | 0 (0.0%) |
| Total | 0 (0.0%) | 6 (26.1%) |
Race in Fort Yates
The most populous races in Fort Yates are Native / Alaskan (129 | 89.6%), Two or more Races (8 | 5.6%), and White / Caucasian (7 | 4.9%).
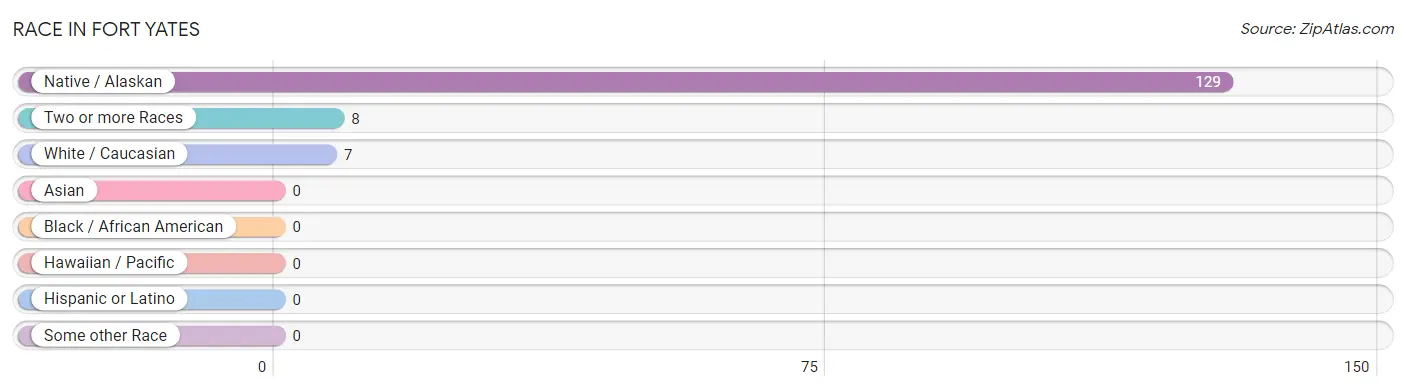
| Race | # Population | % Population |
| Asian | 0 | 0.0% |
| Black / African American | 0 | 0.0% |
| Hawaiian / Pacific | 0 | 0.0% |
| Hispanic or Latino | 0 | 0.0% |
| Native / Alaskan | 129 | 89.6% |
| White / Caucasian | 7 | 4.9% |
| Two or more Races | 8 | 5.6% |
| Some other Race | 0 | 0.0% |
| Total | 144 | 100.0% |
Ancestry in Fort Yates
The most populous ancestries reported in Fort Yates are Sioux (120 | 83.3%), French (8 | 5.6%), Irish (8 | 5.6%), German (2 | 1.4%), and German Russian (2 | 1.4%), together accounting for 97.2% of all Fort Yates residents.
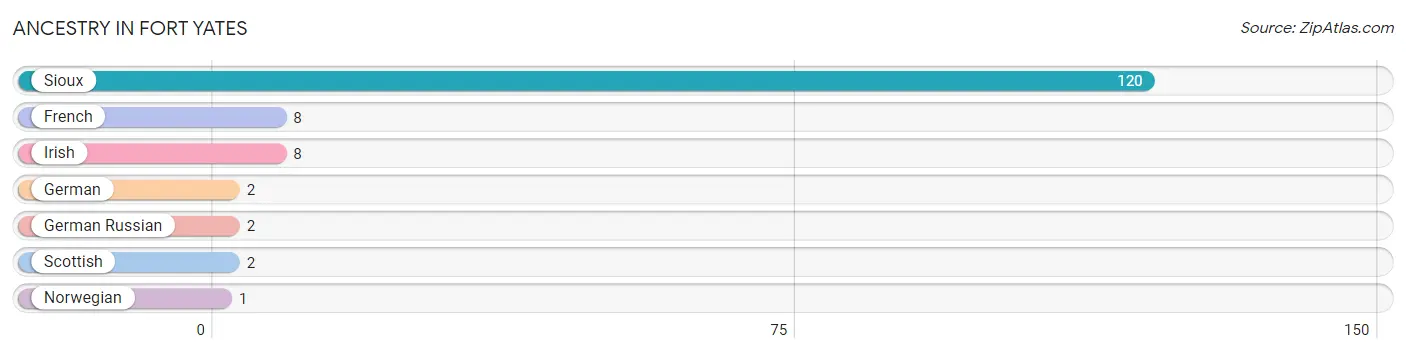
| Ancestry | # Population | % Population |
| French | 8 | 5.6% |
| German | 2 | 1.4% |
| German Russian | 2 | 1.4% |
| Irish | 8 | 5.6% |
| Norwegian | 1 | 0.7% |
| Scottish | 2 | 1.4% |
| Sioux | 120 | 83.3% | View All 7 Rows |
Immigrants in Fort Yates

| Immigration Origin | # Population | % Population | View All 0 Rows |
Sex and Age in Fort Yates
Sex and Age in Fort Yates
The most populous age groups in Fort Yates are 10 to 14 Years (12 | 13.6%) for men and 20 to 24 Years (12 | 21.4%) for women.
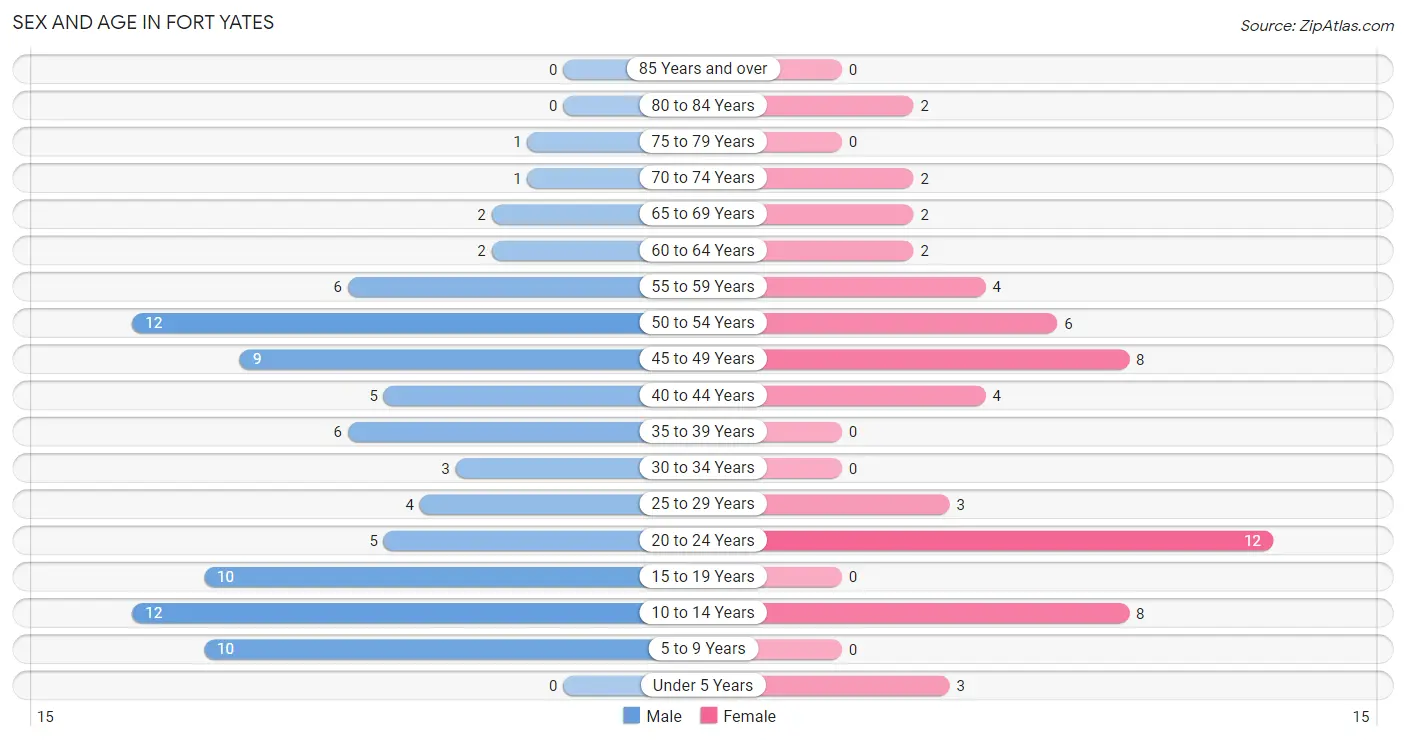
| Age Bracket | Male | Female |
| Under 5 Years | 0 (0.0%) | 3 (5.4%) |
| 5 to 9 Years | 10 (11.4%) | 0 (0.0%) |
| 10 to 14 Years | 12 (13.6%) | 8 (14.3%) |
| 15 to 19 Years | 10 (11.4%) | 0 (0.0%) |
| 20 to 24 Years | 5 (5.7%) | 12 (21.4%) |
| 25 to 29 Years | 4 (4.5%) | 3 (5.4%) |
| 30 to 34 Years | 3 (3.4%) | 0 (0.0%) |
| 35 to 39 Years | 6 (6.8%) | 0 (0.0%) |
| 40 to 44 Years | 5 (5.7%) | 4 (7.1%) |
| 45 to 49 Years | 9 (10.2%) | 8 (14.3%) |
| 50 to 54 Years | 12 (13.6%) | 6 (10.7%) |
| 55 to 59 Years | 6 (6.8%) | 4 (7.1%) |
| 60 to 64 Years | 2 (2.3%) | 2 (3.6%) |
| 65 to 69 Years | 2 (2.3%) | 2 (3.6%) |
| 70 to 74 Years | 1 (1.1%) | 2 (3.6%) |
| 75 to 79 Years | 1 (1.1%) | 0 (0.0%) |
| 80 to 84 Years | 0 (0.0%) | 2 (3.6%) |
| 85 Years and over | 0 (0.0%) | 0 (0.0%) |
| Total | 88 (100.0%) | 56 (100.0%) |
Families and Households in Fort Yates
Median Family Size in Fort Yates
The median family size in Fort Yates is 3.79 persons per family, with single male/father families (7 | 21.2%) accounting for the largest median family size of 6.71 persons per family. On the other hand, single female/mother families (16 | 48.5%) represent the smallest median family size with 2.25 persons per family.
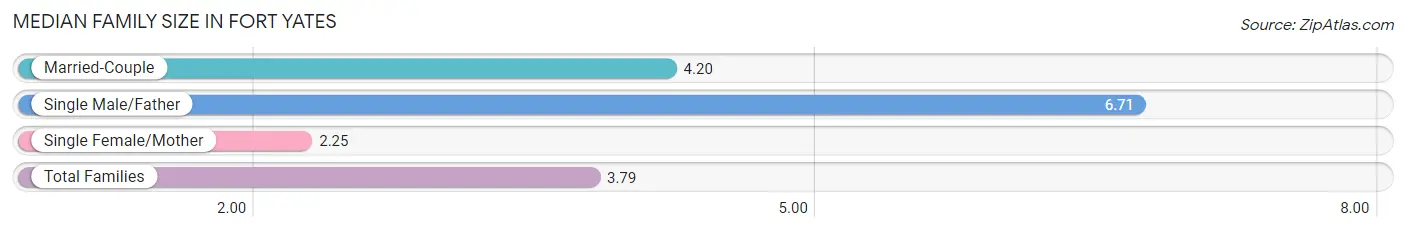
| Family Type | # Families | Family Size |
| Married-Couple | 10 (30.3%) | 4.20 |
| Single Male/Father | 7 (21.2%) | 6.71 |
| Single Female/Mother | 16 (48.5%) | 2.25 |
| Total Families | 33 (100.0%) | 3.79 |
Median Household Size in Fort Yates
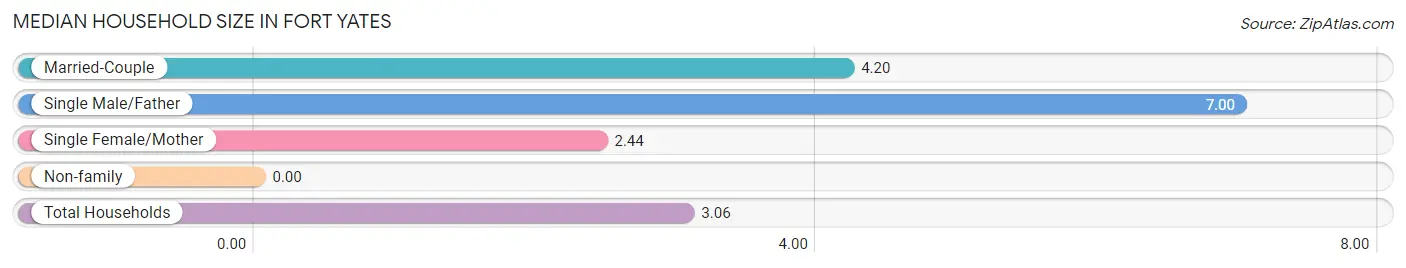
| Household Type | # Households | Household Size |
| Married-Couple | 10 (21.3%) | 4.20 |
| Single Male/Father | 7 (14.9%) | 7.00 |
| Single Female/Mother | 16 (34.0%) | 2.44 |
| Non-family | 14 (29.8%) | - |
| Total Households | 47 (100.0%) | 3.06 |
Household Size by Marriage Status in Fort Yates
Out of a total of 47 households in Fort Yates, 33 (70.2%) are family households, while 14 (29.8%) are nonfamily households. The most numerous type of family households are 2-person households, comprising 14, and the most common type of nonfamily households are 1-person households, comprising 14.
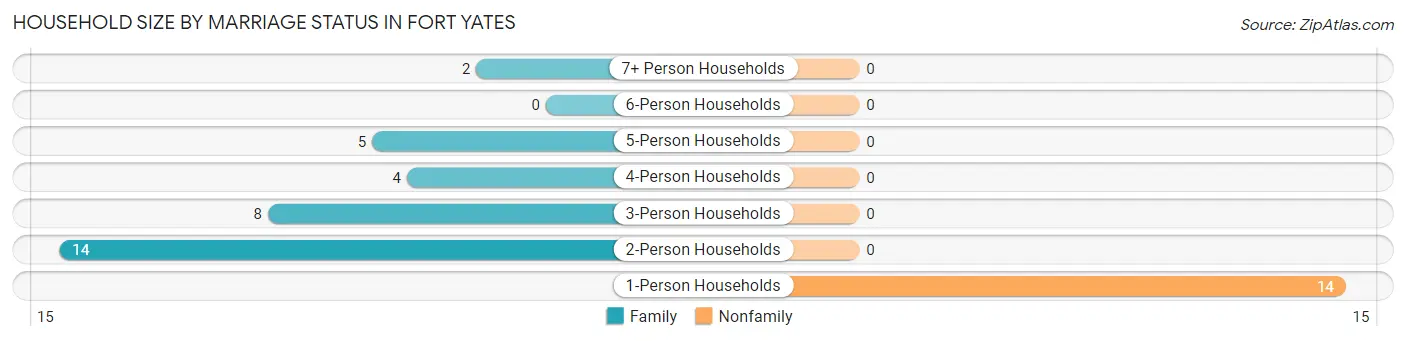
| Household Size | Family Households | Nonfamily Households |
| 1-Person Households | - | 14 (29.8%) |
| 2-Person Households | 14 (29.8%) | 0 (0.0%) |
| 3-Person Households | 8 (17.0%) | 0 (0.0%) |
| 4-Person Households | 4 (8.5%) | 0 (0.0%) |
| 5-Person Households | 5 (10.6%) | 0 (0.0%) |
| 6-Person Households | 0 (0.0%) | 0 (0.0%) |
| 7+ Person Households | 2 (4.3%) | 0 (0.0%) |
| Total | 33 (70.2%) | 14 (29.8%) |
Female Fertility in Fort Yates
Fertility by Age in Fort Yates
| Age Bracket | Women with Births | Births / 1,000 Women |
| 15 to 19 years | 0 (0.0%) | 0.0 |
| 20 to 34 years | 0 (0.0%) | 0.0 |
| 35 to 50 years | 0 (0.0%) | 0.0 |
| Total | 0 (0.0%) | 0.0 |
Fertility by Age by Marriage Status in Fort Yates
| Age Bracket | Married | Unmarried |
| 15 to 19 years | 0 (0.0%) | 0 (0.0%) |
| 20 to 34 years | 0 (0.0%) | 0 (0.0%) |
| 35 to 50 years | 0 (0.0%) | 0 (0.0%) |
| Total | 0 (0.0%) | 0 (0.0%) |
Fertility by Education in Fort Yates
| Educational Attainment | Women with Births | Births / 1,000 Women |
| Less than High School | 0 (0.0%) | 0.0 |
| High School Diploma | 0 (0.0%) | 0.0 |
| College or Associate's Degree | 0 (0.0%) | 0.0 |
| Bachelor's Degree | 0 (0.0%) | 0.0 |
| Graduate Degree | 0 (0.0%) | 0.0 |
| Total | 0 (0.0%) | 0.0 |
Fertility by Education by Marriage Status in Fort Yates
| Educational Attainment | Married | Unmarried |
| Less than High School | 0 (0.0%) | 0 (0.0%) |
| High School Diploma | 0 (0.0%) | 0 (0.0%) |
| College or Associate's Degree | 0 (0.0%) | 0 (0.0%) |
| Bachelor's Degree | 0 (0.0%) | 0 (0.0%) |
| Graduate Degree | 0 (0.0%) | 0 (0.0%) |
| Total | 0 (0.0%) | 0 (0.0%) |
Employment Characteristics in Fort Yates
Employment by Class of Employer in Fort Yates
Among the 45 employed individuals in Fort Yates, local government employees (28 | 62.2%), private company employees (11 | 24.4%), and federal government employees (5 | 11.1%) make up the most common classes of employment.
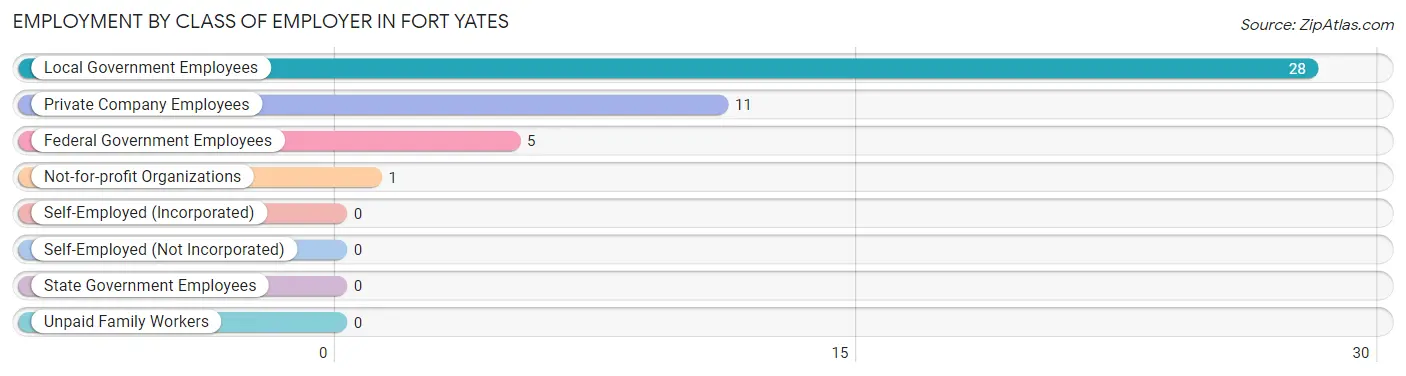
| Employer Class | # Employees | % Employees |
| Private Company Employees | 11 | 24.4% |
| Self-Employed (Incorporated) | 0 | 0.0% |
| Self-Employed (Not Incorporated) | 0 | 0.0% |
| Not-for-profit Organizations | 1 | 2.2% |
| Local Government Employees | 28 | 62.2% |
| State Government Employees | 0 | 0.0% |
| Federal Government Employees | 5 | 11.1% |
| Unpaid Family Workers | 0 | 0.0% |
| Total | 45 | 100.0% |
Employment Status by Age in Fort Yates
According to the labor force statistics for Fort Yates, out of the total population over 16 years of age (108), 47.2% or 51 individuals are in the labor force, with 11.8% or 6 of them unemployed. The age group with the highest labor force participation rate is 30 to 34 years, with 100.0% or 3 individuals in the labor force. Within the labor force, the 35 to 44 years age range has the highest percentage of unemployed individuals, with 60.0% or 6 of them being unemployed.
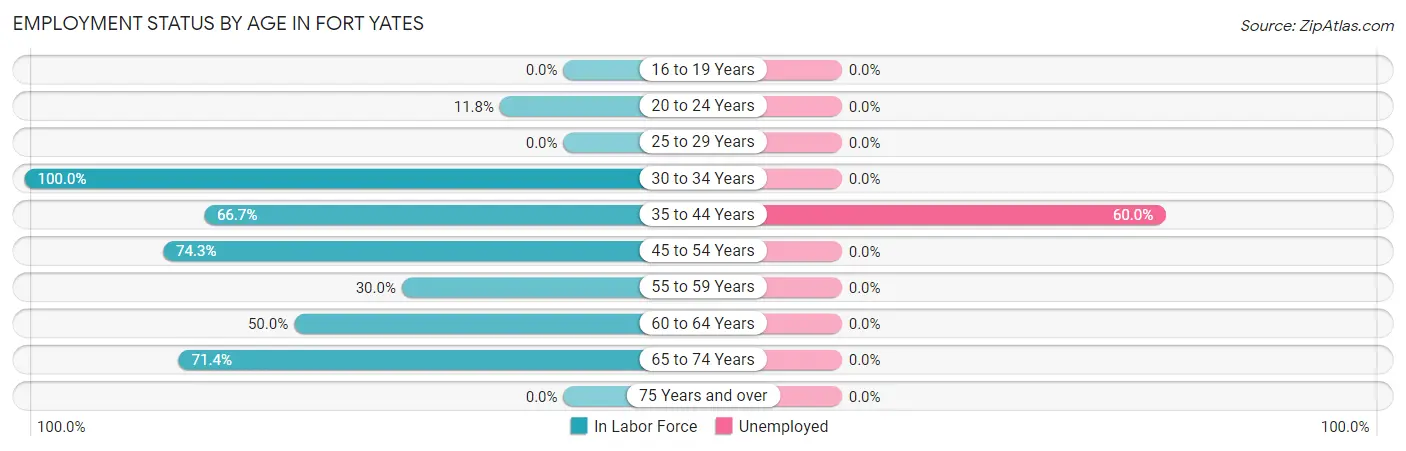
| Age Bracket | In Labor Force | Unemployed |
| 16 to 19 Years | 0 (0.0%) | 0 (0.0%) |
| 20 to 24 Years | 2 (11.8%) | 0 (0.0%) |
| 25 to 29 Years | 0 (0.0%) | 0 (0.0%) |
| 30 to 34 Years | 3 (100.0%) | 0 (0.0%) |
| 35 to 44 Years | 10 (66.7%) | 6 (60.0%) |
| 45 to 54 Years | 26 (74.3%) | 0 (0.0%) |
| 55 to 59 Years | 3 (30.0%) | 0 (0.0%) |
| 60 to 64 Years | 2 (50.0%) | 0 (0.0%) |
| 65 to 74 Years | 5 (71.4%) | 0 (0.0%) |
| 75 Years and over | 0 (0.0%) | 0 (0.0%) |
| Total | 51 (47.2%) | 6 (11.8%) |
Employment Status by Educational Attainment in Fort Yates
According to labor force statistics for Fort Yates, 59.5% of individuals (44) out of the total population between 25 and 64 years of age (74) are in the labor force, with 13.6% or 6 of them being unemployed. The group with the highest labor force participation rate are those with the educational attainment of bachelor's degree or higher, with 100.0% or 18 individuals in the labor force. Within the labor force, individuals with high school diploma education have the highest percentage of unemployment, with 27.3% or 3 of them being unemployed.
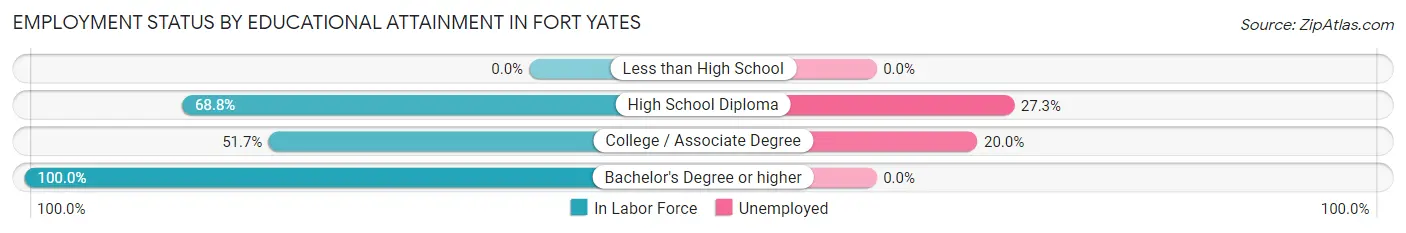
| Educational Attainment | In Labor Force | Unemployed |
| Less than High School | 0 (0.0%) | 0 (0.0%) |
| High School Diploma | 11 (68.8%) | 4 (27.3%) |
| College / Associate Degree | 15 (51.7%) | 6 (20.0%) |
| Bachelor's Degree or higher | 18 (100.0%) | 0 (0.0%) |
| Total | 44 (59.5%) | 10 (13.6%) |
Employment Occupations by Sex in Fort Yates
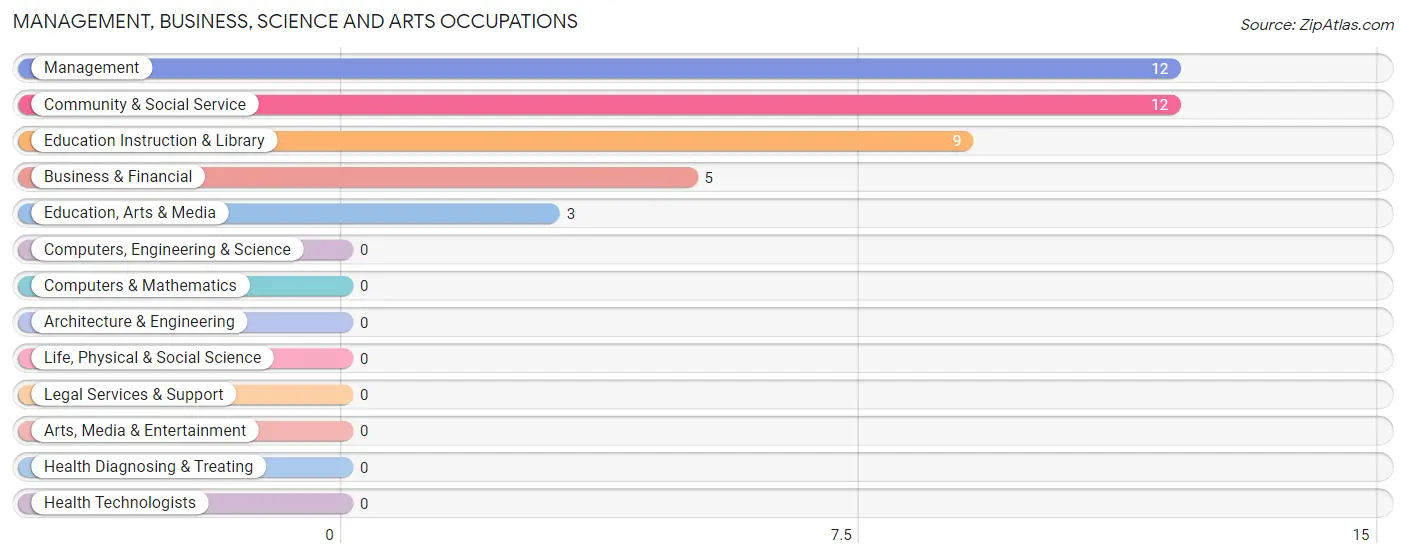
Management, Business, Science and Arts Occupations
The most common Management, Business, Science and Arts occupations in Fort Yates are Management (12 | 26.7%), Community & Social Service (12 | 26.7%), Education Instruction & Library (9 | 20.0%), Business & Financial (5 | 11.1%), and Education, Arts & Media (3 | 6.7%).
Management, Business, Science and Arts Occupations by Sex
Within the Management, Business, Science and Arts occupations in Fort Yates, the most male-oriented occupations are Business & Financial (100.0%), Management (58.3%), and Education Instruction & Library (11.1%), while the most female-oriented occupations are Education, Arts & Media (100.0%), Community & Social Service (91.7%), and Education Instruction & Library (88.9%).
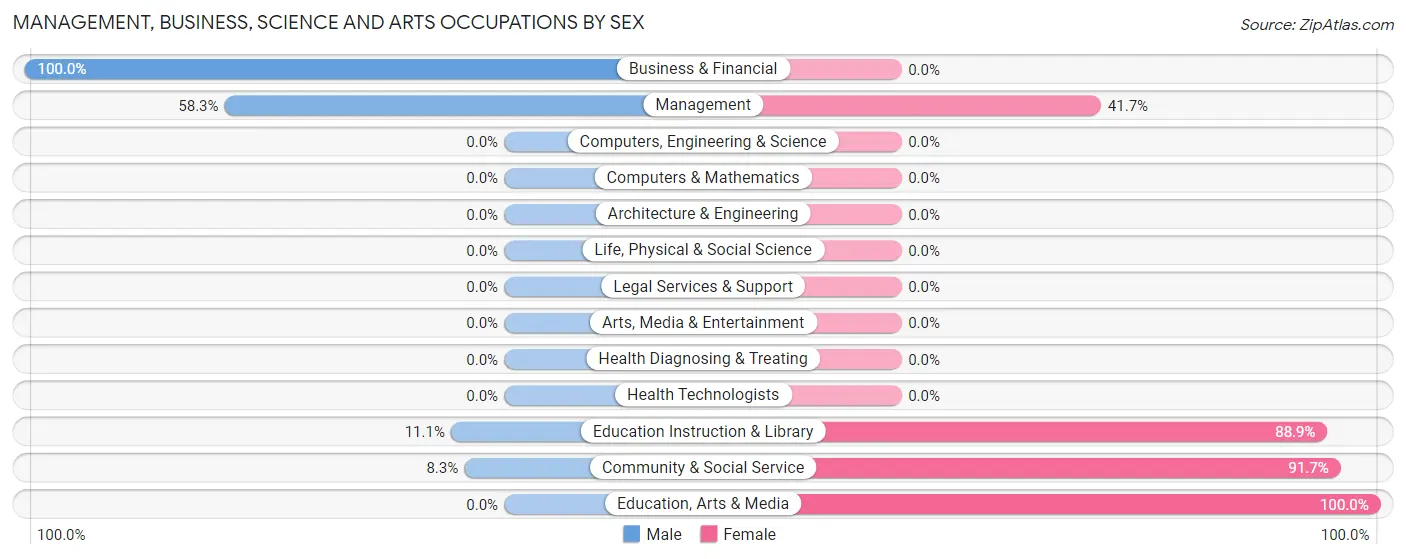
| Occupation | Male | Female |
| Management | 7 (58.3%) | 5 (41.7%) |
| Business & Financial | 5 (100.0%) | 0 (0.0%) |
| Computers, Engineering & Science | 0 (0.0%) | 0 (0.0%) |
| Computers & Mathematics | 0 (0.0%) | 0 (0.0%) |
| Architecture & Engineering | 0 (0.0%) | 0 (0.0%) |
| Life, Physical & Social Science | 0 (0.0%) | 0 (0.0%) |
| Community & Social Service | 1 (8.3%) | 11 (91.7%) |
| Education, Arts & Media | 0 (0.0%) | 3 (100.0%) |
| Legal Services & Support | 0 (0.0%) | 0 (0.0%) |
| Education Instruction & Library | 1 (11.1%) | 8 (88.9%) |
| Arts, Media & Entertainment | 0 (0.0%) | 0 (0.0%) |
| Health Diagnosing & Treating | 0 (0.0%) | 0 (0.0%) |
| Health Technologists | 0 (0.0%) | 0 (0.0%) |
| Total (Category) | 13 (44.8%) | 16 (55.2%) |
| Total (Overall) | 25 (55.6%) | 20 (44.4%) |
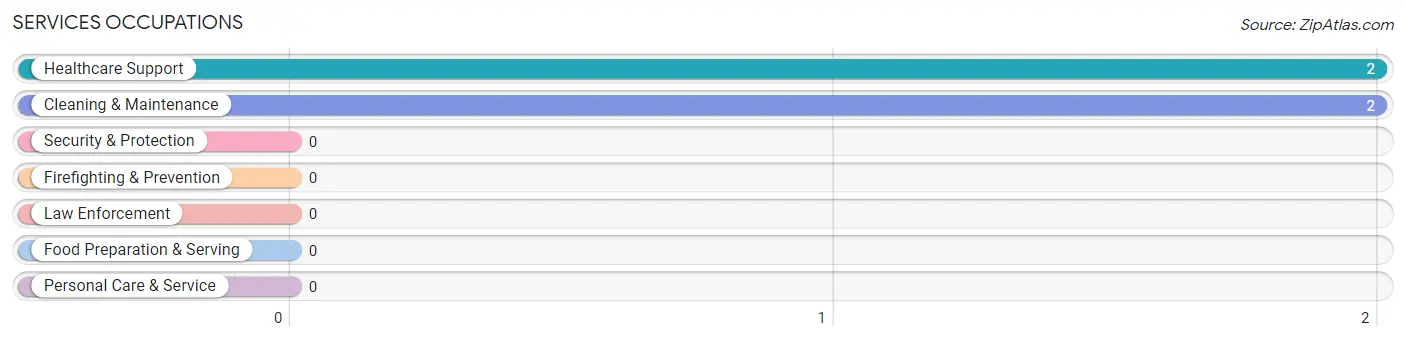
Services Occupations
The most common Services occupations in Fort Yates are Healthcare Support (2 | 4.4%), and Cleaning & Maintenance (2 | 4.4%).
Services Occupations by Sex
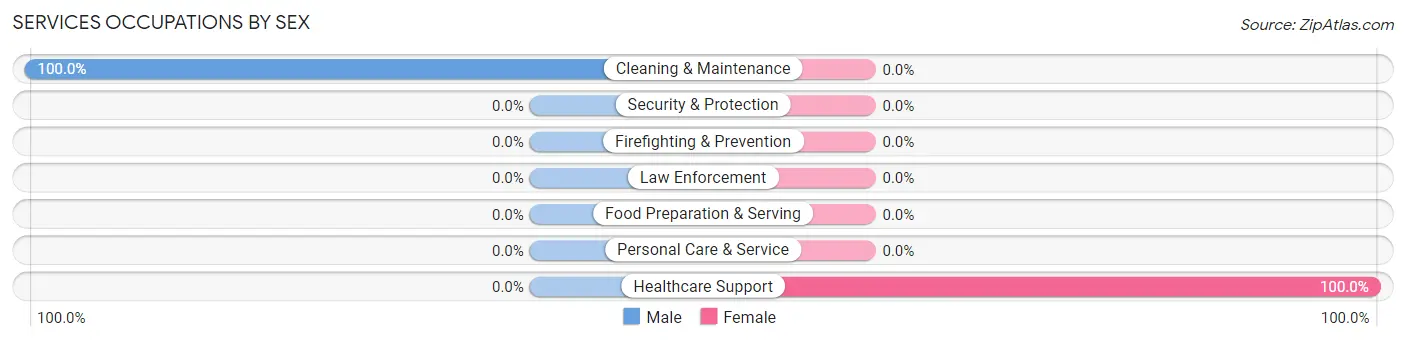
| Occupation | Male | Female |
| Healthcare Support | 0 (0.0%) | 2 (100.0%) |
| Security & Protection | 0 (0.0%) | 0 (0.0%) |
| Firefighting & Prevention | 0 (0.0%) | 0 (0.0%) |
| Law Enforcement | 0 (0.0%) | 0 (0.0%) |
| Food Preparation & Serving | 0 (0.0%) | 0 (0.0%) |
| Cleaning & Maintenance | 2 (100.0%) | 0 (0.0%) |
| Personal Care & Service | 0 (0.0%) | 0 (0.0%) |
| Total (Category) | 2 (50.0%) | 2 (50.0%) |
| Total (Overall) | 25 (55.6%) | 20 (44.4%) |
Sales and Office Occupations
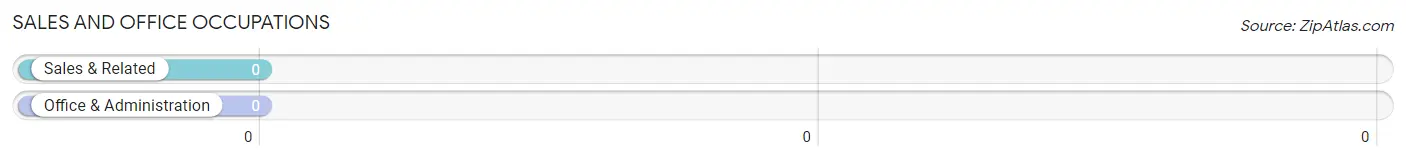
Sales and Office Occupations by Sex
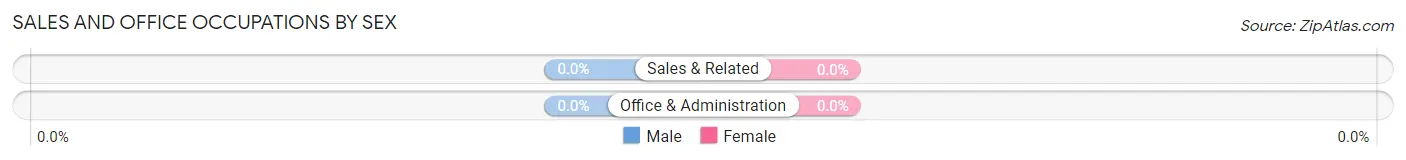
| Occupation | Male | Female |
| Sales & Related | 0 (0.0%) | 0 (0.0%) |
| Office & Administration | 0 (0.0%) | 0 (0.0%) |
| Total (Category) | 0 (0.0%) | 0 (0.0%) |
| Total (Overall) | 25 (55.6%) | 20 (44.4%) |
Natural Resources, Construction and Maintenance Occupations
The most common Natural Resources, Construction and Maintenance occupations in Fort Yates are Installation, Maintenance & Repair (5 | 11.1%), and Construction & Extraction (2 | 4.4%).
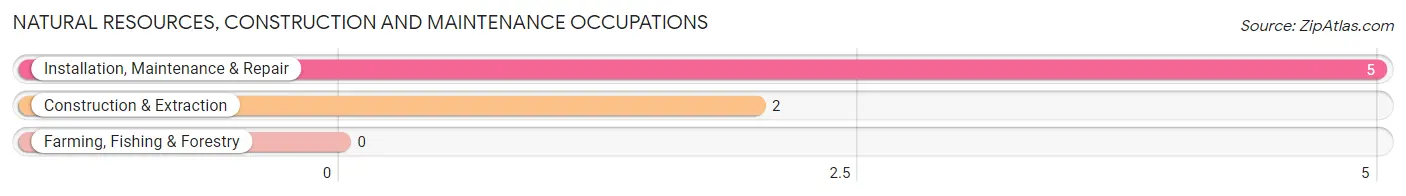
Natural Resources, Construction and Maintenance Occupations by Sex
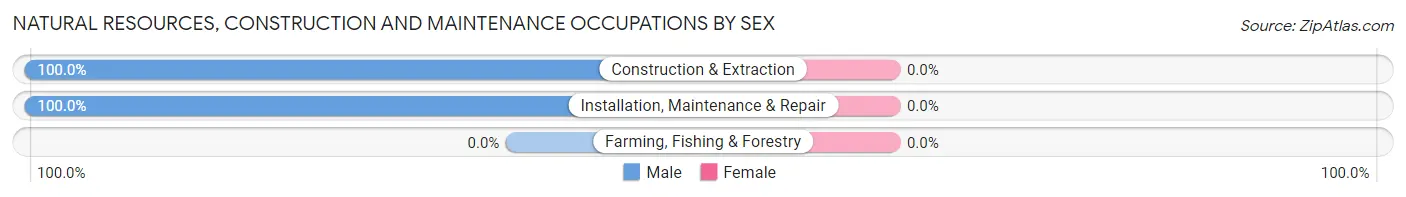
| Occupation | Male | Female |
| Farming, Fishing & Forestry | 0 (0.0%) | 0 (0.0%) |
| Construction & Extraction | 2 (100.0%) | 0 (0.0%) |
| Installation, Maintenance & Repair | 5 (100.0%) | 0 (0.0%) |
| Total (Category) | 7 (100.0%) | 0 (0.0%) |
| Total (Overall) | 25 (55.6%) | 20 (44.4%) |
Production, Transportation and Moving Occupations
The most common Production, Transportation and Moving occupations in Fort Yates are Transportation (3 | 6.7%), and Production (2 | 4.4%).
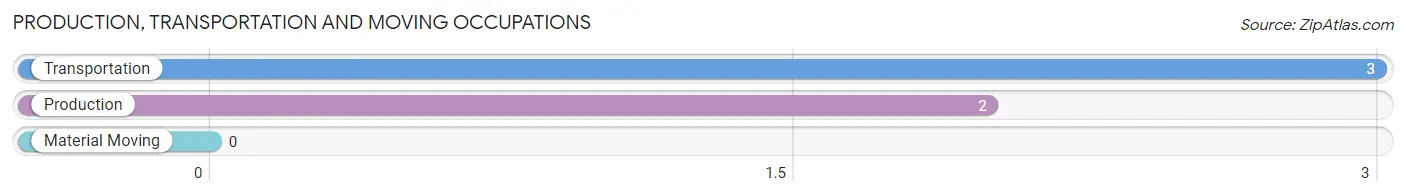
Production, Transportation and Moving Occupations by Sex
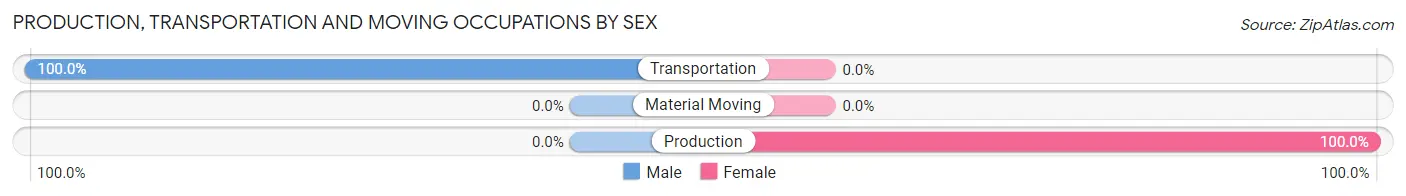
| Occupation | Male | Female |
| Production | 0 (0.0%) | 2 (100.0%) |
| Transportation | 3 (100.0%) | 0 (0.0%) |
| Material Moving | 0 (0.0%) | 0 (0.0%) |
| Total (Category) | 3 (60.0%) | 2 (40.0%) |
| Total (Overall) | 25 (55.6%) | 20 (44.4%) |
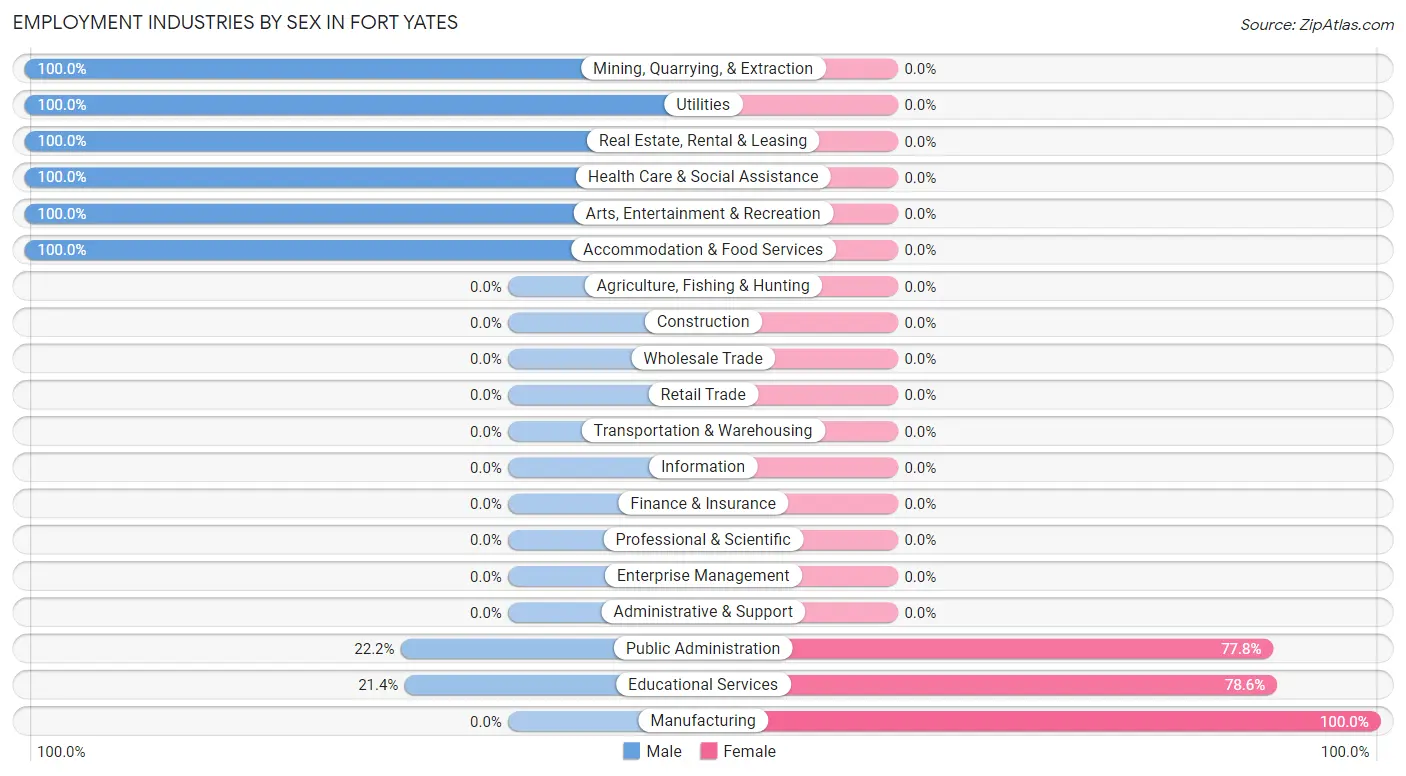
Employment Industries by Sex in Fort Yates
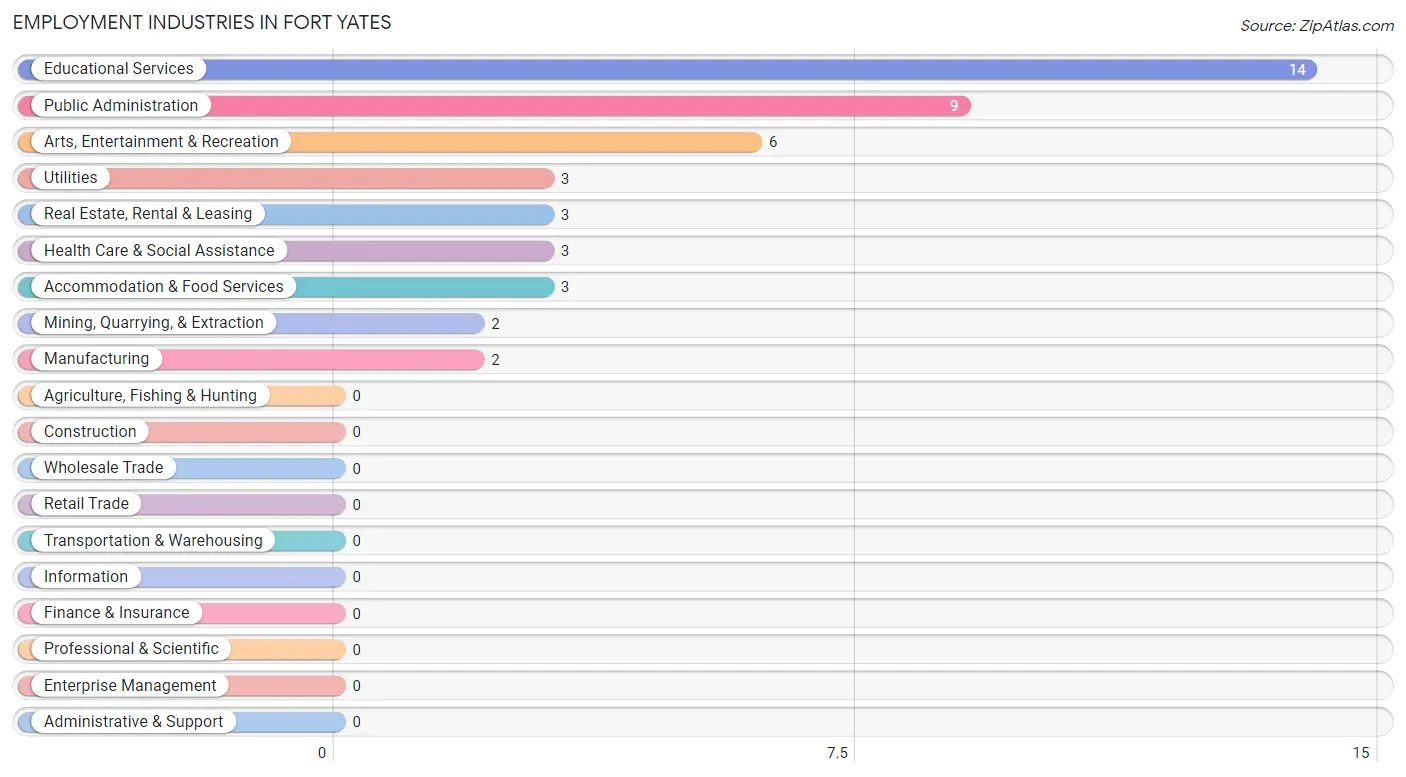
Employment Industries in Fort Yates
The major employment industries in Fort Yates include Educational Services (14 | 31.1%), Public Administration (9 | 20.0%), Arts, Entertainment & Recreation (6 | 13.3%), Utilities (3 | 6.7%), and Real Estate, Rental & Leasing (3 | 6.7%).
Employment Industries by Sex in Fort Yates
The Fort Yates industries that see more men than women are Mining, Quarrying, & Extraction (100.0%), Utilities (100.0%), and Real Estate, Rental & Leasing (100.0%), whereas the industries that tend to have a higher number of women are Manufacturing (100.0%), Educational Services (78.6%), and Public Administration (77.8%).
| Industry | Male | Female |
| Agriculture, Fishing & Hunting | 0 (0.0%) | 0 (0.0%) |
| Mining, Quarrying, & Extraction | 2 (100.0%) | 0 (0.0%) |
| Construction | 0 (0.0%) | 0 (0.0%) |
| Manufacturing | 0 (0.0%) | 2 (100.0%) |
| Wholesale Trade | 0 (0.0%) | 0 (0.0%) |
| Retail Trade | 0 (0.0%) | 0 (0.0%) |
| Transportation & Warehousing | 0 (0.0%) | 0 (0.0%) |
| Utilities | 3 (100.0%) | 0 (0.0%) |
| Information | 0 (0.0%) | 0 (0.0%) |
| Finance & Insurance | 0 (0.0%) | 0 (0.0%) |
| Real Estate, Rental & Leasing | 3 (100.0%) | 0 (0.0%) |
| Professional & Scientific | 0 (0.0%) | 0 (0.0%) |
| Enterprise Management | 0 (0.0%) | 0 (0.0%) |
| Administrative & Support | 0 (0.0%) | 0 (0.0%) |
| Educational Services | 3 (21.4%) | 11 (78.6%) |
| Health Care & Social Assistance | 3 (100.0%) | 0 (0.0%) |
| Arts, Entertainment & Recreation | 6 (100.0%) | 0 (0.0%) |
| Accommodation & Food Services | 3 (100.0%) | 0 (0.0%) |
| Public Administration | 2 (22.2%) | 7 (77.8%) |
| Total | 25 (55.6%) | 20 (44.4%) |
Education in Fort Yates
School Enrollment in Fort Yates
The most common levels of schooling among the 43 students in Fort Yates are middle school (14 | 32.6%), college / undergraduate (12 | 27.9%), and elementary school (9 | 20.9%).
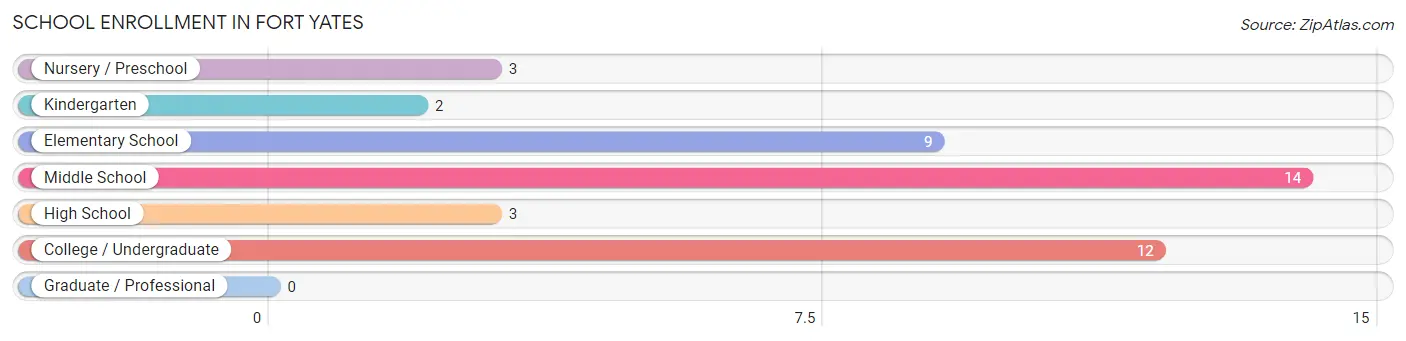
| School Level | # Students | % Students |
| Nursery / Preschool | 3 | 7.0% |
| Kindergarten | 2 | 4.6% |
| Elementary School | 9 | 20.9% |
| Middle School | 14 | 32.6% |
| High School | 3 | 7.0% |
| College / Undergraduate | 12 | 27.9% |
| Graduate / Professional | 0 | 0.0% |
| Total | 43 | 100.0% |
School Enrollment by Age by Funding Source in Fort Yates
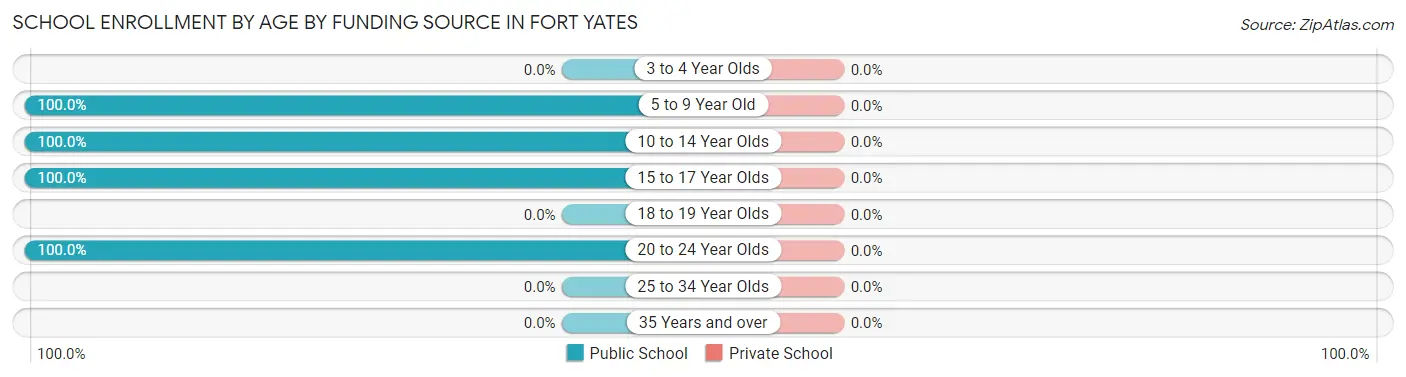
| Age Bracket | Public School | Private School |
| 3 to 4 Year Olds | 0 (0.0%) | 0 (0.0%) |
| 5 to 9 Year Old | 8 (100.0%) | 0 (0.0%) |
| 10 to 14 Year Olds | 20 (100.0%) | 0 (0.0%) |
| 15 to 17 Year Olds | 3 (100.0%) | 0 (0.0%) |
| 18 to 19 Year Olds | 0 (0.0%) | 0 (0.0%) |
| 20 to 24 Year Olds | 12 (100.0%) | 0 (0.0%) |
| 25 to 34 Year Olds | 0 (0.0%) | 0 (0.0%) |
| 35 Years and over | 0 (0.0%) | 0 (0.0%) |
| Total | 43 (100.0%) | 0 (0.0%) |
Educational Attainment by Field of Study in Fort Yates
Arts & humanities (7 | 33.3%), education (6 | 28.6%), literature & languages (3 | 14.3%), psychology (2 | 9.5%), and liberal arts & history (2 | 9.5%) are the most common fields of study among 21 individuals in Fort Yates who have obtained a bachelor's degree or higher.
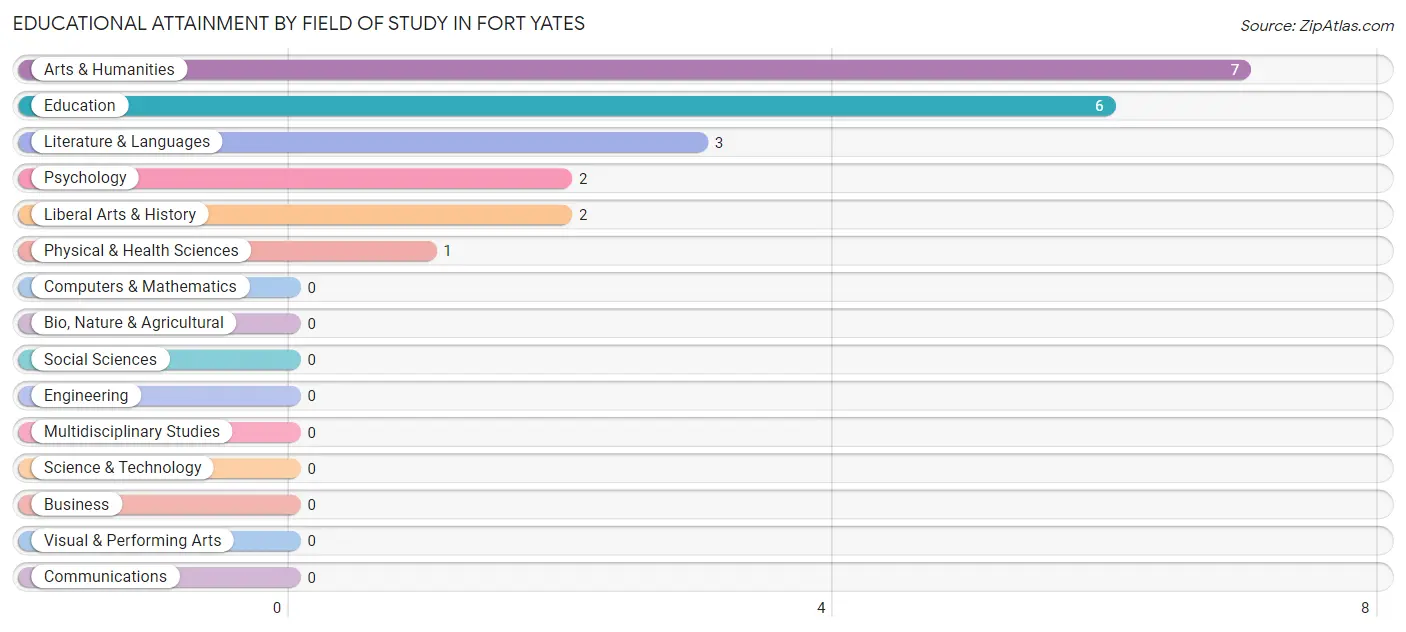
| Field of Study | # Graduates | % Graduates |
| Computers & Mathematics | 0 | 0.0% |
| Bio, Nature & Agricultural | 0 | 0.0% |
| Physical & Health Sciences | 1 | 4.8% |
| Psychology | 2 | 9.5% |
| Social Sciences | 0 | 0.0% |
| Engineering | 0 | 0.0% |
| Multidisciplinary Studies | 0 | 0.0% |
| Science & Technology | 0 | 0.0% |
| Business | 0 | 0.0% |
| Education | 6 | 28.6% |
| Literature & Languages | 3 | 14.3% |
| Liberal Arts & History | 2 | 9.5% |
| Visual & Performing Arts | 0 | 0.0% |
| Communications | 0 | 0.0% |
| Arts & Humanities | 7 | 33.3% |
| Total | 21 | 100.0% |
Transportation & Commute in Fort Yates
Vehicle Availability by Sex in Fort Yates
The most prevalent vehicle ownership categories in Fort Yates are males with 2 vehicles (12, accounting for 48.0%) and females with 2 vehicles (18, making up 60.0%).
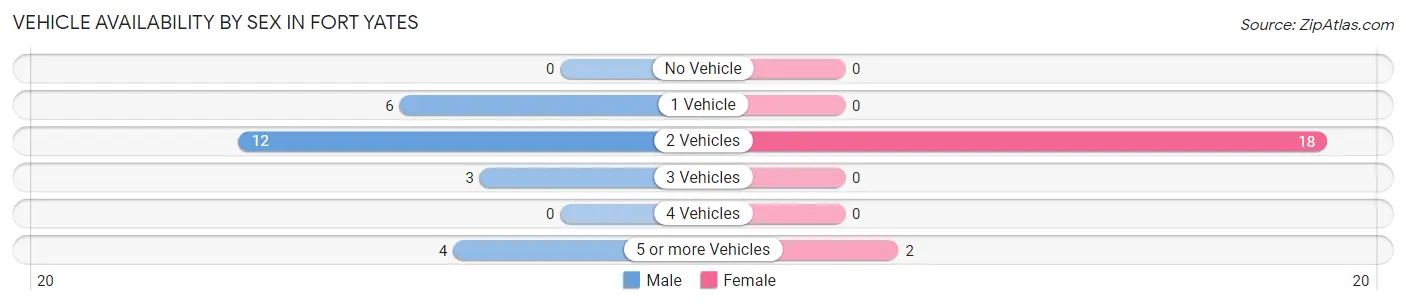
| Vehicles Available | Male | Female |
| No Vehicle | 0 (0.0%) | 0 (0.0%) |
| 1 Vehicle | 6 (24.0%) | 0 (0.0%) |
| 2 Vehicles | 12 (48.0%) | 18 (90.0%) |
| 3 Vehicles | 3 (12.0%) | 0 (0.0%) |
| 4 Vehicles | 0 (0.0%) | 0 (0.0%) |
| 5 or more Vehicles | 4 (16.0%) | 2 (10.0%) |
| Total | 25 (100.0%) | 20 (100.0%) |
Commute Time in Fort Yates
The most frequently occuring commute durations in Fort Yates are 5 to 9 minutes (15 commuters, 33.3%), 15 to 19 minutes (9 commuters, 20.0%), and 10 to 14 minutes (8 commuters, 17.8%).
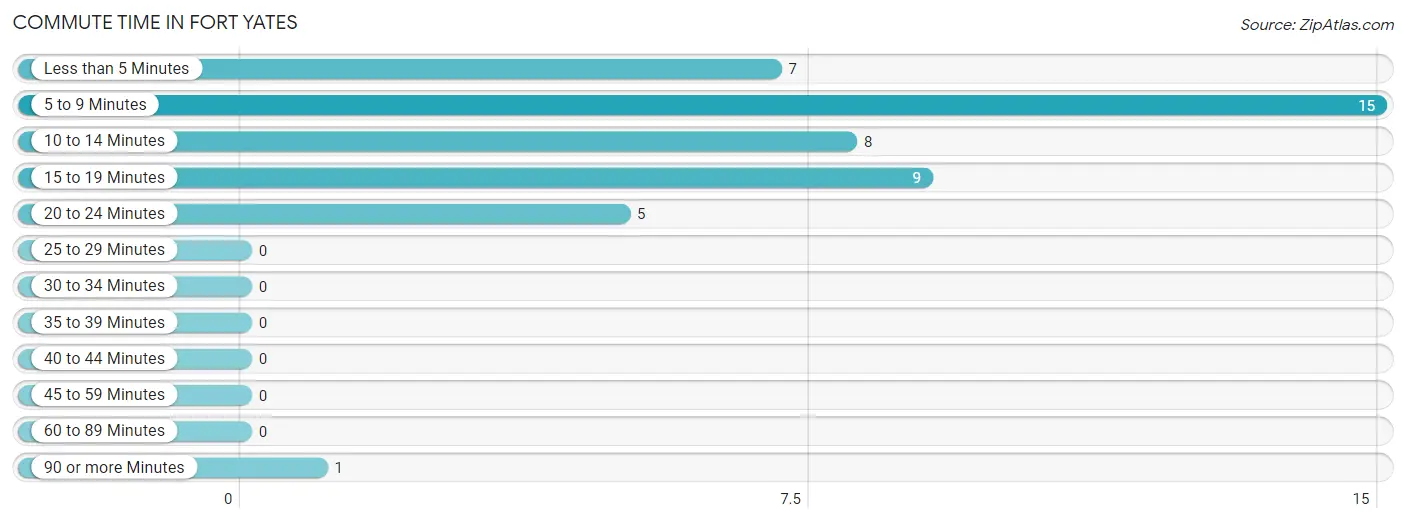
| Commute Time | # Commuters | % Commuters |
| Less than 5 Minutes | 7 | 15.6% |
| 5 to 9 Minutes | 15 | 33.3% |
| 10 to 14 Minutes | 8 | 17.8% |
| 15 to 19 Minutes | 9 | 20.0% |
| 20 to 24 Minutes | 5 | 11.1% |
| 25 to 29 Minutes | 0 | 0.0% |
| 30 to 34 Minutes | 0 | 0.0% |
| 35 to 39 Minutes | 0 | 0.0% |
| 40 to 44 Minutes | 0 | 0.0% |
| 45 to 59 Minutes | 0 | 0.0% |
| 60 to 89 Minutes | 0 | 0.0% |
| 90 or more Minutes | 1 | 2.2% |
Commute Time by Sex in Fort Yates
The most common commute times in Fort Yates are 5 to 9 minutes (8 commuters, 32.0%) for males and 5 to 9 minutes (7 commuters, 35.0%) for females.
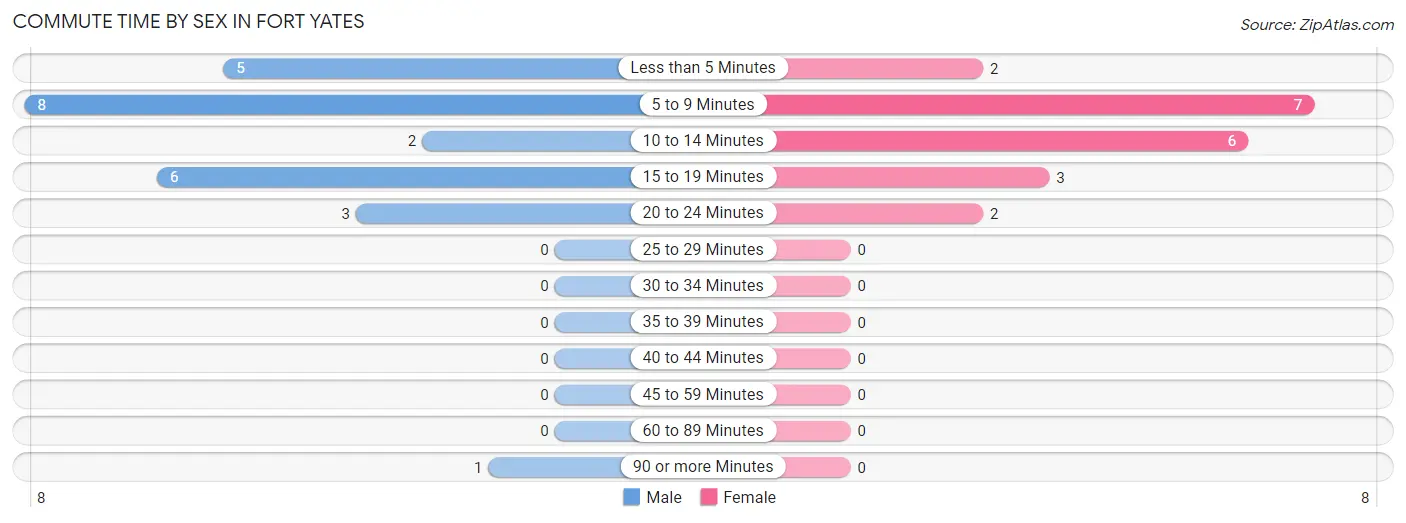
| Commute Time | Male | Female |
| Less than 5 Minutes | 5 (20.0%) | 2 (10.0%) |
| 5 to 9 Minutes | 8 (32.0%) | 7 (35.0%) |
| 10 to 14 Minutes | 2 (8.0%) | 6 (30.0%) |
| 15 to 19 Minutes | 6 (24.0%) | 3 (15.0%) |
| 20 to 24 Minutes | 3 (12.0%) | 2 (10.0%) |
| 25 to 29 Minutes | 0 (0.0%) | 0 (0.0%) |
| 30 to 34 Minutes | 0 (0.0%) | 0 (0.0%) |
| 35 to 39 Minutes | 0 (0.0%) | 0 (0.0%) |
| 40 to 44 Minutes | 0 (0.0%) | 0 (0.0%) |
| 45 to 59 Minutes | 0 (0.0%) | 0 (0.0%) |
| 60 to 89 Minutes | 0 (0.0%) | 0 (0.0%) |
| 90 or more Minutes | 1 (4.0%) | 0 (0.0%) |
Time of Departure to Work by Sex in Fort Yates
The most frequent times of departure to work in Fort Yates are 7:30 AM to 7:59 AM (7, 28.0%) for males and 7:30 AM to 7:59 AM (20, 100.0%) for females.
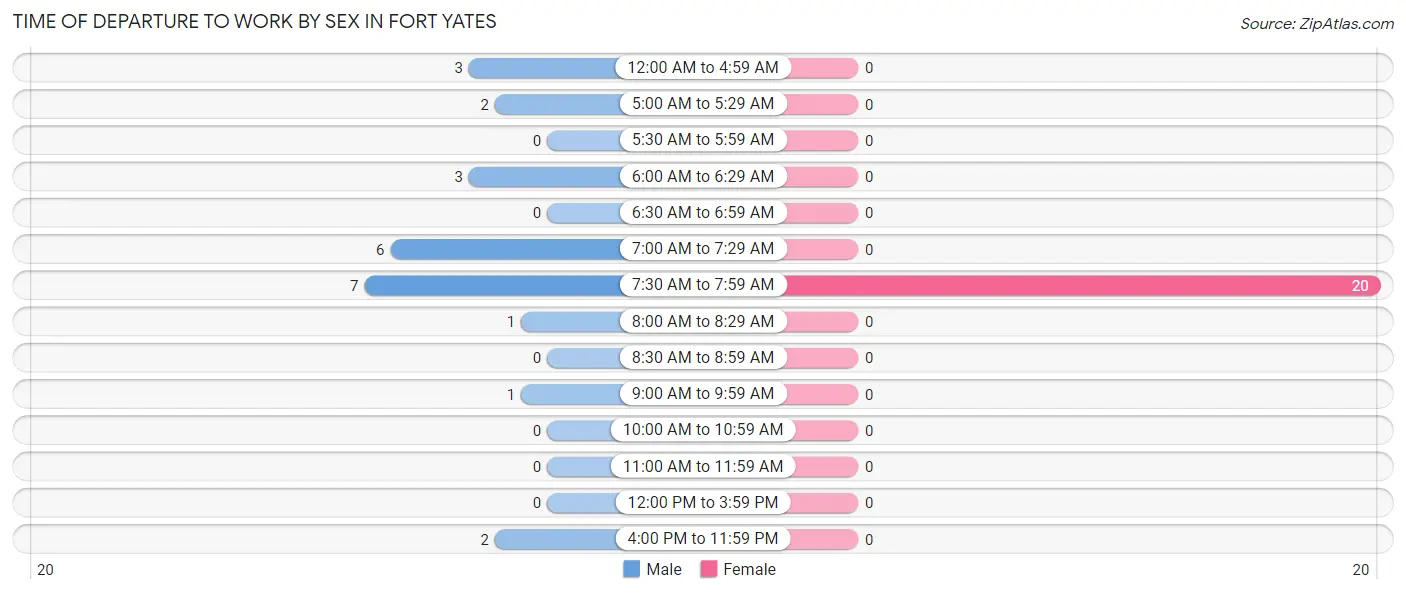
| Time of Departure | Male | Female |
| 12:00 AM to 4:59 AM | 3 (12.0%) | 0 (0.0%) |
| 5:00 AM to 5:29 AM | 2 (8.0%) | 0 (0.0%) |
| 5:30 AM to 5:59 AM | 0 (0.0%) | 0 (0.0%) |
| 6:00 AM to 6:29 AM | 3 (12.0%) | 0 (0.0%) |
| 6:30 AM to 6:59 AM | 0 (0.0%) | 0 (0.0%) |
| 7:00 AM to 7:29 AM | 6 (24.0%) | 0 (0.0%) |
| 7:30 AM to 7:59 AM | 7 (28.0%) | 20 (100.0%) |
| 8:00 AM to 8:29 AM | 1 (4.0%) | 0 (0.0%) |
| 8:30 AM to 8:59 AM | 0 (0.0%) | 0 (0.0%) |
| 9:00 AM to 9:59 AM | 1 (4.0%) | 0 (0.0%) |
| 10:00 AM to 10:59 AM | 0 (0.0%) | 0 (0.0%) |
| 11:00 AM to 11:59 AM | 0 (0.0%) | 0 (0.0%) |
| 12:00 PM to 3:59 PM | 0 (0.0%) | 0 (0.0%) |
| 4:00 PM to 11:59 PM | 2 (8.0%) | 0 (0.0%) |
| Total | 25 (100.0%) | 20 (100.0%) |
Housing Occupancy in Fort Yates
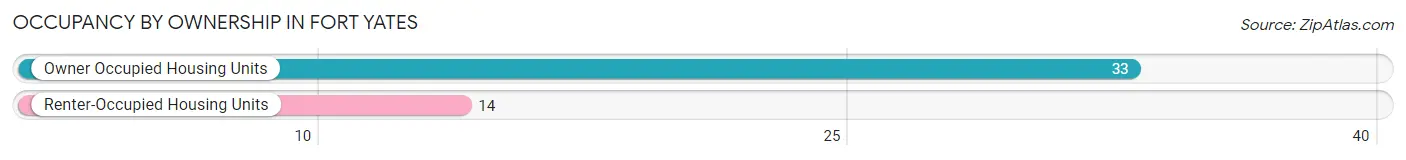
Occupancy by Ownership in Fort Yates
Of the total 47 dwellings in Fort Yates, owner-occupied units account for 33 (70.2%), while renter-occupied units make up 14 (29.8%).
| Occupancy | # Housing Units | % Housing Units |
| Owner Occupied Housing Units | 33 | 70.2% |
| Renter-Occupied Housing Units | 14 | 29.8% |
| Total Occupied Housing Units | 47 | 100.0% |
Occupancy by Household Size in Fort Yates
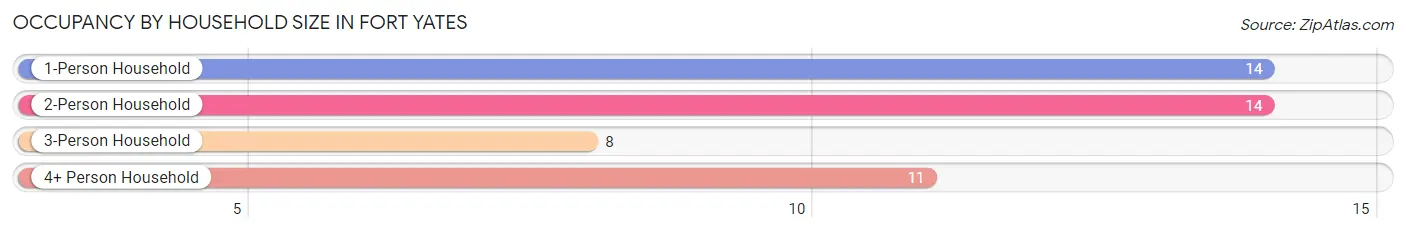
| Household Size | # Housing Units | % Housing Units |
| 1-Person Household | 14 | 29.8% |
| 2-Person Household | 14 | 29.8% |
| 3-Person Household | 8 | 17.0% |
| 4+ Person Household | 11 | 23.4% |
| Total Housing Units | 47 | 100.0% |
Occupancy by Ownership by Household Size in Fort Yates
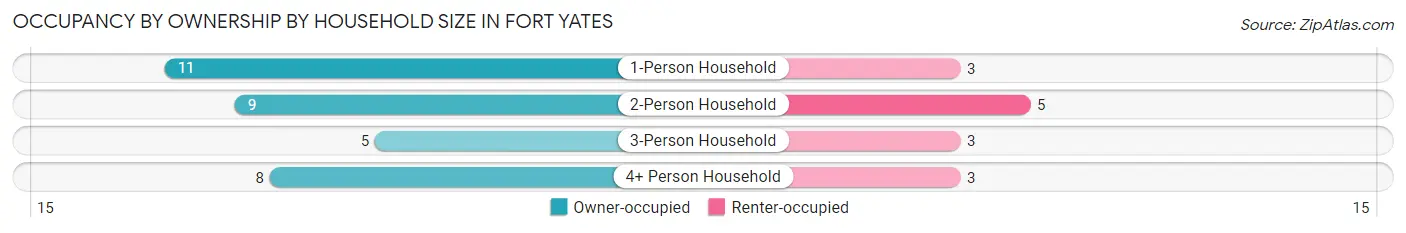
| Household Size | Owner-occupied | Renter-occupied |
| 1-Person Household | 11 (78.6%) | 3 (21.4%) |
| 2-Person Household | 9 (64.3%) | 5 (35.7%) |
| 3-Person Household | 5 (62.5%) | 3 (37.5%) |
| 4+ Person Household | 8 (72.7%) | 3 (27.3%) |
| Total Housing Units | 33 (70.2%) | 14 (29.8%) |
Occupancy by Educational Attainment in Fort Yates
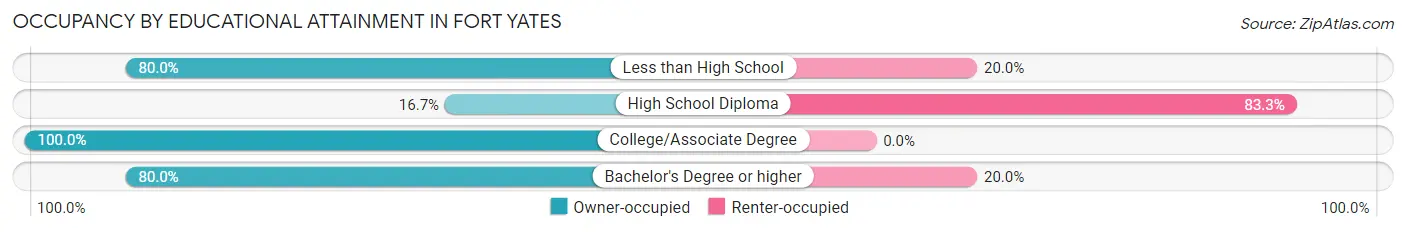
| Household Size | Owner-occupied | Renter-occupied |
| Less than High School | 4 (80.0%) | 1 (20.0%) |
| High School Diploma | 2 (16.7%) | 10 (83.3%) |
| College/Associate Degree | 15 (100.0%) | 0 (0.0%) |
| Bachelor's Degree or higher | 12 (80.0%) | 3 (20.0%) |
Occupancy by Age of Householder in Fort Yates
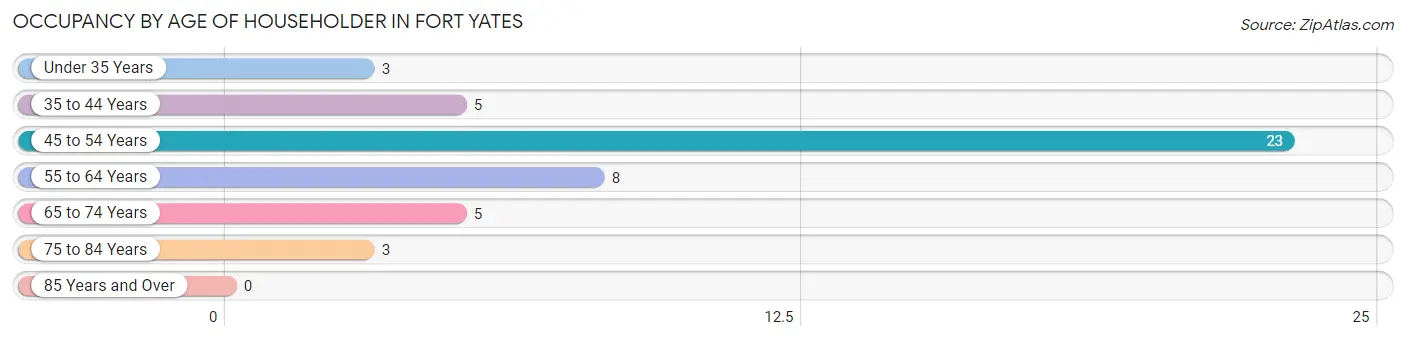
| Age Bracket | # Households | % Households |
| Under 35 Years | 3 | 6.4% |
| 35 to 44 Years | 5 | 10.6% |
| 45 to 54 Years | 23 | 48.9% |
| 55 to 64 Years | 8 | 17.0% |
| 65 to 74 Years | 5 | 10.6% |
| 75 to 84 Years | 3 | 6.4% |
| 85 Years and Over | 0 | 0.0% |
| Total | 47 | 100.0% |
Housing Finances in Fort Yates
Median Income by Occupancy in Fort Yates
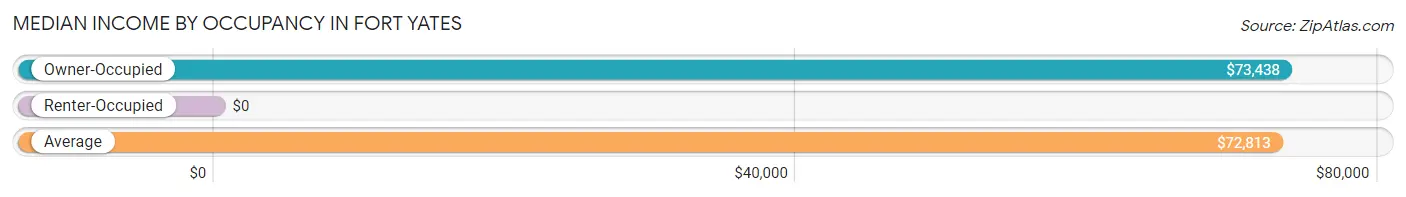
| Occupancy Type | # Households | Median Income |
| Owner-Occupied | 33 (70.2%) | $73,438 |
| Renter-Occupied | 14 (29.8%) | $0 |
| Average | 47 (100.0%) | $72,813 |
Occupancy by Householder Income Bracket in Fort Yates
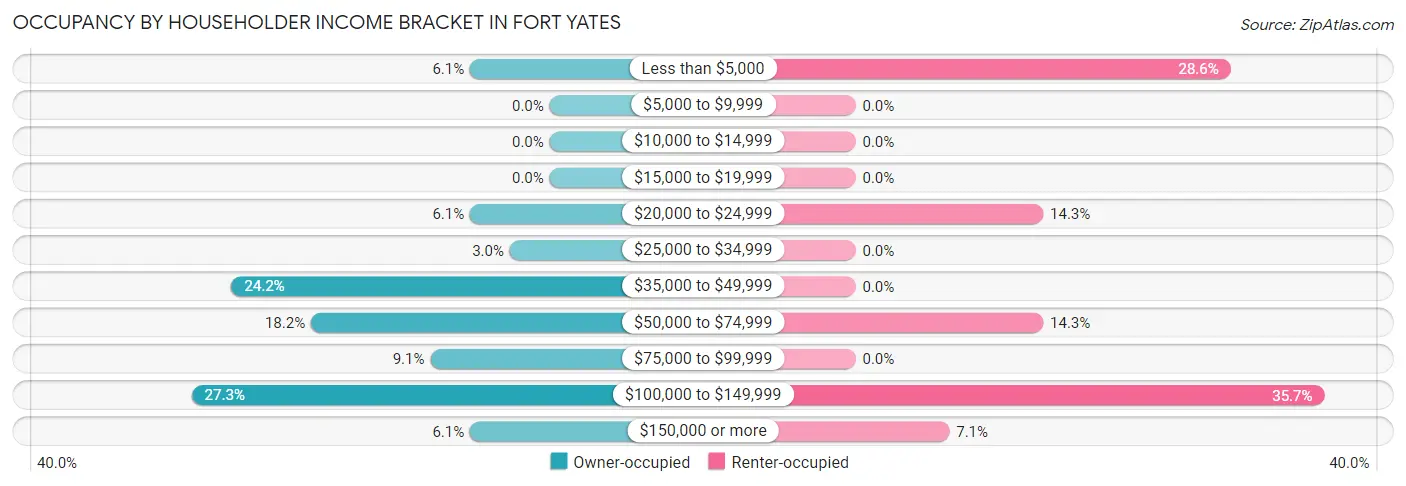
| Income Bracket | Owner-occupied | Renter-occupied |
| Less than $5,000 | 2 (6.1%) | 4 (28.6%) |
| $5,000 to $9,999 | 0 (0.0%) | 0 (0.0%) |
| $10,000 to $14,999 | 0 (0.0%) | 0 (0.0%) |
| $15,000 to $19,999 | 0 (0.0%) | 0 (0.0%) |
| $20,000 to $24,999 | 2 (6.1%) | 2 (14.3%) |
| $25,000 to $34,999 | 1 (3.0%) | 0 (0.0%) |
| $35,000 to $49,999 | 8 (24.2%) | 0 (0.0%) |
| $50,000 to $74,999 | 6 (18.2%) | 2 (14.3%) |
| $75,000 to $99,999 | 3 (9.1%) | 0 (0.0%) |
| $100,000 to $149,999 | 9 (27.3%) | 5 (35.7%) |
| $150,000 or more | 2 (6.1%) | 1 (7.1%) |
| Total | 33 (100.0%) | 14 (100.0%) |
Monthly Housing Cost Tiers in Fort Yates
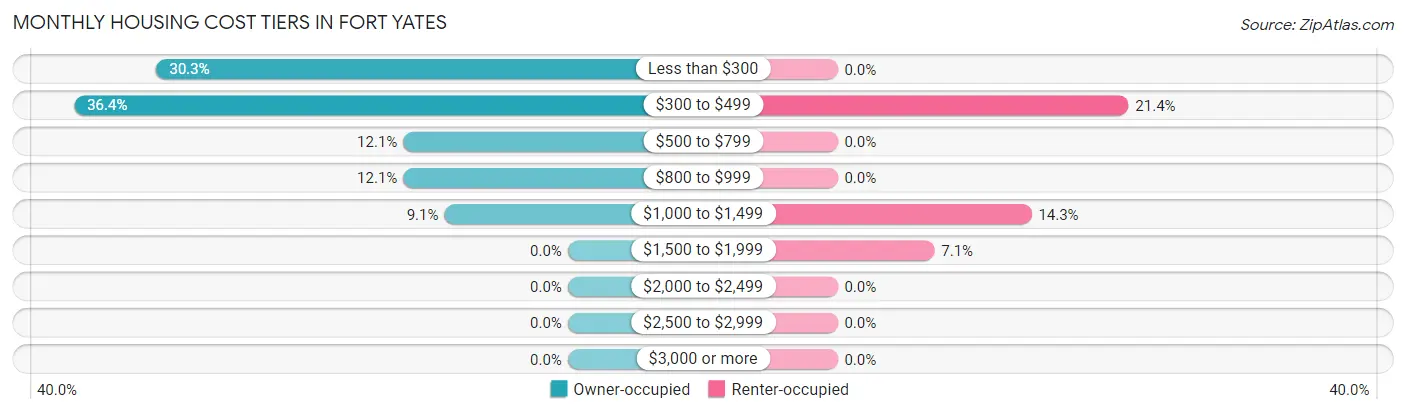
| Monthly Cost | Owner-occupied | Renter-occupied |
| Less than $300 | 10 (30.3%) | 0 (0.0%) |
| $300 to $499 | 12 (36.4%) | 3 (21.4%) |
| $500 to $799 | 4 (12.1%) | 0 (0.0%) |
| $800 to $999 | 4 (12.1%) | 0 (0.0%) |
| $1,000 to $1,499 | 3 (9.1%) | 2 (14.3%) |
| $1,500 to $1,999 | 0 (0.0%) | 1 (7.1%) |
| $2,000 to $2,499 | 0 (0.0%) | 0 (0.0%) |
| $2,500 to $2,999 | 0 (0.0%) | 0 (0.0%) |
| $3,000 or more | 0 (0.0%) | 0 (0.0%) |
| Total | 33 (100.0%) | 14 (100.0%) |
Physical Housing Characteristics in Fort Yates
Housing Structures in Fort Yates
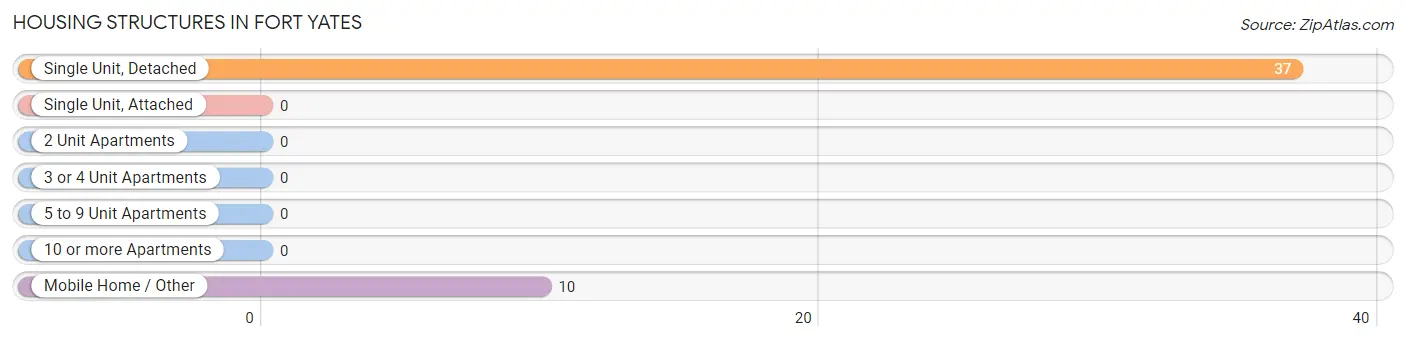
| Structure Type | # Housing Units | % Housing Units |
| Single Unit, Detached | 37 | 78.7% |
| Single Unit, Attached | 0 | 0.0% |
| 2 Unit Apartments | 0 | 0.0% |
| 3 or 4 Unit Apartments | 0 | 0.0% |
| 5 to 9 Unit Apartments | 0 | 0.0% |
| 10 or more Apartments | 0 | 0.0% |
| Mobile Home / Other | 10 | 21.3% |
| Total | 47 | 100.0% |
Housing Structures by Occupancy in Fort Yates
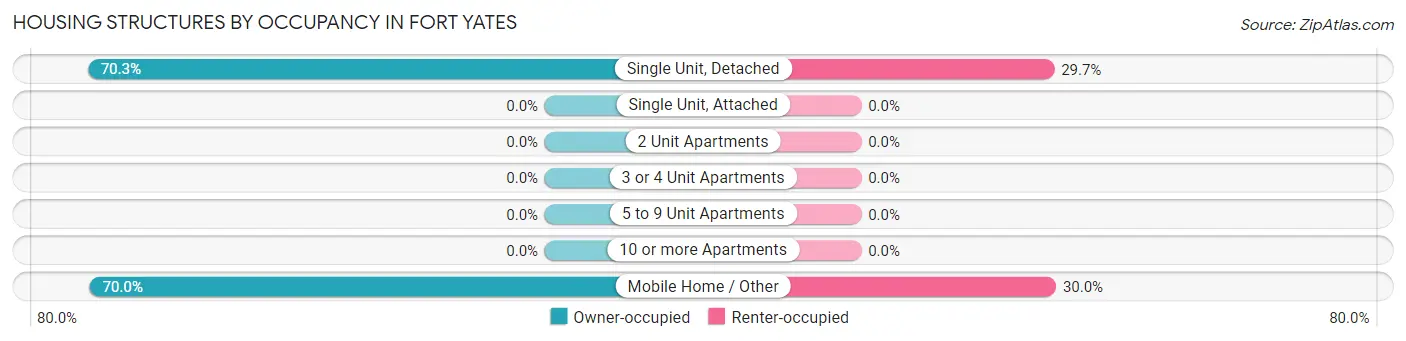
| Structure Type | Owner-occupied | Renter-occupied |
| Single Unit, Detached | 26 (70.3%) | 11 (29.7%) |
| Single Unit, Attached | 0 (0.0%) | 0 (0.0%) |
| 2 Unit Apartments | 0 (0.0%) | 0 (0.0%) |
| 3 or 4 Unit Apartments | 0 (0.0%) | 0 (0.0%) |
| 5 to 9 Unit Apartments | 0 (0.0%) | 0 (0.0%) |
| 10 or more Apartments | 0 (0.0%) | 0 (0.0%) |
| Mobile Home / Other | 7 (70.0%) | 3 (30.0%) |
| Total | 33 (70.2%) | 14 (29.8%) |
Housing Structures by Number of Rooms in Fort Yates
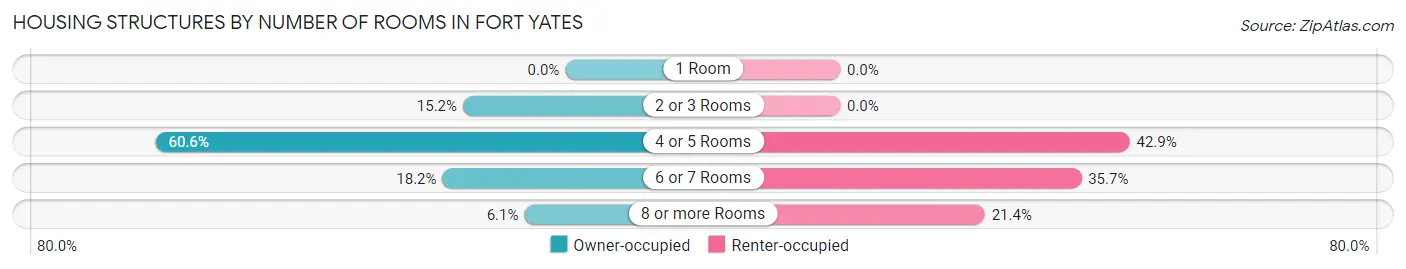
| Number of Rooms | Owner-occupied | Renter-occupied |
| 1 Room | 0 (0.0%) | 0 (0.0%) |
| 2 or 3 Rooms | 5 (15.1%) | 0 (0.0%) |
| 4 or 5 Rooms | 20 (60.6%) | 6 (42.9%) |
| 6 or 7 Rooms | 6 (18.2%) | 5 (35.7%) |
| 8 or more Rooms | 2 (6.1%) | 3 (21.4%) |
| Total | 33 (100.0%) | 14 (100.0%) |
Housing Structure by Heating Type in Fort Yates
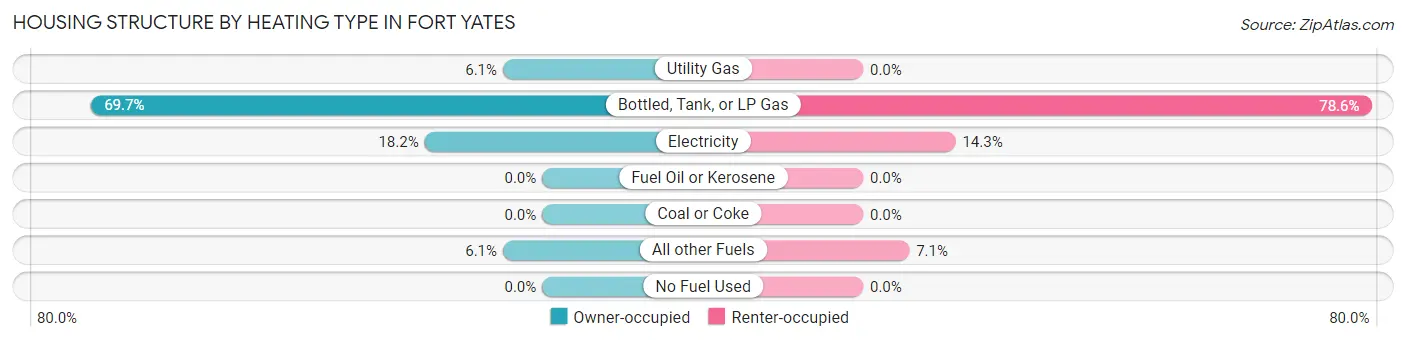
| Heating Type | Owner-occupied | Renter-occupied |
| Utility Gas | 2 (6.1%) | 0 (0.0%) |
| Bottled, Tank, or LP Gas | 23 (69.7%) | 11 (78.6%) |
| Electricity | 6 (18.2%) | 2 (14.3%) |
| Fuel Oil or Kerosene | 0 (0.0%) | 0 (0.0%) |
| Coal or Coke | 0 (0.0%) | 0 (0.0%) |
| All other Fuels | 2 (6.1%) | 1 (7.1%) |
| No Fuel Used | 0 (0.0%) | 0 (0.0%) |
| Total | 33 (100.0%) | 14 (100.0%) |
Household Vehicle Usage in Fort Yates
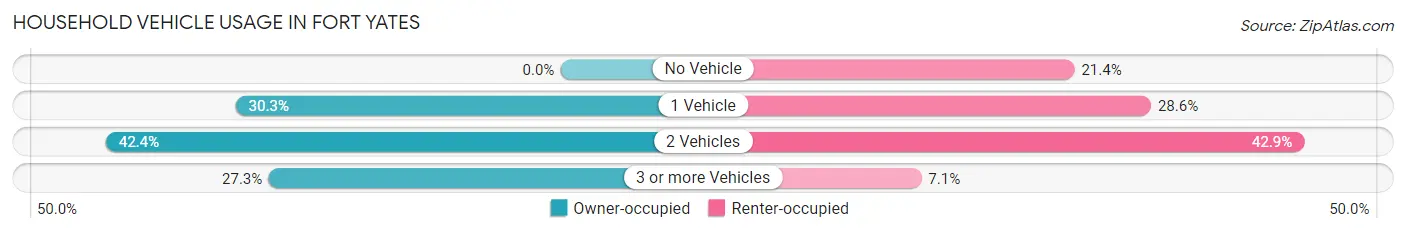
| Vehicles per Household | Owner-occupied | Renter-occupied |
| No Vehicle | 0 (0.0%) | 3 (21.4%) |
| 1 Vehicle | 10 (30.3%) | 4 (28.6%) |
| 2 Vehicles | 14 (42.4%) | 6 (42.9%) |
| 3 or more Vehicles | 9 (27.3%) | 1 (7.1%) |
| Total | 33 (100.0%) | 14 (100.0%) |
Real Estate & Mortgages in Fort Yates
Real Estate and Mortgage Overview in Fort Yates
| Characteristic | Without Mortgage | With Mortgage |
| Housing Units | 30 | 3 |
| Median Property Value | $46,000 | $0 |
| Median Household Income | $65,000 | $0 |
| Monthly Housing Costs | $342 | $0 |
| Real Estate Taxes | $250 | $3 |
Property Value by Mortgage Status in Fort Yates
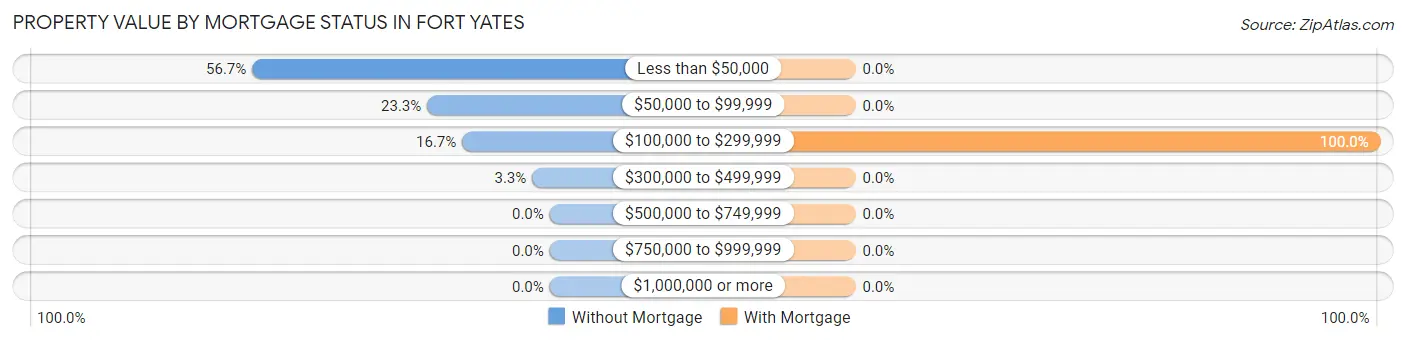
| Property Value | Without Mortgage | With Mortgage |
| Less than $50,000 | 17 (56.7%) | 0 (0.0%) |
| $50,000 to $99,999 | 7 (23.3%) | 0 (0.0%) |
| $100,000 to $299,999 | 5 (16.7%) | 3 (100.0%) |
| $300,000 to $499,999 | 1 (3.3%) | 0 (0.0%) |
| $500,000 to $749,999 | 0 (0.0%) | 0 (0.0%) |
| $750,000 to $999,999 | 0 (0.0%) | 0 (0.0%) |
| $1,000,000 or more | 0 (0.0%) | 0 (0.0%) |
| Total | 30 (100.0%) | 3 (100.0%) |
Household Income by Mortgage Status in Fort Yates
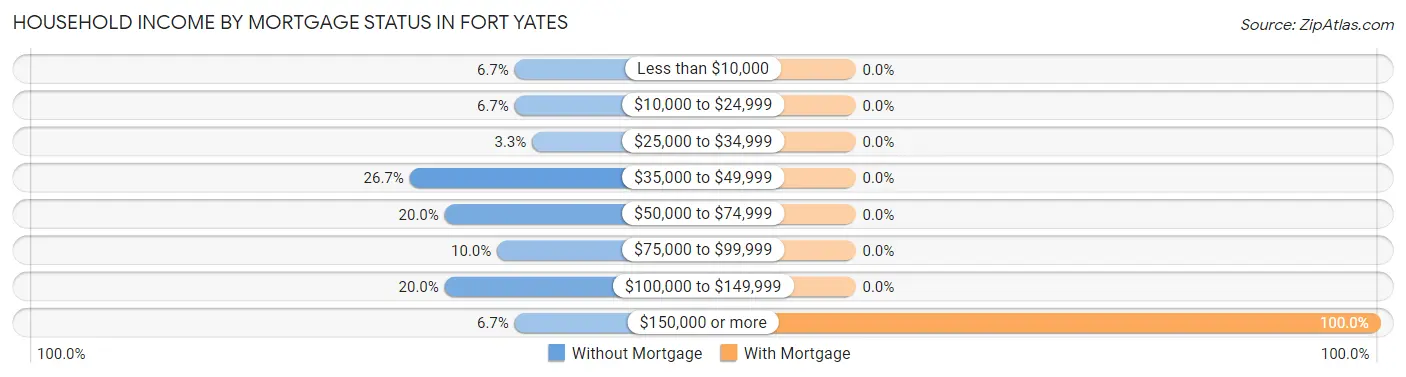
| Household Income | Without Mortgage | With Mortgage |
| Less than $10,000 | 2 (6.7%) | 0 (0.0%) |
| $10,000 to $24,999 | 2 (6.7%) | 0 (0.0%) |
| $25,000 to $34,999 | 1 (3.3%) | 0 (0.0%) |
| $35,000 to $49,999 | 8 (26.7%) | 0 (0.0%) |
| $50,000 to $74,999 | 6 (20.0%) | 0 (0.0%) |
| $75,000 to $99,999 | 3 (10.0%) | 0 (0.0%) |
| $100,000 to $149,999 | 6 (20.0%) | 0 (0.0%) |
| $150,000 or more | 2 (6.7%) | 3 (100.0%) |
| Total | 30 (100.0%) | 3 (100.0%) |
Property Value to Household Income Ratio in Fort Yates
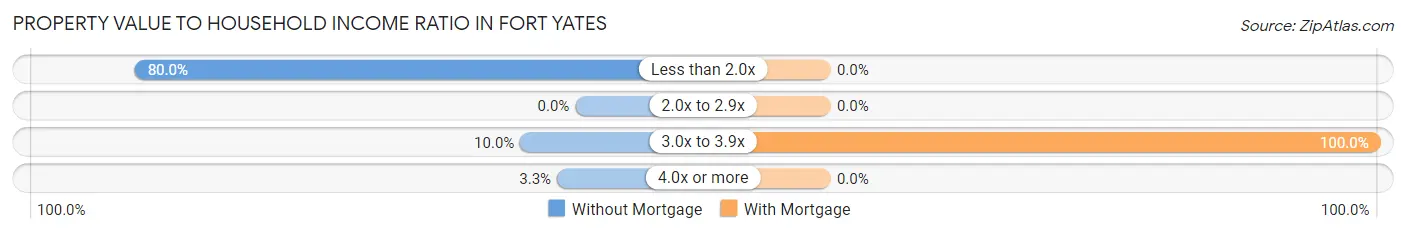
| Value-to-Income Ratio | Without Mortgage | With Mortgage |
| Less than 2.0x | 24 (80.0%) | 0 (0.0%) |
| 2.0x to 2.9x | 0 (0.0%) | 0 (0.0%) |
| 3.0x to 3.9x | 3 (10.0%) | 3 (100.0%) |
| 4.0x or more | 1 (3.3%) | 0 (0.0%) |
| Total | 30 (100.0%) | 3 (100.0%) |
Real Estate Taxes by Mortgage Status in Fort Yates
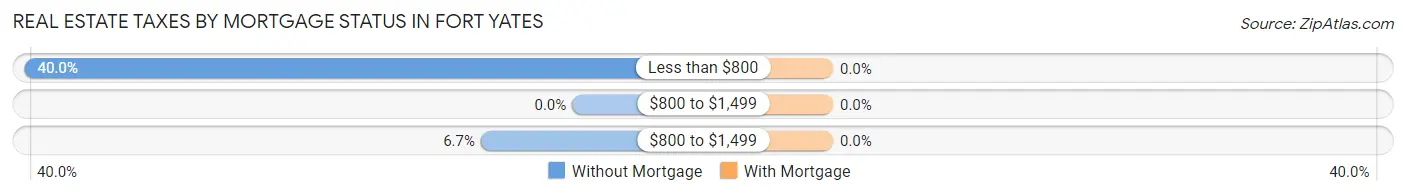
| Property Taxes | Without Mortgage | With Mortgage |
| Less than $800 | 12 (40.0%) | 0 (0.0%) |
| $800 to $1,499 | 0 (0.0%) | 0 (0.0%) |
| $800 to $1,499 | 2 (6.7%) | 0 (0.0%) |
| Total | 30 (100.0%) | 3 (100.0%) |
Health & Disability in Fort Yates
Health Insurance Coverage by Age in Fort Yates
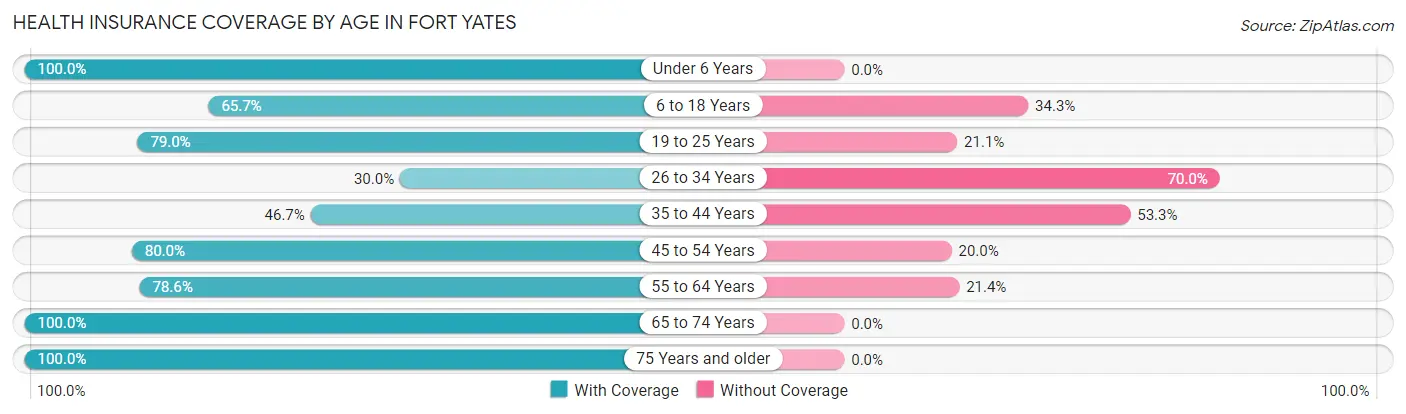
| Age Bracket | With Coverage | Without Coverage |
| Under 6 Years | 6 (100.0%) | 0 (0.0%) |
| 6 to 18 Years | 23 (65.7%) | 12 (34.3%) |
| 19 to 25 Years | 15 (78.9%) | 4 (21.0%) |
| 26 to 34 Years | 3 (30.0%) | 7 (70.0%) |
| 35 to 44 Years | 7 (46.7%) | 8 (53.3%) |
| 45 to 54 Years | 28 (80.0%) | 7 (20.0%) |
| 55 to 64 Years | 11 (78.6%) | 3 (21.4%) |
| 65 to 74 Years | 7 (100.0%) | 0 (0.0%) |
| 75 Years and older | 3 (100.0%) | 0 (0.0%) |
| Total | 103 (71.5%) | 41 (28.5%) |
Health Insurance Coverage by Citizenship Status in Fort Yates
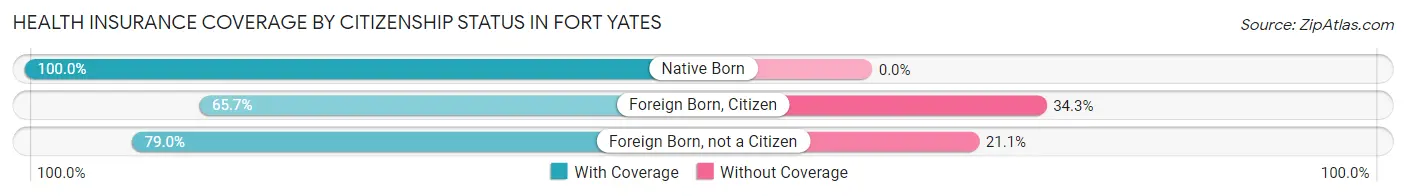
| Citizenship Status | With Coverage | Without Coverage |
| Native Born | 6 (100.0%) | 0 (0.0%) |
| Foreign Born, Citizen | 23 (65.7%) | 12 (34.3%) |
| Foreign Born, not a Citizen | 15 (78.9%) | 4 (21.0%) |
Health Insurance Coverage by Household Income in Fort Yates
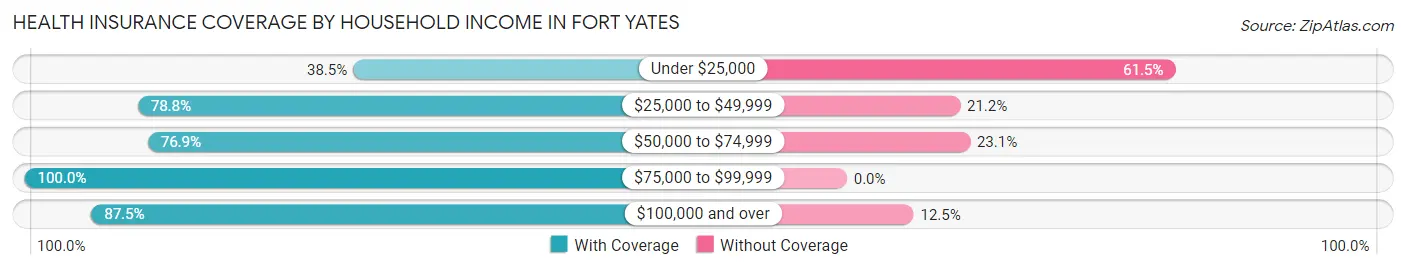
| Household Income | With Coverage | Without Coverage |
| Under $25,000 | 15 (38.5%) | 24 (61.5%) |
| $25,000 to $49,999 | 26 (78.8%) | 7 (21.2%) |
| $50,000 to $74,999 | 10 (76.9%) | 3 (23.1%) |
| $75,000 to $99,999 | 3 (100.0%) | 0 (0.0%) |
| $100,000 and over | 49 (87.5%) | 7 (12.5%) |
Public vs Private Health Insurance Coverage by Age in Fort Yates
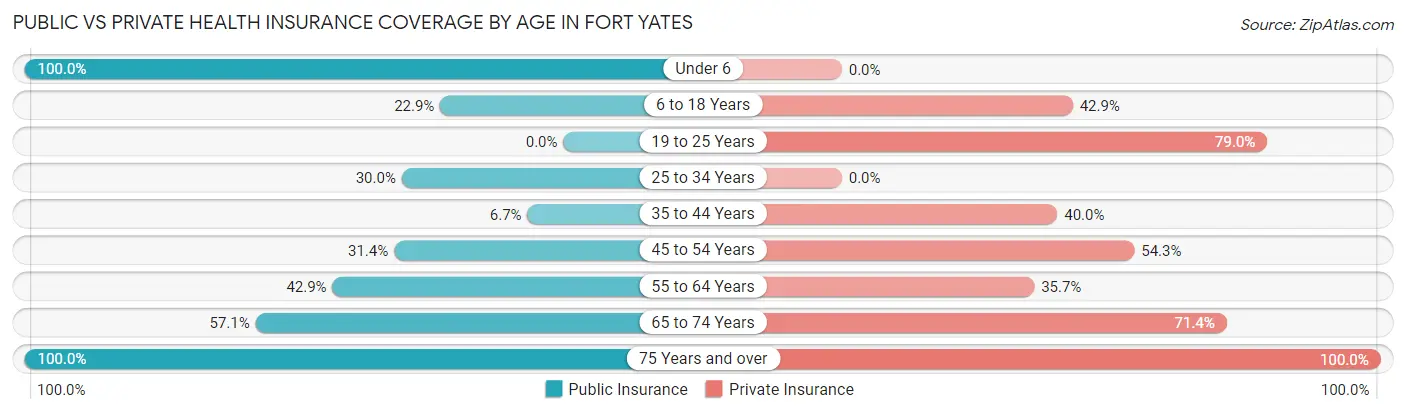
| Age Bracket | Public Insurance | Private Insurance |
| Under 6 | 6 (100.0%) | 0 (0.0%) |
| 6 to 18 Years | 8 (22.9%) | 15 (42.9%) |
| 19 to 25 Years | 0 (0.0%) | 15 (78.9%) |
| 25 to 34 Years | 3 (30.0%) | 0 (0.0%) |
| 35 to 44 Years | 1 (6.7%) | 6 (40.0%) |
| 45 to 54 Years | 11 (31.4%) | 19 (54.3%) |
| 55 to 64 Years | 6 (42.9%) | 5 (35.7%) |
| 65 to 74 Years | 4 (57.1%) | 5 (71.4%) |
| 75 Years and over | 3 (100.0%) | 3 (100.0%) |
| Total | 42 (29.2%) | 68 (47.2%) |
Disability Status by Sex by Age in Fort Yates
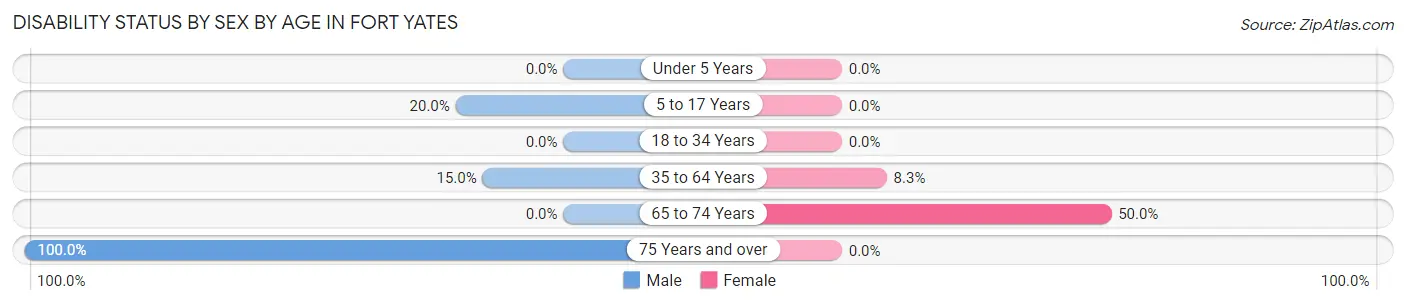
| Age Bracket | Male | Female |
| Under 5 Years | 0 (0.0%) | 0 (0.0%) |
| 5 to 17 Years | 6 (20.0%) | 0 (0.0%) |
| 18 to 34 Years | 0 (0.0%) | 0 (0.0%) |
| 35 to 64 Years | 6 (15.0%) | 2 (8.3%) |
| 65 to 74 Years | 0 (0.0%) | 2 (50.0%) |
| 75 Years and over | 1 (100.0%) | 0 (0.0%) |
Disability Class by Sex by Age in Fort Yates
Disability Class: Hearing Difficulty
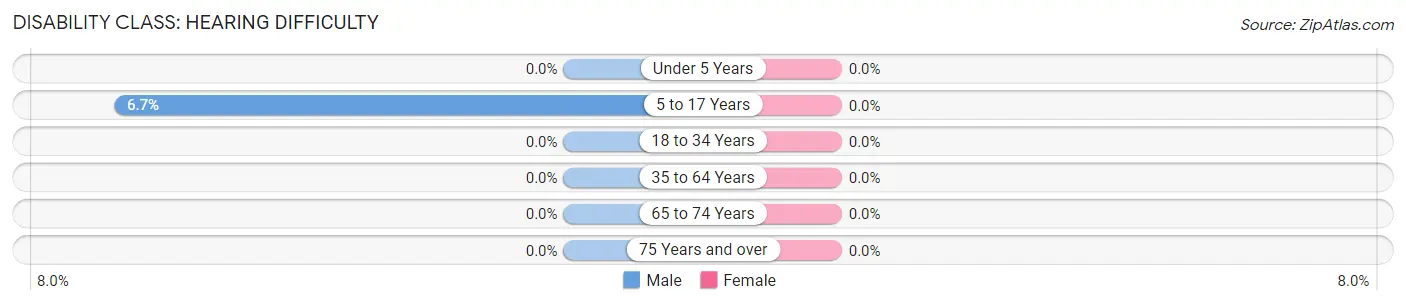
| Age Bracket | Male | Female |
| Under 5 Years | 0 (0.0%) | 0 (0.0%) |
| 5 to 17 Years | 2 (6.7%) | 0 (0.0%) |
| 18 to 34 Years | 0 (0.0%) | 0 (0.0%) |
| 35 to 64 Years | 0 (0.0%) | 0 (0.0%) |
| 65 to 74 Years | 0 (0.0%) | 0 (0.0%) |
| 75 Years and over | 0 (0.0%) | 0 (0.0%) |
Disability Class: Vision Difficulty
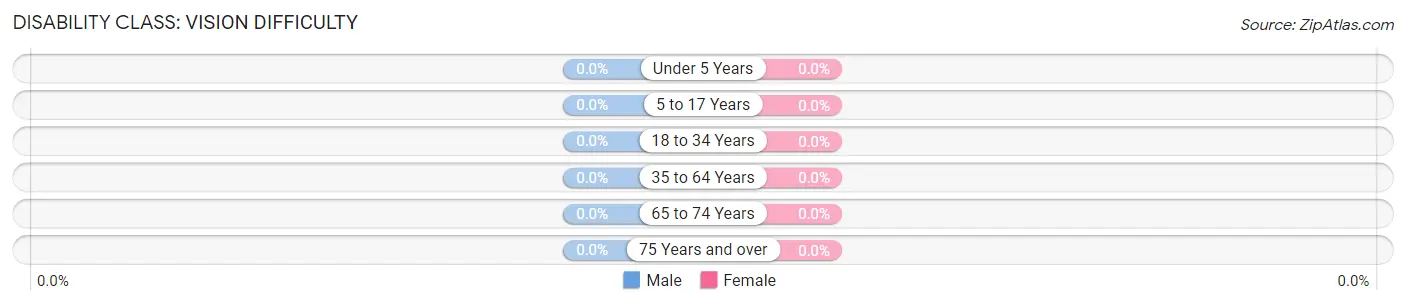
| Age Bracket | Male | Female |
| Under 5 Years | 0 (0.0%) | 0 (0.0%) |
| 5 to 17 Years | 0 (0.0%) | 0 (0.0%) |
| 18 to 34 Years | 0 (0.0%) | 0 (0.0%) |
| 35 to 64 Years | 0 (0.0%) | 0 (0.0%) |
| 65 to 74 Years | 0 (0.0%) | 0 (0.0%) |
| 75 Years and over | 0 (0.0%) | 0 (0.0%) |
Disability Class: Cognitive Difficulty
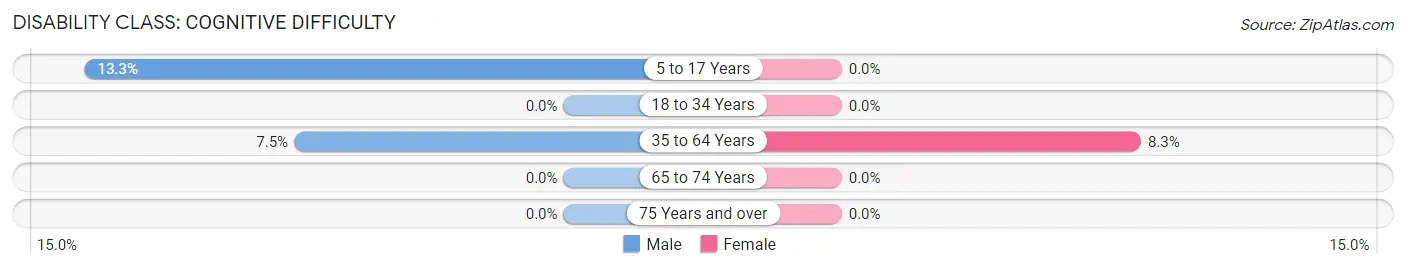
| Age Bracket | Male | Female |
| 5 to 17 Years | 4 (13.3%) | 0 (0.0%) |
| 18 to 34 Years | 0 (0.0%) | 0 (0.0%) |
| 35 to 64 Years | 3 (7.5%) | 2 (8.3%) |
| 65 to 74 Years | 0 (0.0%) | 0 (0.0%) |
| 75 Years and over | 0 (0.0%) | 0 (0.0%) |
Disability Class: Ambulatory Difficulty
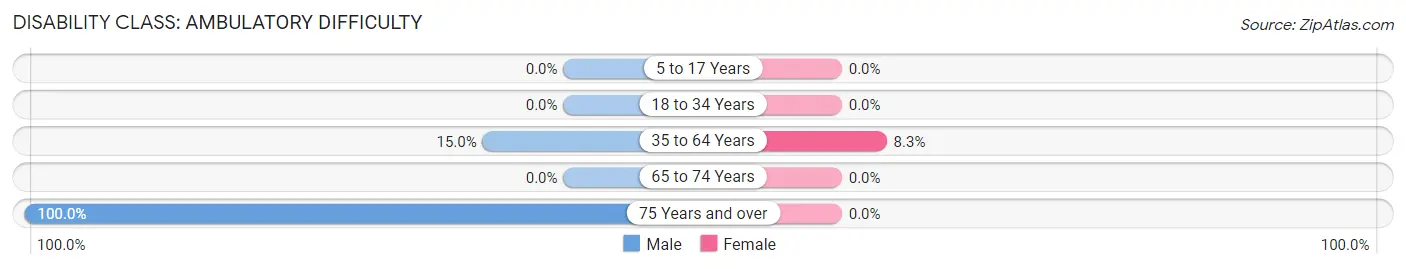
| Age Bracket | Male | Female |
| 5 to 17 Years | 0 (0.0%) | 0 (0.0%) |
| 18 to 34 Years | 0 (0.0%) | 0 (0.0%) |
| 35 to 64 Years | 6 (15.0%) | 2 (8.3%) |
| 65 to 74 Years | 0 (0.0%) | 0 (0.0%) |
| 75 Years and over | 1 (100.0%) | 0 (0.0%) |
Disability Class: Self-Care Difficulty
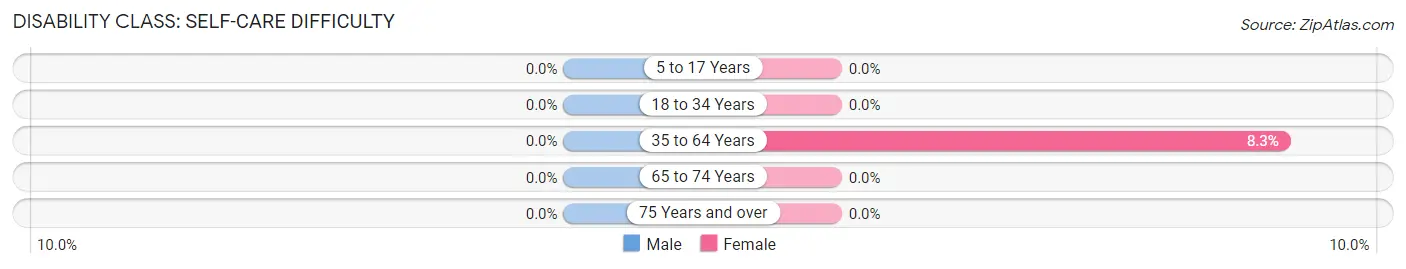
| Age Bracket | Male | Female |
| 5 to 17 Years | 0 (0.0%) | 0 (0.0%) |
| 18 to 34 Years | 0 (0.0%) | 0 (0.0%) |
| 35 to 64 Years | 0 (0.0%) | 2 (8.3%) |
| 65 to 74 Years | 0 (0.0%) | 0 (0.0%) |
| 75 Years and over | 0 (0.0%) | 0 (0.0%) |
Technology Access in Fort Yates
Computing Device Access in Fort Yates
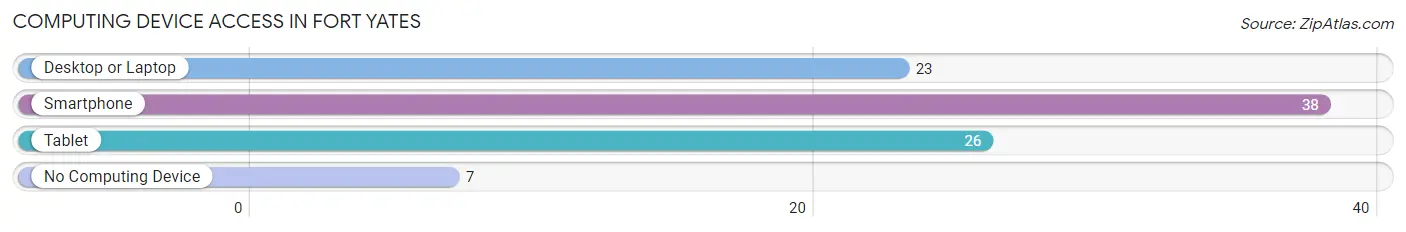
| Device Type | # Households | % Households |
| Desktop or Laptop | 23 | 48.9% |
| Smartphone | 38 | 80.8% |
| Tablet | 26 | 55.3% |
| No Computing Device | 7 | 14.9% |
| Total | 47 | 100.0% |
Internet Access in Fort Yates
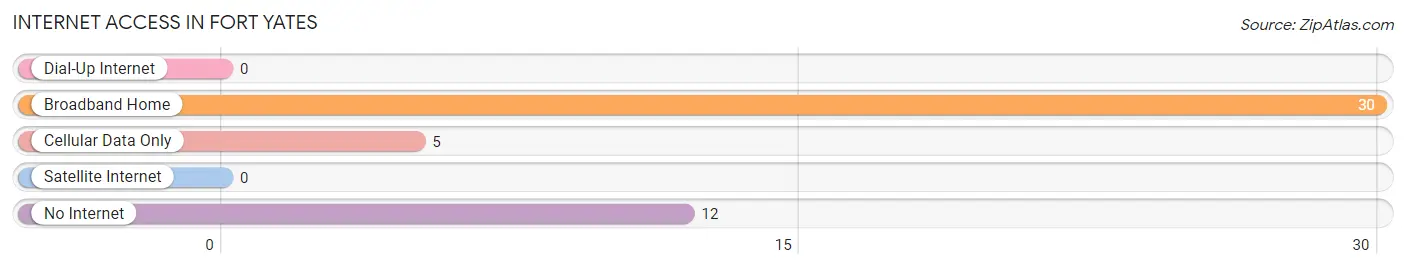
| Internet Type | # Households | % Households |
| Dial-Up Internet | 0 | 0.0% |
| Broadband Home | 30 | 63.8% |
| Cellular Data Only | 5 | 10.6% |
| Satellite Internet | 0 | 0.0% |
| No Internet | 12 | 25.5% |
| Total | 47 | 100.0% |
Fort Yates Summary
Ft. Yates is a small city located in Sioux County, North Dakota, United States. It is the county seat of Sioux County and is located on the Standing Rock Indian Reservation. The population of Ft. Yates was 1,053 at the 2010 census.
History
Ft. Yates was originally established in 1875 as a military post by the United States Army. The post was named after General George Yates, who was a veteran of the Civil War. The post was used to protect the Standing Rock Indian Reservation from hostile Sioux Indians. The post was abandoned in 1890 and the buildings were sold to the Standing Rock Agency.
In 1891, the Standing Rock Agency established a school at the post. The school was later renamed the Sitting Bull College in honor of the famous Sioux leader. The college is still in operation today and is the only tribal college in North Dakota.
In the early 1900s, the town of Ft. Yates was established. The town was named after the military post and was incorporated in 1910. The town grew slowly but steadily over the years and by the 2010 census, the population had grown to 1,053.
Geography
Ft. Yates is located in Sioux County, North Dakota, United States. It is situated on the Standing Rock Indian Reservation. The city is located at the intersection of U.S. Route 18 and North Dakota Highway 24.
The city has a total area of 0.9 square miles, all of which is land. The city is located at an elevation of 1,845 feet above sea level.
Economy
The economy of Ft. Yates is largely based on agriculture and tourism. The city is home to the Sitting Bull College, which is the only tribal college in North Dakota. The college provides educational opportunities to the local community and is a major employer in the city.
The city is also home to several small businesses, including restaurants, convenience stores, and gas stations. The city is also home to a number of tourist attractions, including the Sitting Bull Memorial and the Sitting Bull Monument.
Demographics
As of the 2010 census, there were 1,053 people, 431 households, and 250 families residing in the city. The population density was 1,154.7 people per square mile. The racial makeup of the city was 79.2% Native American, 16.2% White, 0.2% African American, 0.2% Asian, 0.1% Pacific Islander, 0.1% from other races, and 4.1% from two or more races.
The median income for a household in the city was $25,000 and the median income for a family was $30,000. The per capita income for the city was $13,000. About 24.2% of the population was below the poverty line.
Common Questions
What is Per Capita Income in Fort Yates?
Per Capita income in Fort Yates is $23,319.
What is the Median Family Income in Fort Yates?
Median Family Income in Fort Yates is $73,438.
What is the Median Household income in Fort Yates?
Median Household Income in Fort Yates is $72,813.
What is Income or Wage Gap in Fort Yates?
Income or Wage Gap in Fort Yates is 1.1%.
Women in Fort Yates earn 98.9 cents for every dollar earned by a man.
What is Inequality or Gini Index in Fort Yates?
Inequality or Gini Index in Fort Yates is 0.40.
What is the Total Population of Fort Yates?
Total Population of Fort Yates is 144.
What is the Total Male Population of Fort Yates?
Total Male Population of Fort Yates is 88.
What is the Total Female Population of Fort Yates?
Total Female Population of Fort Yates is 56.
What is the Ratio of Males per 100 Females in Fort Yates?
There are 157.14 Males per 100 Females in Fort Yates.
What is the Ratio of Females per 100 Males in Fort Yates?
There are 63.64 Females per 100 Males in Fort Yates.
What is the Median Population Age in Fort Yates?
Median Population Age in Fort Yates is 36.5 Years.
What is the Average Family Size in Fort Yates
Average Family Size in Fort Yates is 3.8 People.
What is the Average Household Size in Fort Yates
Average Household Size in Fort Yates is 3.1 People.
How Large is the Labor Force in Fort Yates?
There are 51 People in the Labor Forcein in Fort Yates.
What is the Percentage of People in the Labor Force in Fort Yates?
47.2% of People are in the Labor Force in Fort Yates.
What is the Unemployment Rate in Fort Yates?
Unemployment Rate in Fort Yates is 11.8%.