The Silos, MT Map & Demographics
The Silos Map
The Silos Overview
$44,520
PER CAPITA INCOME
$54,844
AVG HOUSEHOLD INCOME
0.33
INEQUALITY / GINI INDEX
474
TOTAL POPULATION
218
MALE POPULATION
256
FEMALE POPULATION
85.16
MALES / 100 FEMALES
117.43
FEMALES / 100 MALES
68.3
MEDIAN AGE
2.1
AVG FAMILY SIZE
2.0
AVG HOUSEHOLD SIZE
213
LABOR FORCE [ PEOPLE ]
45.3%
PERCENT IN LABOR FORCE
Income in The Silos
Income Overview in The Silos
| Characteristic | Number | Measure |
| Per Capita Income | 474 | $44,520 |
| Median Family Income | 214 | $0 |
| Mean Family Income | 214 | $88,741 |
| Median Household Income | 233 | $54,844 |
| Mean Household Income | 233 | $85,269 |
| Income Deficit | 214 | $0 |
| Wage / Income Gap (%) | 474 | 0.00% |
| Wage / Income Gap ($) | 474 | 100.00¢ per $1 |
| Gini / Inequality Index | 474 | 0.33 |
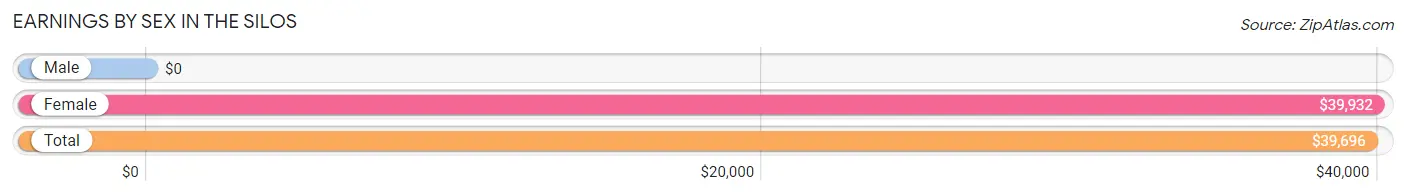
Earnings by Sex in The Silos
| Sex | Number | Average Earnings |
| Male | 115 (54.0%) | $0 |
| Female | 98 (46.0%) | $39,932 |
| Total | 213 (100.0%) | $39,696 |
Earnings by Sex by Income Bracket in The Silos
The most common earnings brackets in The Silos are $100,000+ for men (54 | 47.0%) and $35,000 to $39,999 for women (37 | 37.8%).
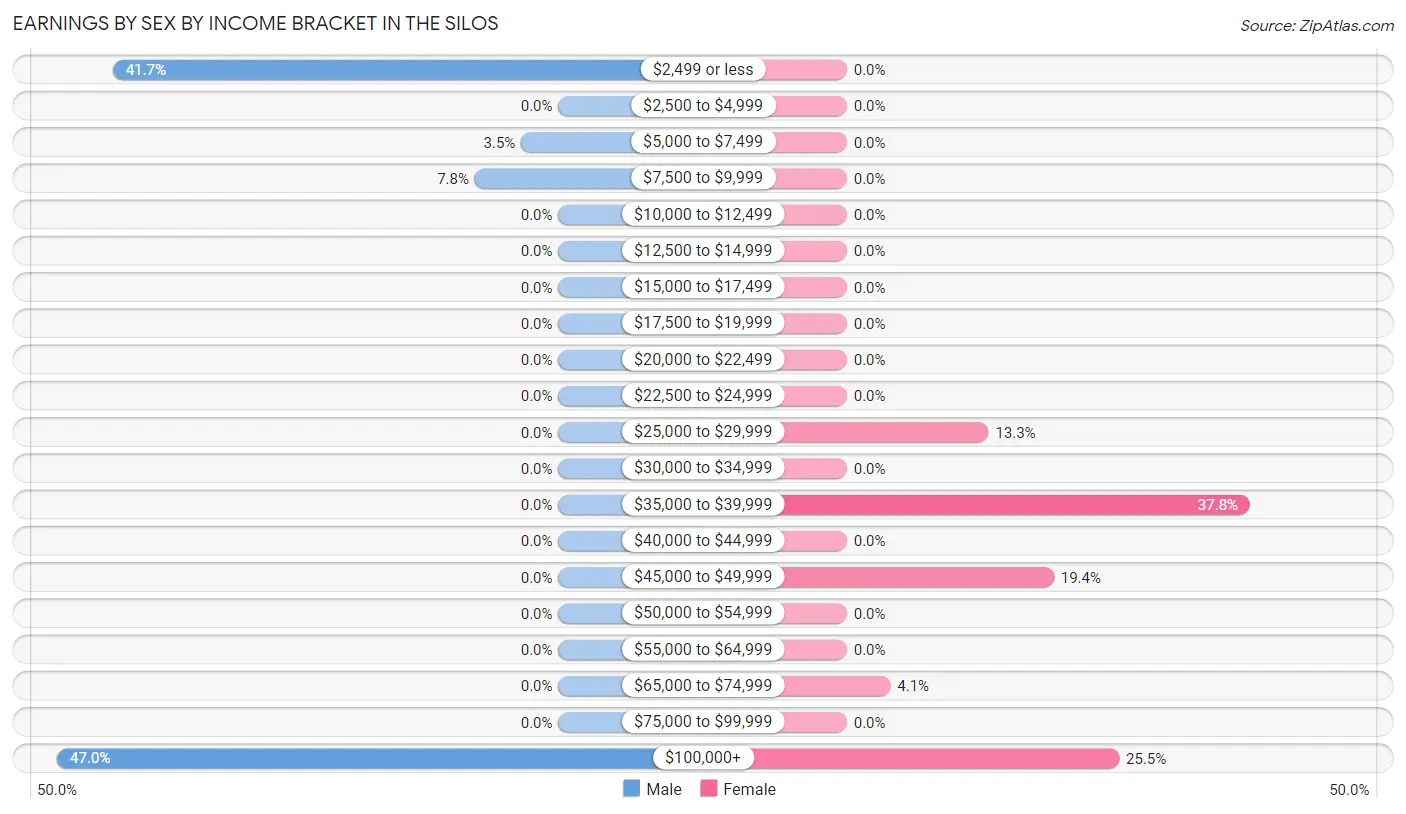
| Income | Male | Female |
| $2,499 or less | 48 (41.7%) | 0 (0.0%) |
| $2,500 to $4,999 | 0 (0.0%) | 0 (0.0%) |
| $5,000 to $7,499 | 4 (3.5%) | 0 (0.0%) |
| $7,500 to $9,999 | 9 (7.8%) | 0 (0.0%) |
| $10,000 to $12,499 | 0 (0.0%) | 0 (0.0%) |
| $12,500 to $14,999 | 0 (0.0%) | 0 (0.0%) |
| $15,000 to $17,499 | 0 (0.0%) | 0 (0.0%) |
| $17,500 to $19,999 | 0 (0.0%) | 0 (0.0%) |
| $20,000 to $22,499 | 0 (0.0%) | 0 (0.0%) |
| $22,500 to $24,999 | 0 (0.0%) | 0 (0.0%) |
| $25,000 to $29,999 | 0 (0.0%) | 13 (13.3%) |
| $30,000 to $34,999 | 0 (0.0%) | 0 (0.0%) |
| $35,000 to $39,999 | 0 (0.0%) | 37 (37.8%) |
| $40,000 to $44,999 | 0 (0.0%) | 0 (0.0%) |
| $45,000 to $49,999 | 0 (0.0%) | 19 (19.4%) |
| $50,000 to $54,999 | 0 (0.0%) | 0 (0.0%) |
| $55,000 to $64,999 | 0 (0.0%) | 0 (0.0%) |
| $65,000 to $74,999 | 0 (0.0%) | 4 (4.1%) |
| $75,000 to $99,999 | 0 (0.0%) | 0 (0.0%) |
| $100,000+ | 54 (47.0%) | 25 (25.5%) |
| Total | 115 (100.0%) | 98 (100.0%) |
Earnings by Sex by Educational Attainment in The Silos
| Educational Attainment | Male Income | Female Income |
| Less than High School | - | - |
| High School Diploma | - | - |
| College or Associate's Degree | - | - |
| Bachelor's Degree | - | - |
| Graduate Degree | - | - |
| Total | - | - |
Family Income in The Silos
Family Income Brackets in The Silos
According to the The Silos family income data, there are 90 families falling into the $50,000 to $74,999 income range, which is the most common income bracket and makes up 42.1% of all families.
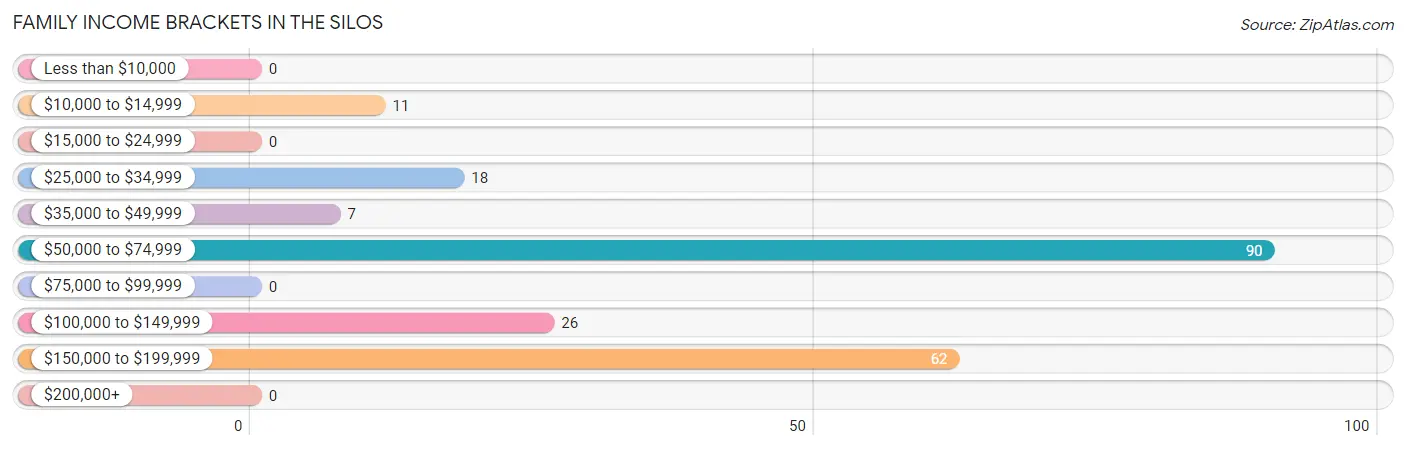
| Income Bracket | # Families | % Families |
| Less than $10,000 | 0 | 0.0% |
| $10,000 to $14,999 | 11 | 5.1% |
| $15,000 to $24,999 | 0 | 0.0% |
| $25,000 to $34,999 | 18 | 8.4% |
| $35,000 to $49,999 | 7 | 3.3% |
| $50,000 to $74,999 | 90 | 42.1% |
| $75,000 to $99,999 | 0 | 0.0% |
| $100,000 to $149,999 | 26 | 12.1% |
| $150,000 to $199,999 | 62 | 29.0% |
| $200,000+ | 0 | 0.0% |
Family Income by Famaliy Size in The Silos
| Income Bracket | # Families | Median Income |
| 2-Person Families | 204 (95.3%) | $0 |
| 3-Person Families | 0 (0.0%) | $0 |
| 4-Person Families | 7 (3.3%) | $0 |
| 5-Person Families | 3 (1.4%) | $0 |
| 6-Person Families | 0 (0.0%) | $0 |
| 7+ Person Families | 0 (0.0%) | $0 |
| Total | 214 (100.0%) | $0 |
Family Income by Number of Earners in The Silos
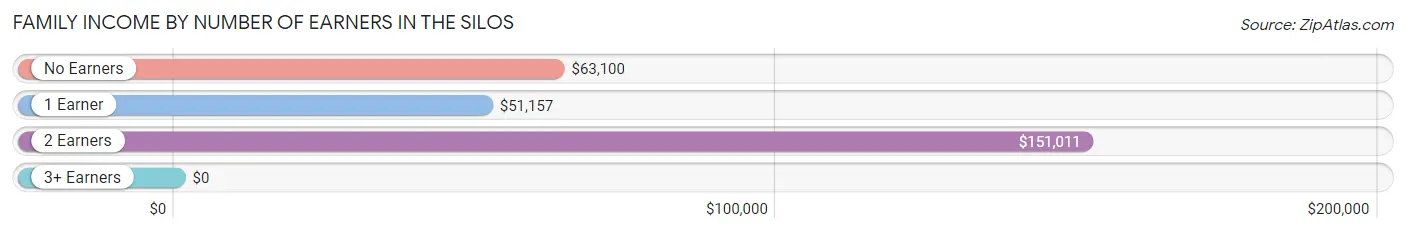
| Number of Earners | # Families | Median Income |
| No Earners | 86 (40.2%) | $63,100 |
| 1 Earner | 64 (29.9%) | $51,157 |
| 2 Earners | 64 (29.9%) | $151,011 |
| 3+ Earners | 0 (0.0%) | $0 |
| Total | 214 (100.0%) | $0 |
Household Income in The Silos
Household Income Brackets in The Silos
With 90 households falling in the category, the $50,000 to $74,999 income range is the most frequent in The Silos, accounting for 38.6% of all households.
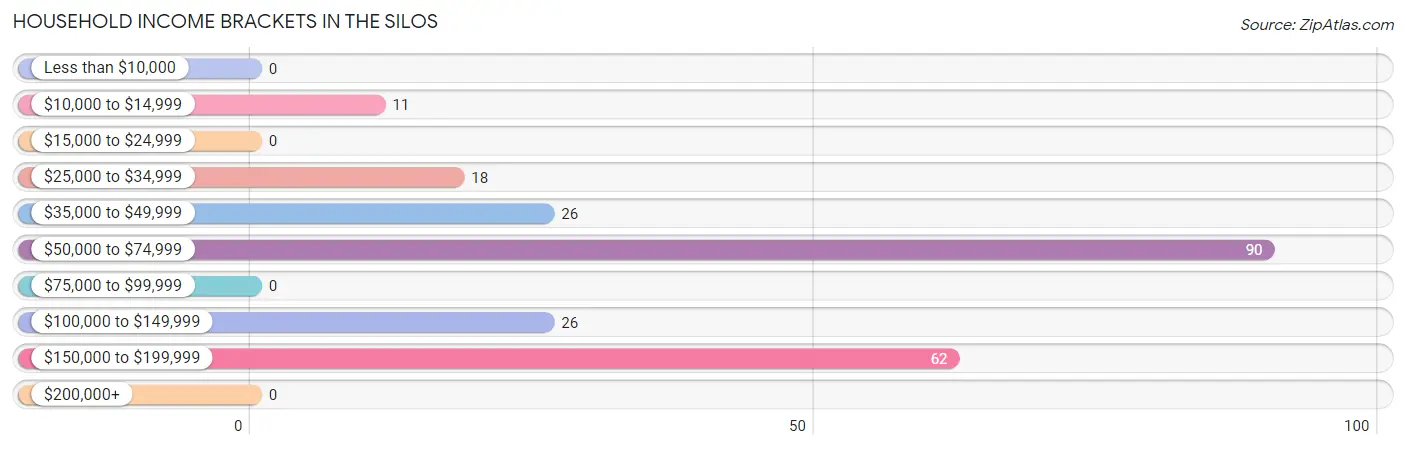
| Income Bracket | # Households | % Households |
| Less than $10,000 | 0 | 0.0% |
| $10,000 to $14,999 | 11 | 4.7% |
| $15,000 to $24,999 | 0 | 0.0% |
| $25,000 to $34,999 | 18 | 7.7% |
| $35,000 to $49,999 | 26 | 11.2% |
| $50,000 to $74,999 | 90 | 38.6% |
| $75,000 to $99,999 | 0 | 0.0% |
| $100,000 to $149,999 | 26 | 11.2% |
| $150,000 to $199,999 | 62 | 26.6% |
| $200,000+ | 0 | 0.0% |
Household Income by Householder Age in The Silos
The median household income in The Silos is $54,844, with the highest median household income of $150,346 found in the 45 to 64 years age bracket for the primary householder. A total of 89 households (38.2%) fall into this category. Meanwhile, the 15 to 24 years age bracket for the primary householder has the lowest median household income of $0, with 19 households (8.2%) in this group.
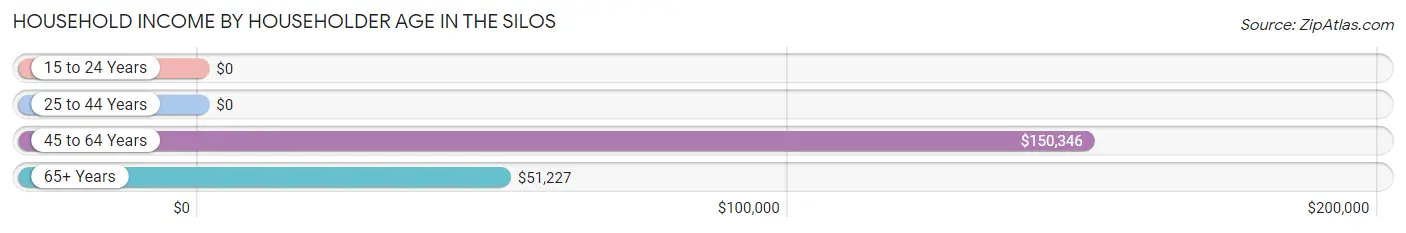
| Income Bracket | # Households | Median Income |
| 15 to 24 Years | 19 (8.2%) | $0 |
| 25 to 44 Years | 0 (0.0%) | $0 |
| 45 to 64 Years | 89 (38.2%) | $150,346 |
| 65+ Years | 125 (53.6%) | $51,227 |
| Total | 233 (100.0%) | $54,844 |
Poverty in The Silos
Income Below Poverty by Sex and Age in The Silos
With 4.6% poverty level for males and 4.3% for females among the residents of The Silos, 65 to 74 year old males and 65 to 74 year old females are the most vulnerable to poverty, with 10 males (24.4%) and 11 females (24.4%) in their respective age groups living below the poverty level.
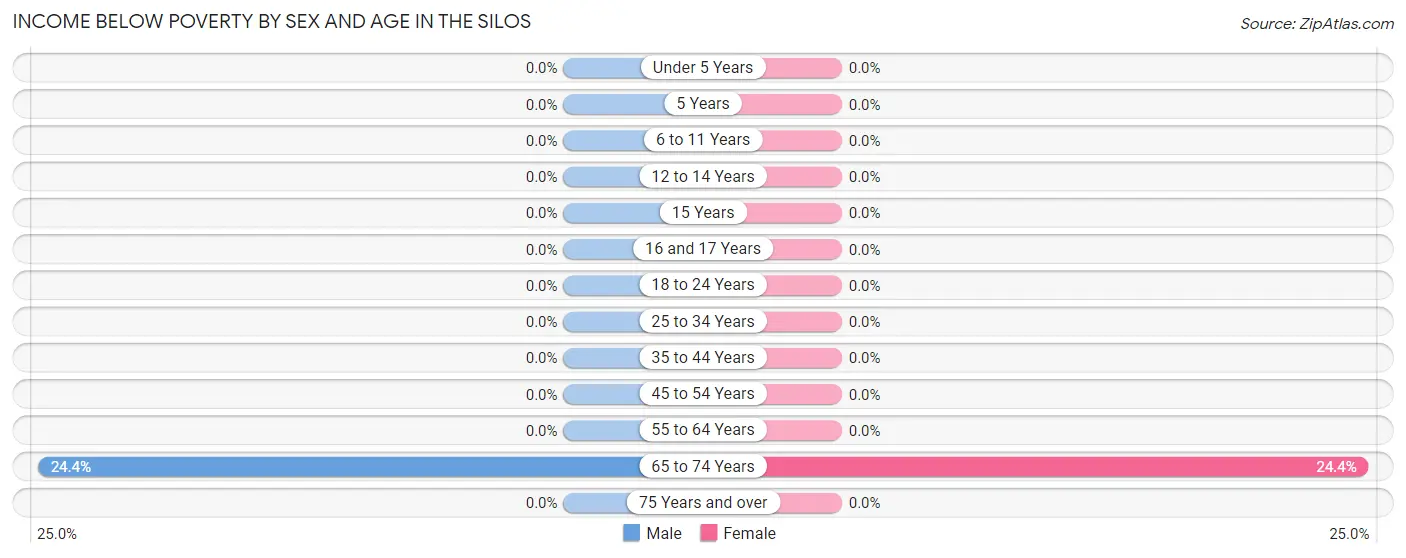
| Age Bracket | Male | Female |
| Under 5 Years | 0 (0.0%) | 0 (0.0%) |
| 5 Years | 0 (0.0%) | 0 (0.0%) |
| 6 to 11 Years | 0 (0.0%) | 0 (0.0%) |
| 12 to 14 Years | 0 (0.0%) | 0 (0.0%) |
| 15 Years | 0 (0.0%) | 0 (0.0%) |
| 16 and 17 Years | 0 (0.0%) | 0 (0.0%) |
| 18 to 24 Years | 0 (0.0%) | 0 (0.0%) |
| 25 to 34 Years | 0 (0.0%) | 0 (0.0%) |
| 35 to 44 Years | 0 (0.0%) | 0 (0.0%) |
| 45 to 54 Years | 0 (0.0%) | 0 (0.0%) |
| 55 to 64 Years | 0 (0.0%) | 0 (0.0%) |
| 65 to 74 Years | 10 (24.4%) | 11 (24.4%) |
| 75 Years and over | 0 (0.0%) | 0 (0.0%) |
| Total | 10 (4.6%) | 11 (4.3%) |
Income Above Poverty by Sex and Age in The Silos
According to the poverty statistics in The Silos, males aged 12 to 14 years and females aged 15 years are the age groups that are most secure financially, with 100.0% of males and 100.0% of females in these age groups living above the poverty line.
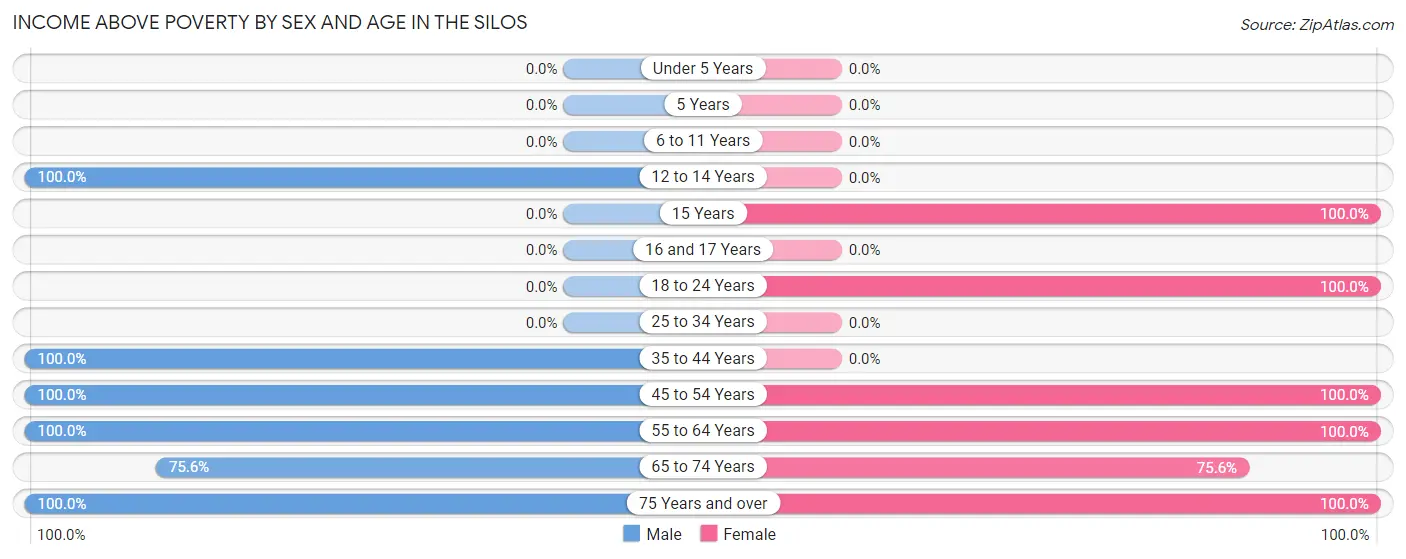
| Age Bracket | Male | Female |
| Under 5 Years | 0 (0.0%) | 0 (0.0%) |
| 5 Years | 0 (0.0%) | 0 (0.0%) |
| 6 to 11 Years | 0 (0.0%) | 0 (0.0%) |
| 12 to 14 Years | 2 (100.0%) | 0 (0.0%) |
| 15 Years | 0 (0.0%) | 2 (100.0%) |
| 16 and 17 Years | 0 (0.0%) | 0 (0.0%) |
| 18 to 24 Years | 0 (0.0%) | 32 (100.0%) |
| 25 to 34 Years | 0 (0.0%) | 0 (0.0%) |
| 35 to 44 Years | 4 (100.0%) | 0 (0.0%) |
| 45 to 54 Years | 54 (100.0%) | 41 (100.0%) |
| 55 to 64 Years | 48 (100.0%) | 50 (100.0%) |
| 65 to 74 Years | 31 (75.6%) | 34 (75.6%) |
| 75 Years and over | 69 (100.0%) | 86 (100.0%) |
| Total | 208 (95.4%) | 245 (95.7%) |
Income Below Poverty Among Married-Couple Families in The Silos
The poverty statistics for married-couple families in The Silos show that 5.1% or 11 of the total 214 families live below the poverty line. Families with no children have the highest poverty rate of 5.2%, comprising of 11 families. On the other hand, families with 1 or 2 children have the lowest poverty rate of 0.0%, which includes 0 families.
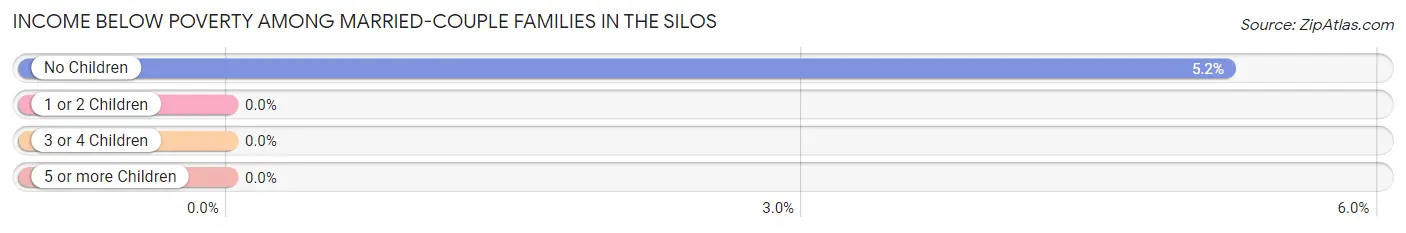
| Children | Above Poverty | Below Poverty |
| No Children | 200 (94.8%) | 11 (5.2%) |
| 1 or 2 Children | 3 (100.0%) | 0 (0.0%) |
| 3 or 4 Children | 0 (0.0%) | 0 (0.0%) |
| 5 or more Children | 0 (0.0%) | 0 (0.0%) |
| Total | 203 (94.9%) | 11 (5.1%) |
Income Below Poverty Among Single-Parent Households in The Silos
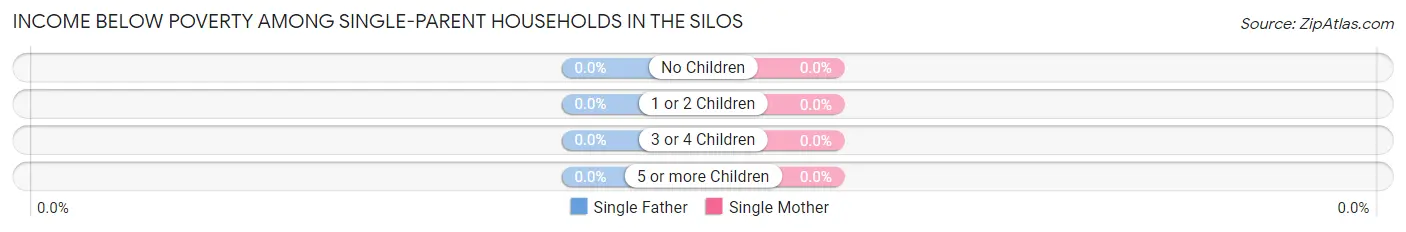
| Children | Single Father | Single Mother |
| No Children | 0 (0.0%) | 0 (0.0%) |
| 1 or 2 Children | 0 (0.0%) | 0 (0.0%) |
| 3 or 4 Children | 0 (0.0%) | 0 (0.0%) |
| 5 or more Children | 0 (0.0%) | 0 (0.0%) |
| Total | 0 (0.0%) | 0 (0.0%) |
Income Below Poverty Among Married-Couple vs Single-Parent Households in The Silos
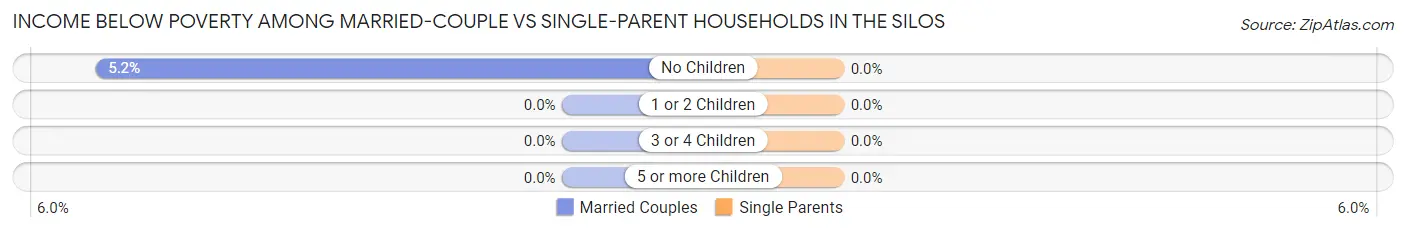
| Children | Married-Couple Families | Single-Parent Households |
| No Children | 11 (5.2%) | 0 (0.0%) |
| 1 or 2 Children | 0 (0.0%) | 0 (0.0%) |
| 3 or 4 Children | 0 (0.0%) | 0 (0.0%) |
| 5 or more Children | 0 (0.0%) | 0 (0.0%) |
| Total | 11 (5.1%) | 0 (0.0%) |
Race in The Silos
The most populous races in The Silos are White / Caucasian (437 | 92.2%), Two or more Races (21 | 4.4%), and Black / African American (16 | 3.4%).
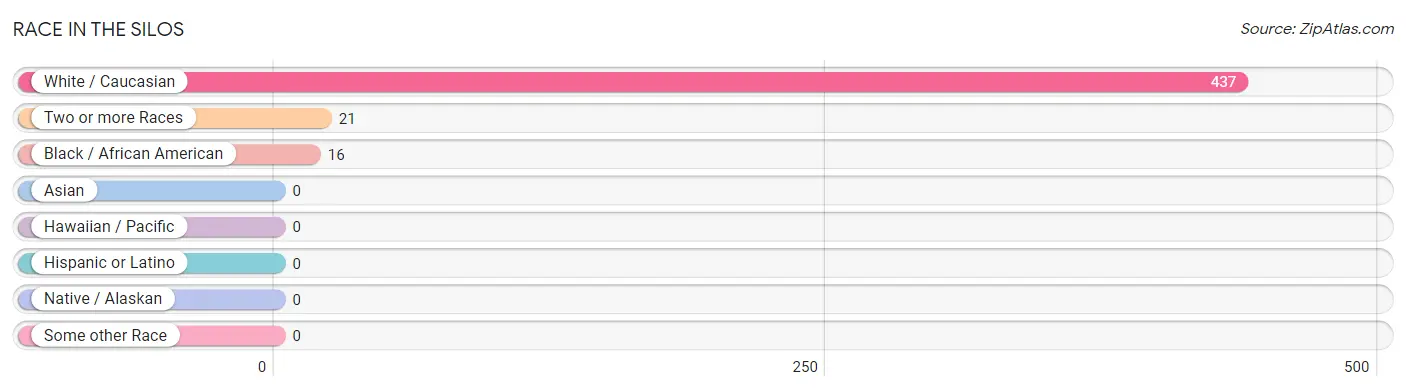
| Race | # Population | % Population |
| Asian | 0 | 0.0% |
| Black / African American | 16 | 3.4% |
| Hawaiian / Pacific | 0 | 0.0% |
| Hispanic or Latino | 0 | 0.0% |
| Native / Alaskan | 0 | 0.0% |
| White / Caucasian | 437 | 92.2% |
| Two or more Races | 21 | 4.4% |
| Some other Race | 0 | 0.0% |
| Total | 474 | 100.0% |
Ancestry in The Silos
The most populous ancestries reported in The Silos are German (200 | 42.2%), Irish (135 | 28.5%), Norwegian (125 | 26.4%), English (75 | 15.8%), and Swiss (44 | 9.3%), together accounting for 122.1% of all The Silos residents.
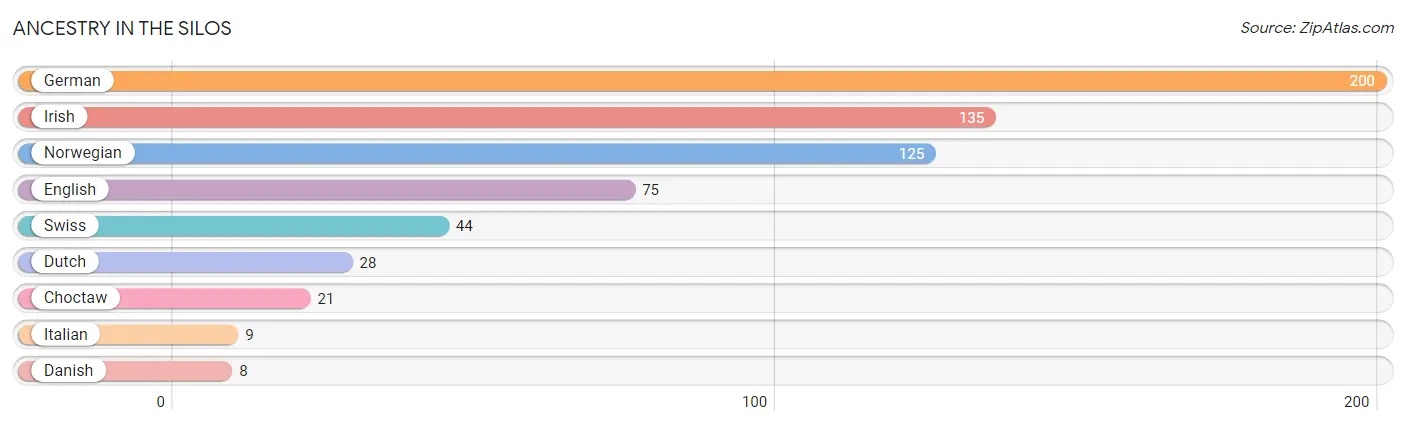
| Ancestry | # Population | % Population |
| Choctaw | 21 | 4.4% |
| Danish | 8 | 1.7% |
| Dutch | 28 | 5.9% |
| English | 75 | 15.8% |
| German | 200 | 42.2% |
| Irish | 135 | 28.5% |
| Italian | 9 | 1.9% |
| Norwegian | 125 | 26.4% |
| Swiss | 44 | 9.3% | View All 9 Rows |
Immigrants in The Silos

| Immigration Origin | # Population | % Population | View All 0 Rows |
Sex and Age in The Silos
Sex and Age in The Silos
The most populous age groups in The Silos are 75 to 79 Years (62 | 28.4%) for men and 75 to 79 Years (77 | 30.1%) for women.
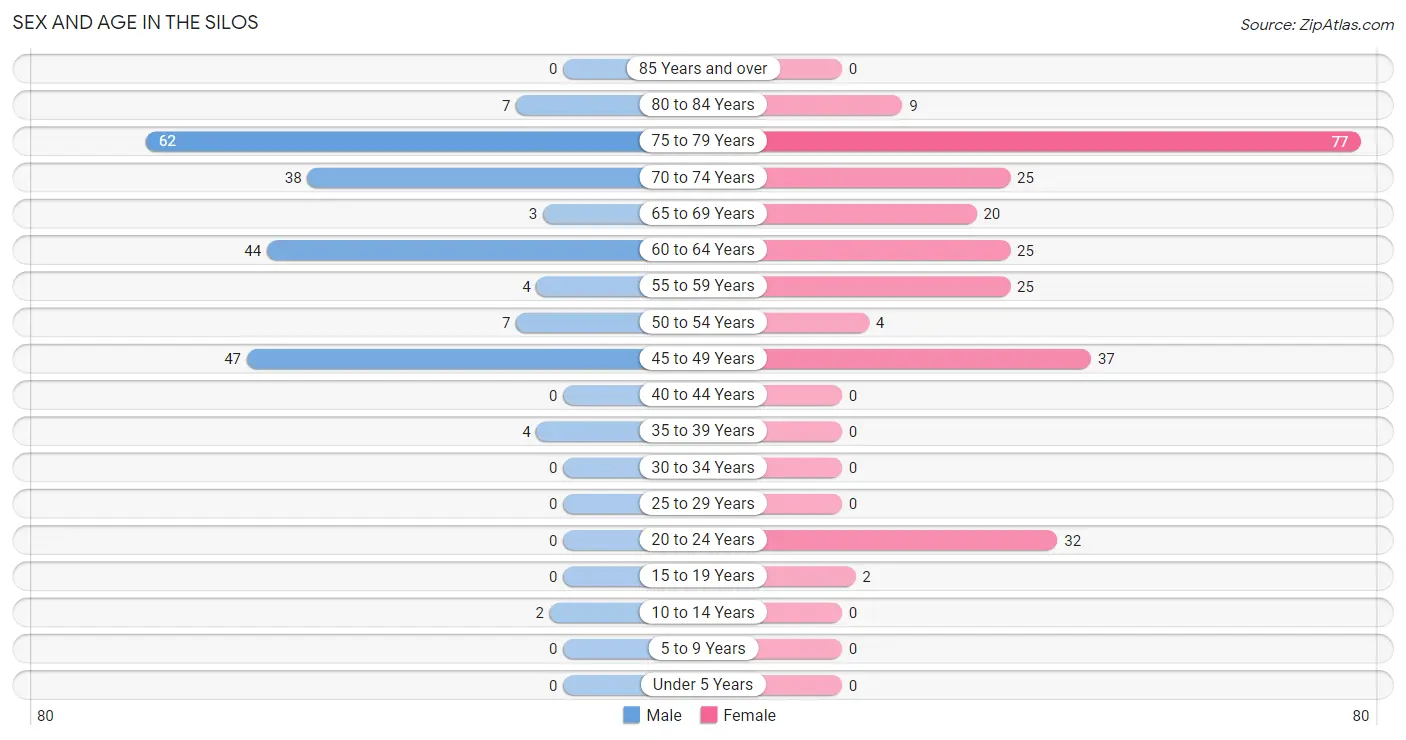
| Age Bracket | Male | Female |
| Under 5 Years | 0 (0.0%) | 0 (0.0%) |
| 5 to 9 Years | 0 (0.0%) | 0 (0.0%) |
| 10 to 14 Years | 2 (0.9%) | 0 (0.0%) |
| 15 to 19 Years | 0 (0.0%) | 2 (0.8%) |
| 20 to 24 Years | 0 (0.0%) | 32 (12.5%) |
| 25 to 29 Years | 0 (0.0%) | 0 (0.0%) |
| 30 to 34 Years | 0 (0.0%) | 0 (0.0%) |
| 35 to 39 Years | 4 (1.8%) | 0 (0.0%) |
| 40 to 44 Years | 0 (0.0%) | 0 (0.0%) |
| 45 to 49 Years | 47 (21.6%) | 37 (14.4%) |
| 50 to 54 Years | 7 (3.2%) | 4 (1.6%) |
| 55 to 59 Years | 4 (1.8%) | 25 (9.8%) |
| 60 to 64 Years | 44 (20.2%) | 25 (9.8%) |
| 65 to 69 Years | 3 (1.4%) | 20 (7.8%) |
| 70 to 74 Years | 38 (17.4%) | 25 (9.8%) |
| 75 to 79 Years | 62 (28.4%) | 77 (30.1%) |
| 80 to 84 Years | 7 (3.2%) | 9 (3.5%) |
| 85 Years and over | 0 (0.0%) | 0 (0.0%) |
| Total | 218 (100.0%) | 256 (100.0%) |
Families and Households in The Silos
Median Family Size in The Silos
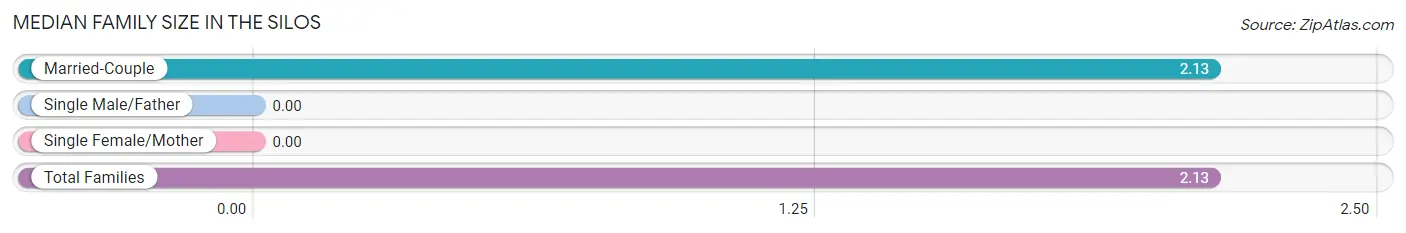
| Family Type | # Families | Family Size |
| Married-Couple | 214 (100.0%) | 2.13 |
| Single Male/Father | 0 (0.0%) | - |
| Single Female/Mother | 0 (0.0%) | - |
| Total Families | 214 (100.0%) | 2.13 |
Median Household Size in The Silos
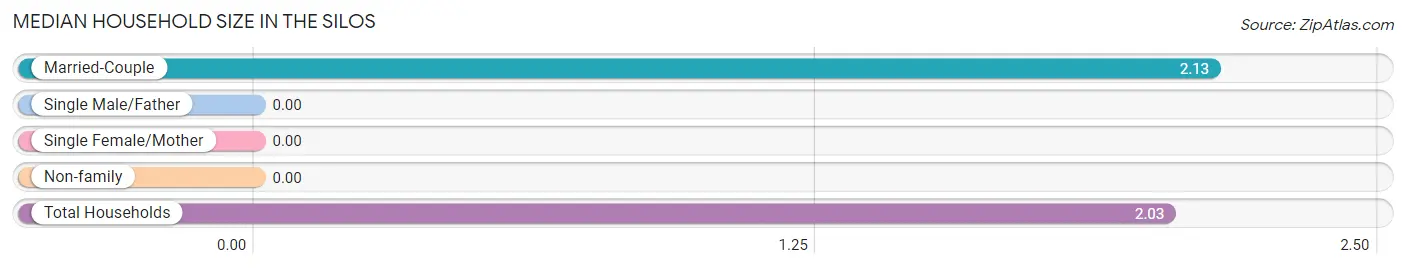
| Household Type | # Households | Household Size |
| Married-Couple | 214 (91.8%) | 2.13 |
| Single Male/Father | 0 (0.0%) | - |
| Single Female/Mother | 0 (0.0%) | - |
| Non-family | 19 (8.2%) | - |
| Total Households | 233 (100.0%) | 2.03 |
Household Size by Marriage Status in The Silos
Out of a total of 233 households in The Silos, 214 (91.8%) are family households, while 19 (8.2%) are nonfamily households. The most numerous type of family households are 2-person households, comprising 204, and the most common type of nonfamily households are 1-person households, comprising 19.
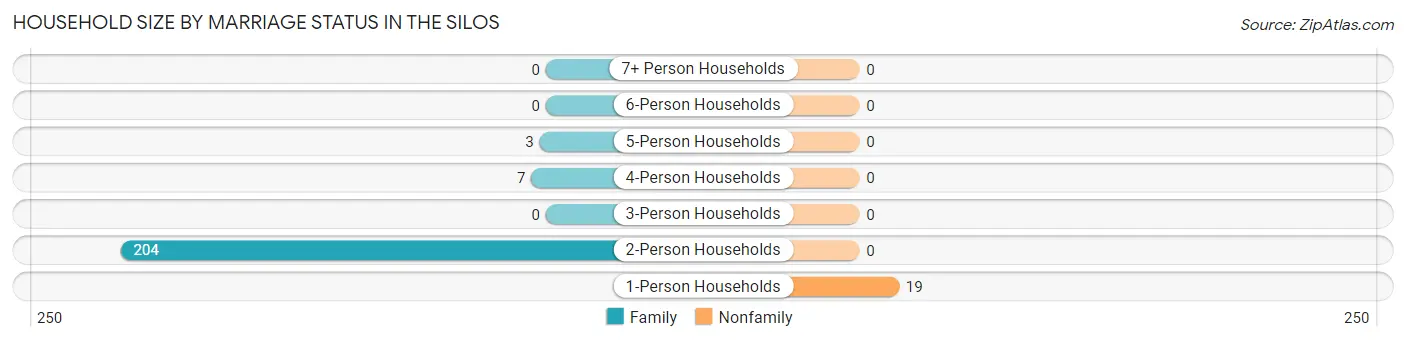
| Household Size | Family Households | Nonfamily Households |
| 1-Person Households | - | 19 (8.2%) |
| 2-Person Households | 204 (87.5%) | 0 (0.0%) |
| 3-Person Households | 0 (0.0%) | 0 (0.0%) |
| 4-Person Households | 7 (3.0%) | 0 (0.0%) |
| 5-Person Households | 3 (1.3%) | 0 (0.0%) |
| 6-Person Households | 0 (0.0%) | 0 (0.0%) |
| 7+ Person Households | 0 (0.0%) | 0 (0.0%) |
| Total | 214 (91.8%) | 19 (8.2%) |
Female Fertility in The Silos
Fertility by Age in The Silos
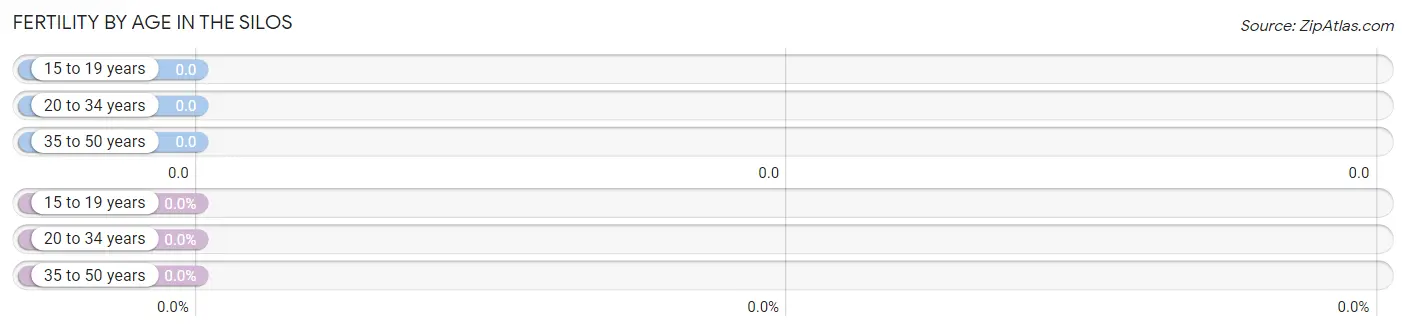
| Age Bracket | Women with Births | Births / 1,000 Women |
| 15 to 19 years | 0 (0.0%) | 0.0 |
| 20 to 34 years | 0 (0.0%) | 0.0 |
| 35 to 50 years | 0 (0.0%) | 0.0 |
| Total | 0 (0.0%) | 0.0 |
Fertility by Age by Marriage Status in The Silos
| Age Bracket | Married | Unmarried |
| 15 to 19 years | 0 (0.0%) | 0 (0.0%) |
| 20 to 34 years | 0 (0.0%) | 0 (0.0%) |
| 35 to 50 years | 0 (0.0%) | 0 (0.0%) |
| Total | 0 (0.0%) | 0 (0.0%) |
Fertility by Education in The Silos
| Educational Attainment | Women with Births | Births / 1,000 Women |
| Less than High School | 0 (0.0%) | 0.0 |
| High School Diploma | 0 (0.0%) | 0.0 |
| College or Associate's Degree | 0 (0.0%) | 0.0 |
| Bachelor's Degree | 0 (0.0%) | 0.0 |
| Graduate Degree | 0 (0.0%) | 0.0 |
| Total | 0 (0.0%) | 0.0 |
Fertility by Education by Marriage Status in The Silos
| Educational Attainment | Married | Unmarried |
| Less than High School | 0 (0.0%) | 0 (0.0%) |
| High School Diploma | 0 (0.0%) | 0 (0.0%) |
| College or Associate's Degree | 0 (0.0%) | 0 (0.0%) |
| Bachelor's Degree | 0 (0.0%) | 0 (0.0%) |
| Graduate Degree | 0 (0.0%) | 0 (0.0%) |
| Total | 0 (0.0%) | 0 (0.0%) |
Employment Characteristics in The Silos
Employment by Class of Employer in The Silos
Among the 213 employed individuals in The Silos, private company employees (112 | 52.6%), state government employees (44 | 20.7%), and local government employees (40 | 18.8%) make up the most common classes of employment.
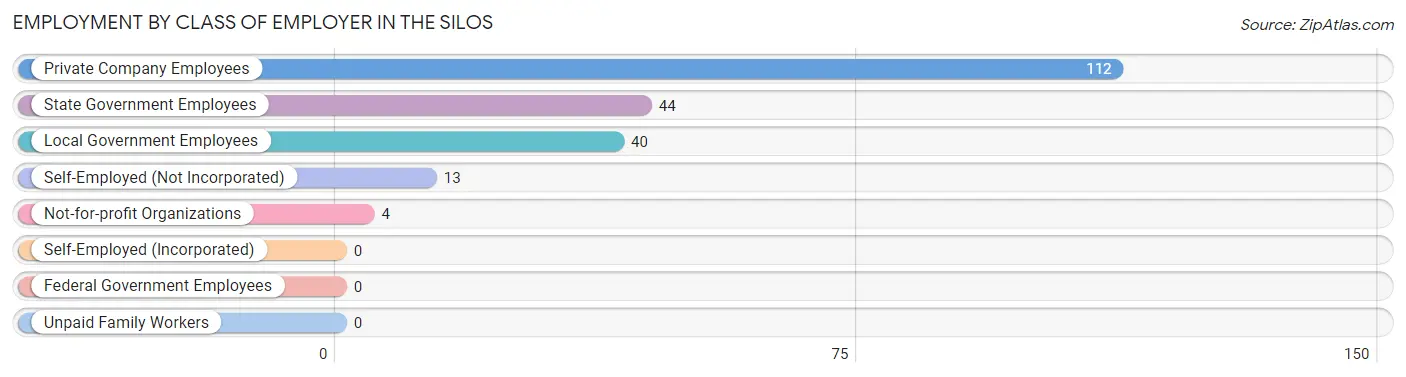
| Employer Class | # Employees | % Employees |
| Private Company Employees | 112 | 52.6% |
| Self-Employed (Incorporated) | 0 | 0.0% |
| Self-Employed (Not Incorporated) | 13 | 6.1% |
| Not-for-profit Organizations | 4 | 1.9% |
| Local Government Employees | 40 | 18.8% |
| State Government Employees | 44 | 20.7% |
| Federal Government Employees | 0 | 0.0% |
| Unpaid Family Workers | 0 | 0.0% |
| Total | 213 | 100.0% |
Employment Status by Age in The Silos
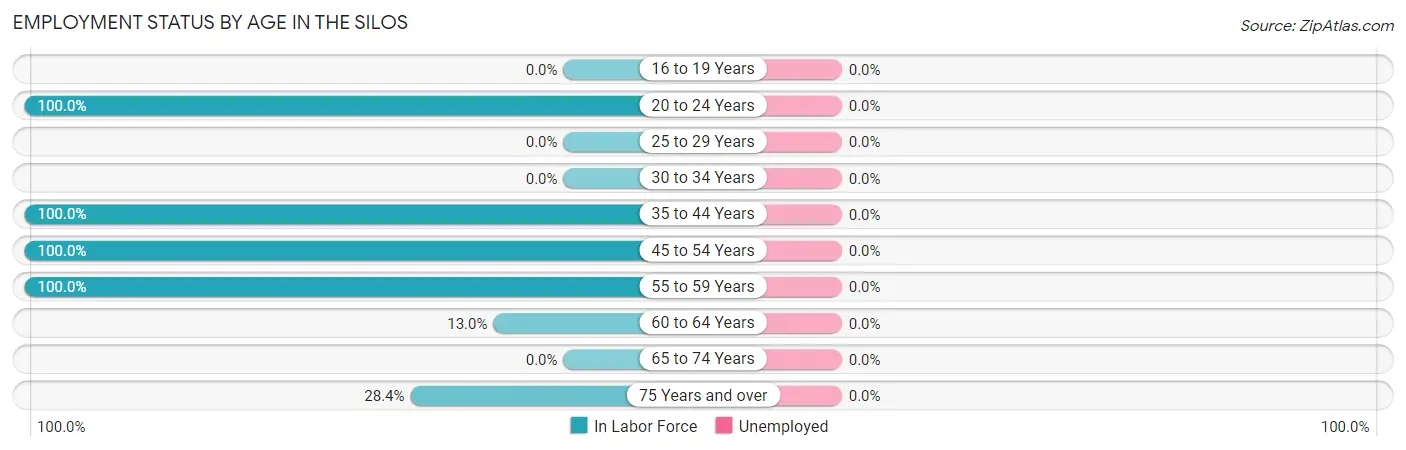
| Age Bracket | In Labor Force | Unemployed |
| 16 to 19 Years | 0 (0.0%) | 0 (0.0%) |
| 20 to 24 Years | 32 (100.0%) | 0 (0.0%) |
| 25 to 29 Years | 0 (0.0%) | 0 (0.0%) |
| 30 to 34 Years | 0 (0.0%) | 0 (0.0%) |
| 35 to 44 Years | 4 (100.0%) | 0 (0.0%) |
| 45 to 54 Years | 95 (100.0%) | 0 (0.0%) |
| 55 to 59 Years | 29 (100.0%) | 0 (0.0%) |
| 60 to 64 Years | 9 (13.0%) | 0 (0.0%) |
| 65 to 74 Years | 0 (0.0%) | 0 (0.0%) |
| 75 Years and over | 44 (28.4%) | 0 (0.0%) |
| Total | 213 (45.3%) | 0 (0.0%) |
Employment Status by Educational Attainment in The Silos
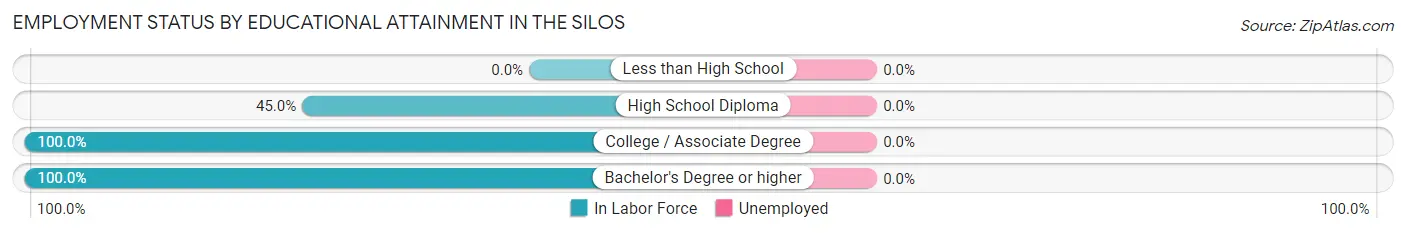
| Educational Attainment | In Labor Force | Unemployed |
| Less than High School | 0 (0.0%) | 0 (0.0%) |
| High School Diploma | 49 (45.0%) | 0 (0.0%) |
| College / Associate Degree | 51 (100.0%) | 0 (0.0%) |
| Bachelor's Degree or higher | 37 (100.0%) | 0 (0.0%) |
| Total | 137 (69.5%) | 0 (0.0%) |
Employment Occupations by Sex in The Silos
Management, Business, Science and Arts Occupations
The most common Management, Business, Science and Arts occupations in The Silos are Management (51 | 23.9%), Business & Financial (44 | 20.7%), Community & Social Service (19 | 8.9%), and Education Instruction & Library (19 | 8.9%).
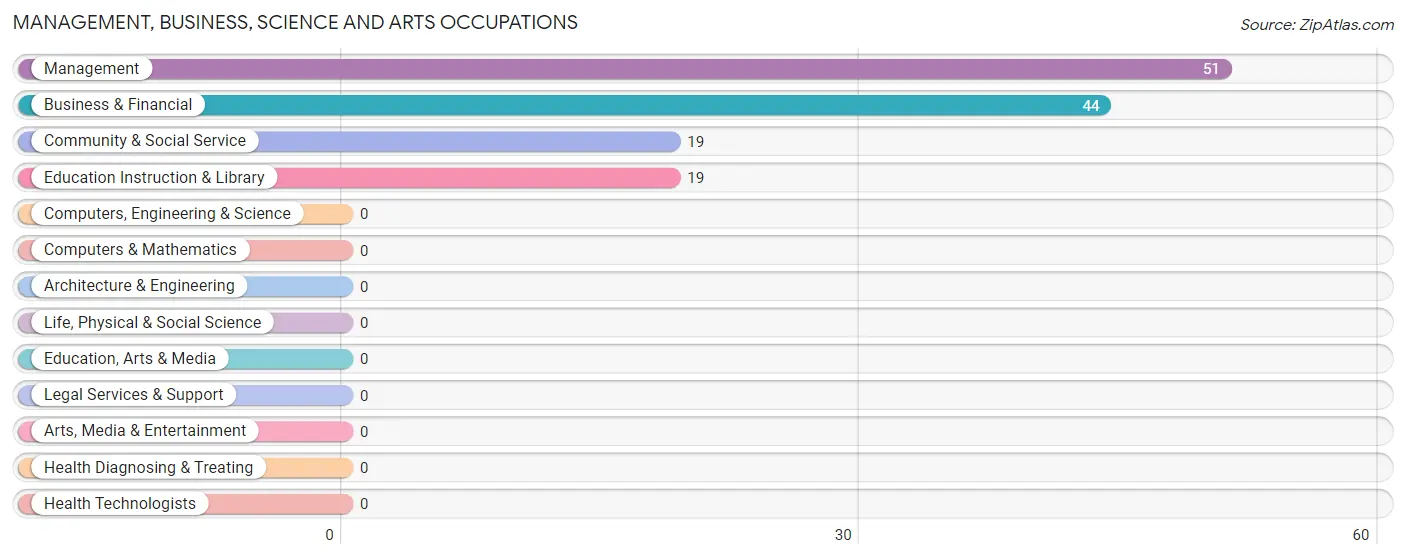
Management, Business, Science and Arts Occupations by Sex
Within the Management, Business, Science and Arts occupations in The Silos, the most male-oriented occupations are Management (100.0%), and Business & Financial (100.0%), while the most female-oriented occupations are Community & Social Service (100.0%), and Education Instruction & Library (100.0%).
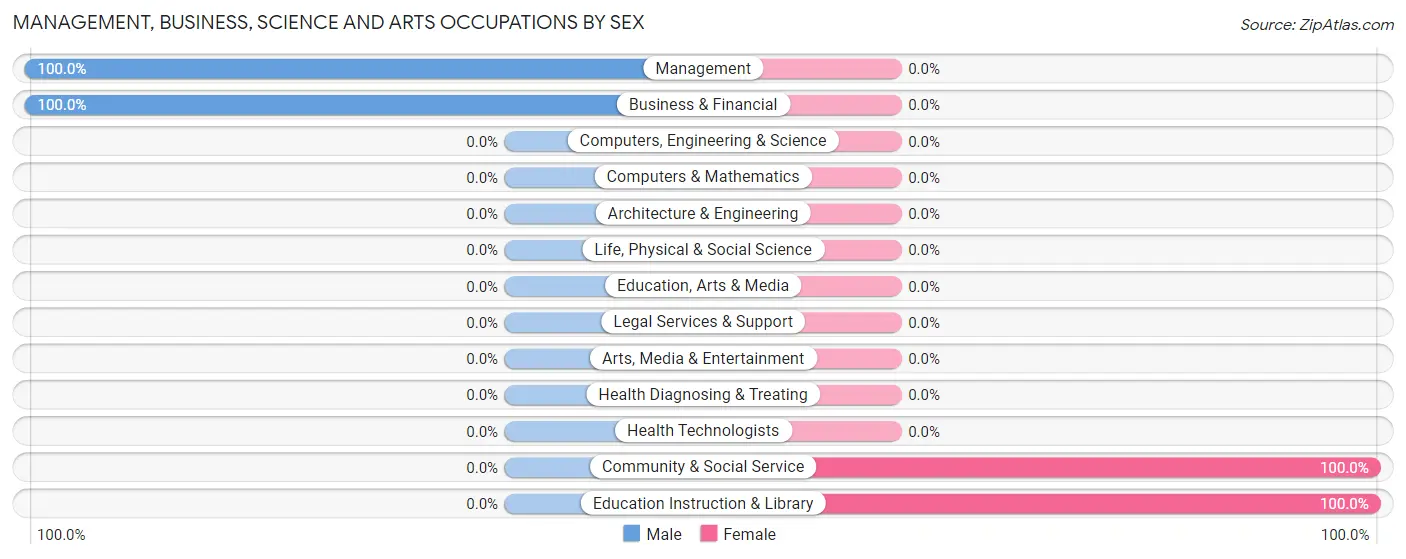
| Occupation | Male | Female |
| Management | 51 (100.0%) | 0 (0.0%) |
| Business & Financial | 44 (100.0%) | 0 (0.0%) |
| Computers, Engineering & Science | 0 (0.0%) | 0 (0.0%) |
| Computers & Mathematics | 0 (0.0%) | 0 (0.0%) |
| Architecture & Engineering | 0 (0.0%) | 0 (0.0%) |
| Life, Physical & Social Science | 0 (0.0%) | 0 (0.0%) |
| Community & Social Service | 0 (0.0%) | 19 (100.0%) |
| Education, Arts & Media | 0 (0.0%) | 0 (0.0%) |
| Legal Services & Support | 0 (0.0%) | 0 (0.0%) |
| Education Instruction & Library | 0 (0.0%) | 19 (100.0%) |
| Arts, Media & Entertainment | 0 (0.0%) | 0 (0.0%) |
| Health Diagnosing & Treating | 0 (0.0%) | 0 (0.0%) |
| Health Technologists | 0 (0.0%) | 0 (0.0%) |
| Total (Category) | 95 (83.3%) | 19 (16.7%) |
| Total (Overall) | 115 (54.0%) | 98 (46.0%) |
Services Occupations
Services Occupations by Sex
| Occupation | Male | Female |
| Healthcare Support | 0 (0.0%) | 0 (0.0%) |
| Security & Protection | 0 (0.0%) | 0 (0.0%) |
| Firefighting & Prevention | 0 (0.0%) | 0 (0.0%) |
| Law Enforcement | 0 (0.0%) | 0 (0.0%) |
| Food Preparation & Serving | 0 (0.0%) | 0 (0.0%) |
| Cleaning & Maintenance | 0 (0.0%) | 0 (0.0%) |
| Personal Care & Service | 0 (0.0%) | 0 (0.0%) |
| Total (Category) | 0 (0.0%) | 0 (0.0%) |
| Total (Overall) | 115 (54.0%) | 98 (46.0%) |
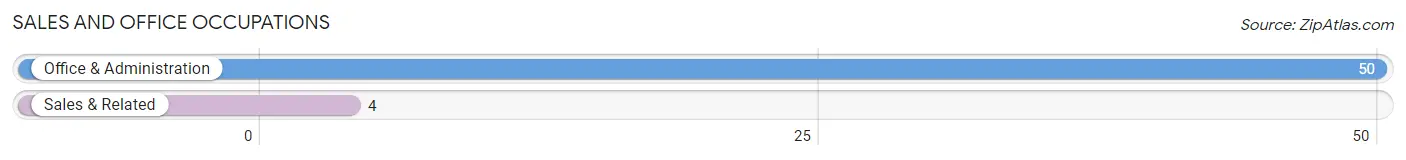
Sales and Office Occupations
The most common Sales and Office occupations in The Silos are Office & Administration (50 | 23.5%), and Sales & Related (4 | 1.9%).
Sales and Office Occupations by Sex
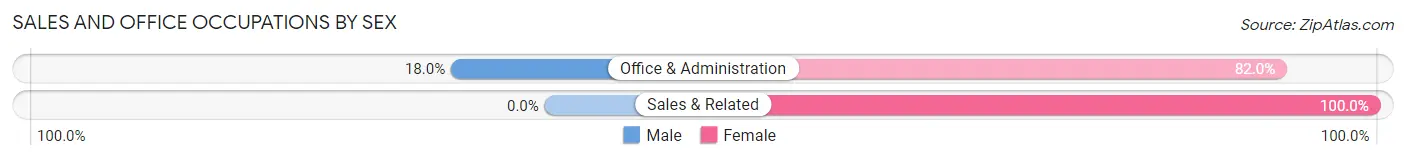
| Occupation | Male | Female |
| Sales & Related | 0 (0.0%) | 4 (100.0%) |
| Office & Administration | 9 (18.0%) | 41 (82.0%) |
| Total (Category) | 9 (16.7%) | 45 (83.3%) |
| Total (Overall) | 115 (54.0%) | 98 (46.0%) |
Natural Resources, Construction and Maintenance Occupations
The most common Natural Resources, Construction and Maintenance occupations in The Silos are , and Construction & Extraction (11 | 5.2%).
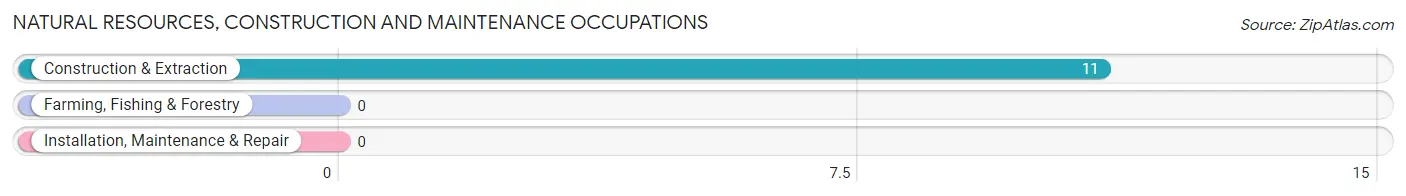
Natural Resources, Construction and Maintenance Occupations by Sex
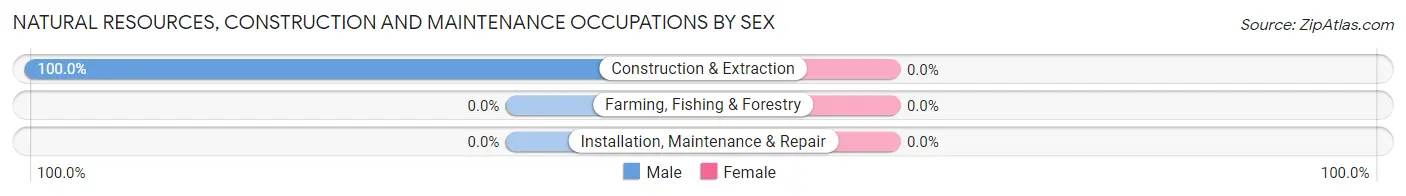
| Occupation | Male | Female |
| Farming, Fishing & Forestry | 0 (0.0%) | 0 (0.0%) |
| Construction & Extraction | 11 (100.0%) | 0 (0.0%) |
| Installation, Maintenance & Repair | 0 (0.0%) | 0 (0.0%) |
| Total (Category) | 11 (100.0%) | 0 (0.0%) |
| Total (Overall) | 115 (54.0%) | 98 (46.0%) |
Production, Transportation and Moving Occupations
The most common Production, Transportation and Moving occupations in The Silos are Production (21 | 9.9%), and Material Moving (13 | 6.1%).
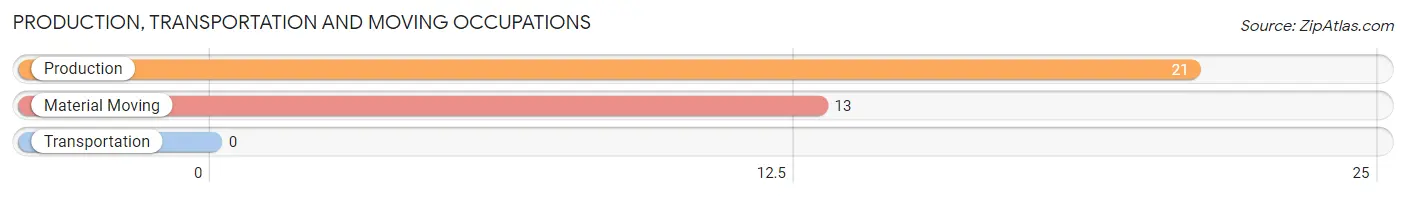
Production, Transportation and Moving Occupations by Sex
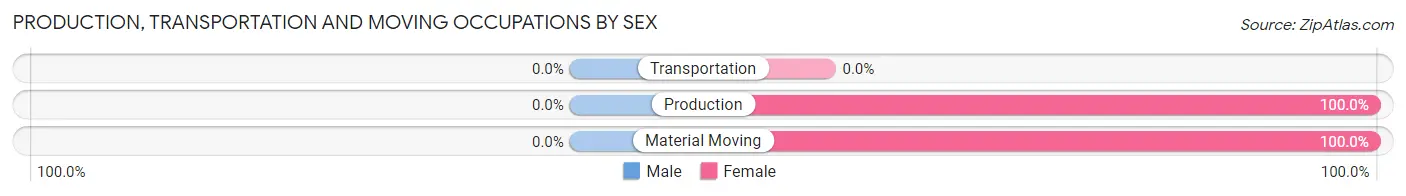
| Occupation | Male | Female |
| Production | 0 (0.0%) | 21 (100.0%) |
| Transportation | 0 (0.0%) | 0 (0.0%) |
| Material Moving | 0 (0.0%) | 13 (100.0%) |
| Total (Category) | 0 (0.0%) | 34 (100.0%) |
| Total (Overall) | 115 (54.0%) | 98 (46.0%) |
Employment Industries by Sex in The Silos
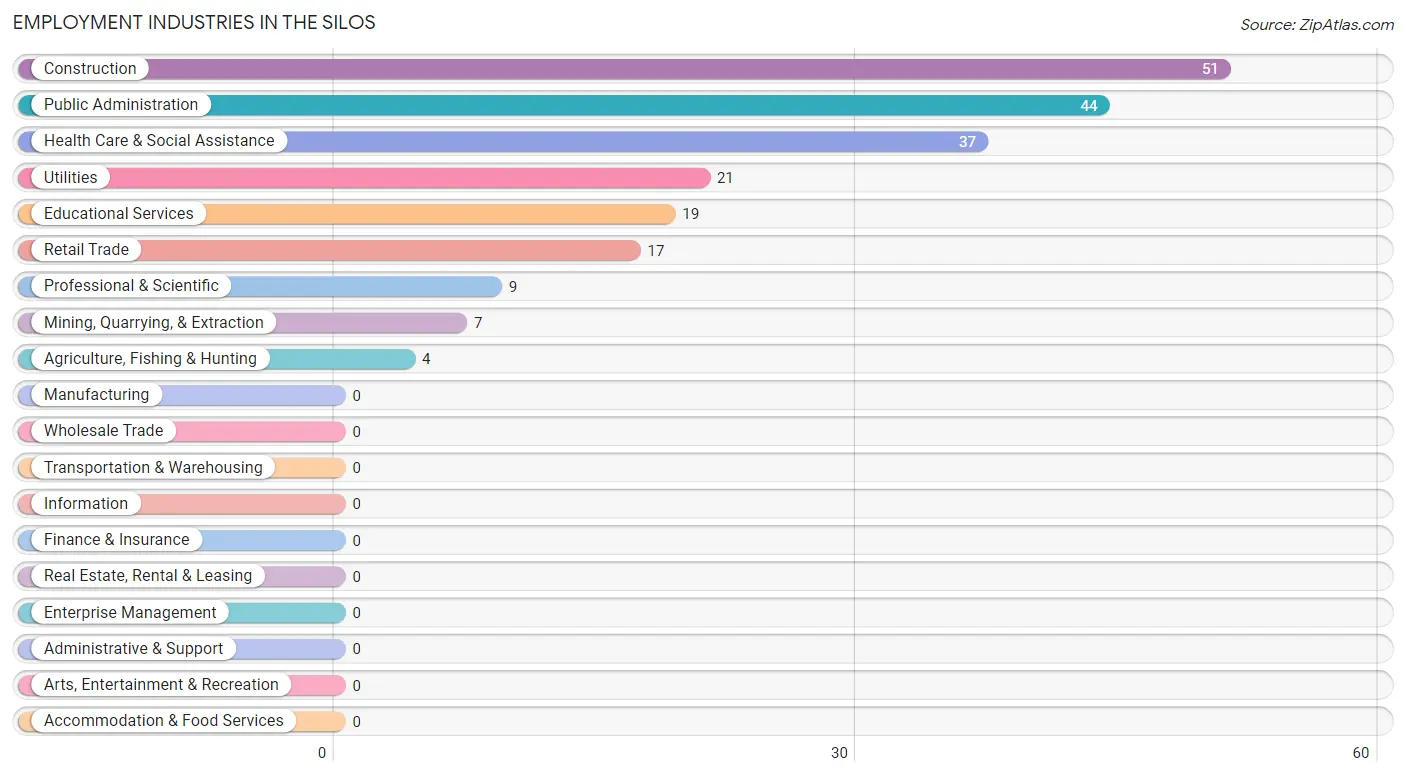
Employment Industries in The Silos
The major employment industries in The Silos include Construction (51 | 23.9%), Public Administration (44 | 20.7%), Health Care & Social Assistance (37 | 17.4%), Utilities (21 | 9.9%), and Educational Services (19 | 8.9%).
Employment Industries by Sex in The Silos
The The Silos industries that see more men than women are Agriculture, Fishing & Hunting (100.0%), Mining, Quarrying, & Extraction (100.0%), and Construction (100.0%), whereas the industries that tend to have a higher number of women are Retail Trade (100.0%), Utilities (100.0%), and Educational Services (100.0%).
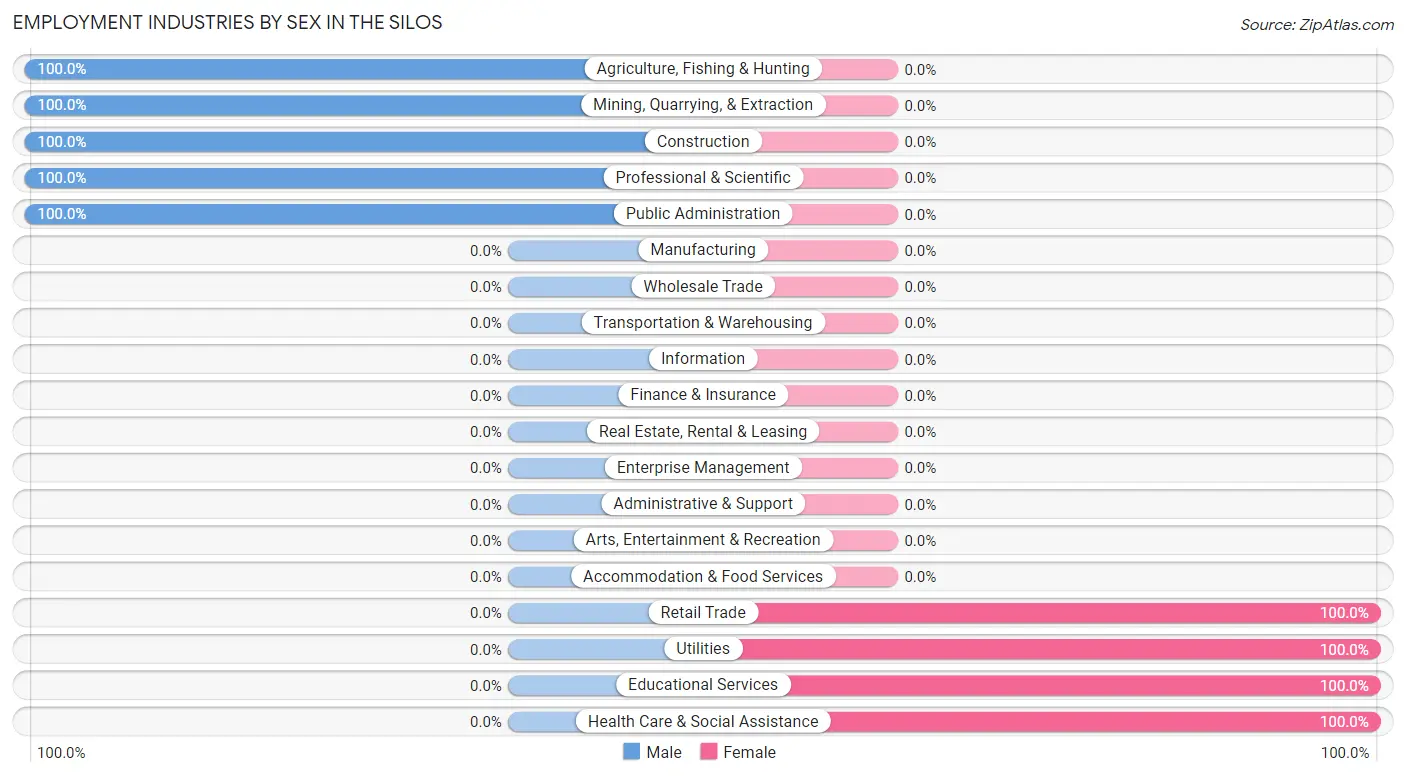
| Industry | Male | Female |
| Agriculture, Fishing & Hunting | 4 (100.0%) | 0 (0.0%) |
| Mining, Quarrying, & Extraction | 7 (100.0%) | 0 (0.0%) |
| Construction | 51 (100.0%) | 0 (0.0%) |
| Manufacturing | 0 (0.0%) | 0 (0.0%) |
| Wholesale Trade | 0 (0.0%) | 0 (0.0%) |
| Retail Trade | 0 (0.0%) | 17 (100.0%) |
| Transportation & Warehousing | 0 (0.0%) | 0 (0.0%) |
| Utilities | 0 (0.0%) | 21 (100.0%) |
| Information | 0 (0.0%) | 0 (0.0%) |
| Finance & Insurance | 0 (0.0%) | 0 (0.0%) |
| Real Estate, Rental & Leasing | 0 (0.0%) | 0 (0.0%) |
| Professional & Scientific | 9 (100.0%) | 0 (0.0%) |
| Enterprise Management | 0 (0.0%) | 0 (0.0%) |
| Administrative & Support | 0 (0.0%) | 0 (0.0%) |
| Educational Services | 0 (0.0%) | 19 (100.0%) |
| Health Care & Social Assistance | 0 (0.0%) | 37 (100.0%) |
| Arts, Entertainment & Recreation | 0 (0.0%) | 0 (0.0%) |
| Accommodation & Food Services | 0 (0.0%) | 0 (0.0%) |
| Public Administration | 44 (100.0%) | 0 (0.0%) |
| Total | 115 (54.0%) | 98 (46.0%) |
Education in The Silos
School Enrollment in The Silos
The most common levels of schooling among the 4 students in The Silos are middle school (2 | 50.0%), and high school (2 | 50.0%).
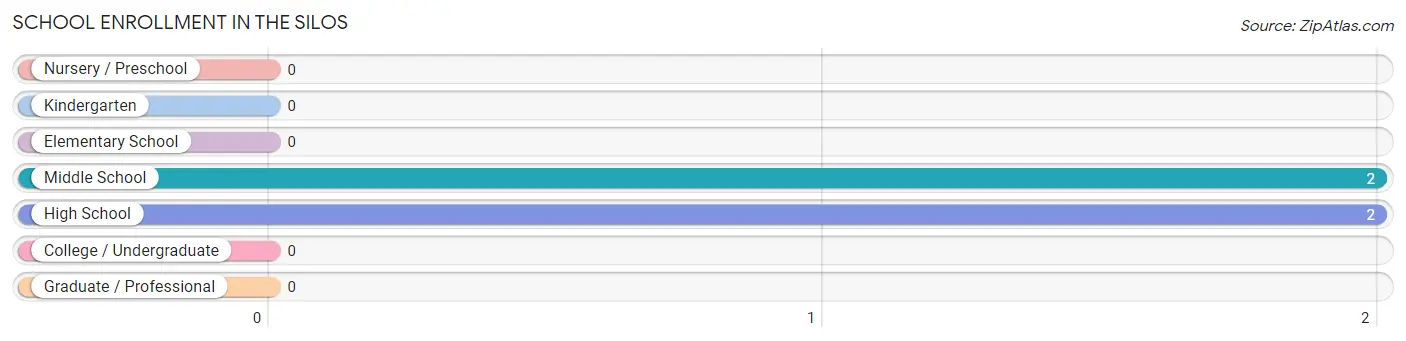
| School Level | # Students | % Students |
| Nursery / Preschool | 0 | 0.0% |
| Kindergarten | 0 | 0.0% |
| Elementary School | 0 | 0.0% |
| Middle School | 2 | 50.0% |
| High School | 2 | 50.0% |
| College / Undergraduate | 0 | 0.0% |
| Graduate / Professional | 0 | 0.0% |
| Total | 4 | 100.0% |
School Enrollment by Age by Funding Source in The Silos
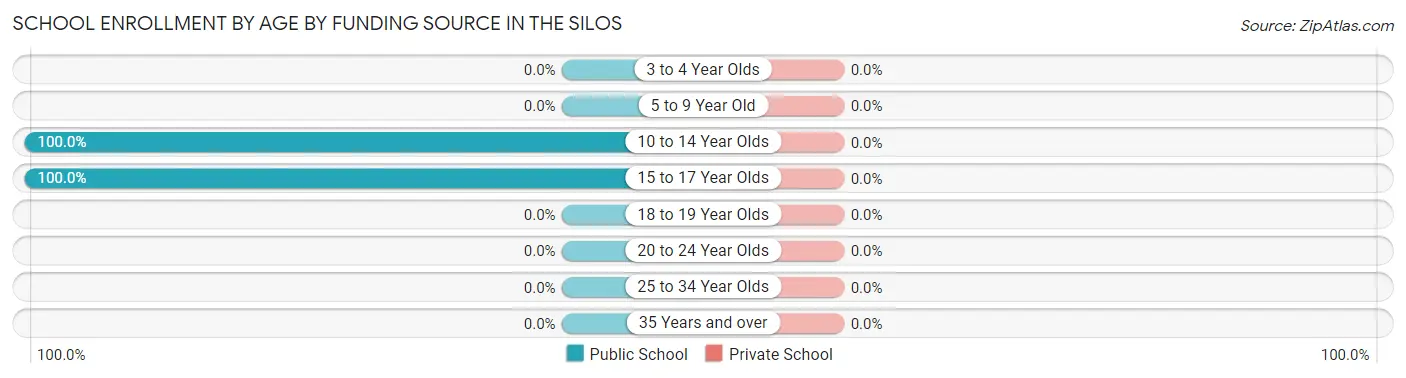
| Age Bracket | Public School | Private School |
| 3 to 4 Year Olds | 0 (0.0%) | 0 (0.0%) |
| 5 to 9 Year Old | 0 (0.0%) | 0 (0.0%) |
| 10 to 14 Year Olds | 2 (100.0%) | 0 (0.0%) |
| 15 to 17 Year Olds | 2 (100.0%) | 0 (0.0%) |
| 18 to 19 Year Olds | 0 (0.0%) | 0 (0.0%) |
| 20 to 24 Year Olds | 0 (0.0%) | 0 (0.0%) |
| 25 to 34 Year Olds | 0 (0.0%) | 0 (0.0%) |
| 35 Years and over | 0 (0.0%) | 0 (0.0%) |
| Total | 4 (100.0%) | 0 (0.0%) |
Educational Attainment by Field of Study in The Silos
Science & technology (54 | 35.3%), literature & languages (44 | 28.8%), education (37 | 24.2%), bio, nature & agricultural (11 | 7.2%), and computers & mathematics (7 | 4.6%) are the most common fields of study among 153 individuals in The Silos who have obtained a bachelor's degree or higher.
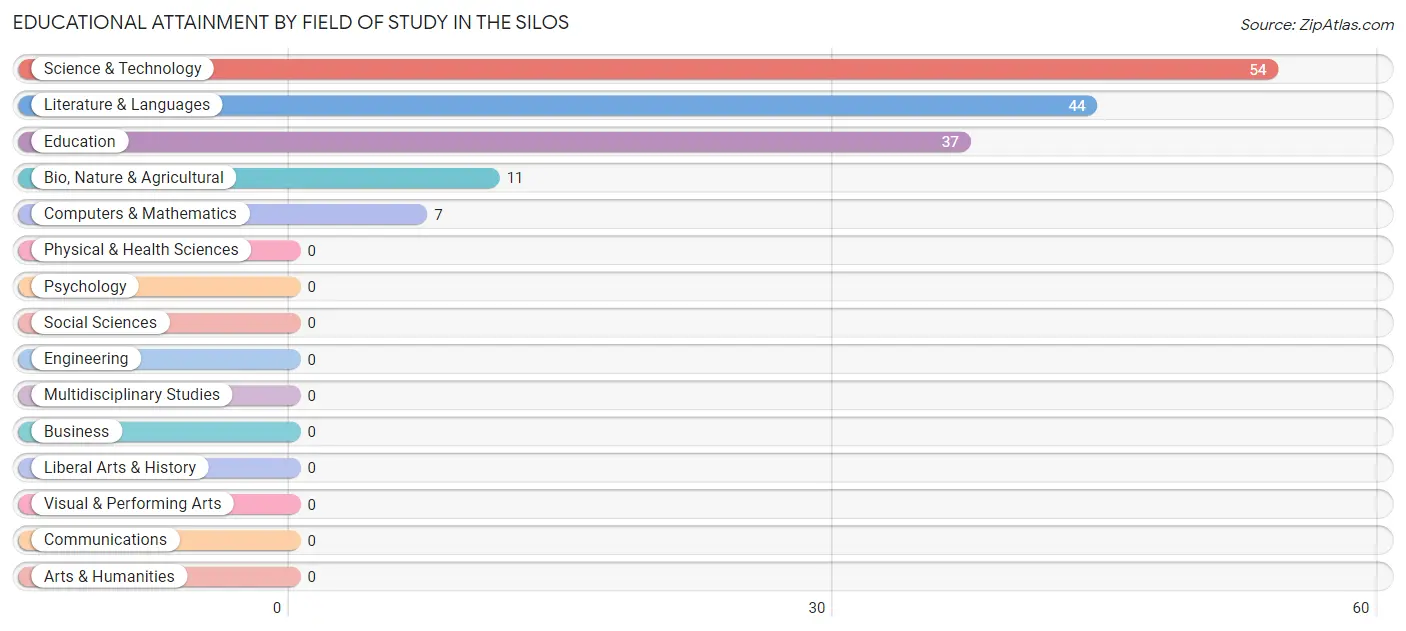
| Field of Study | # Graduates | % Graduates |
| Computers & Mathematics | 7 | 4.6% |
| Bio, Nature & Agricultural | 11 | 7.2% |
| Physical & Health Sciences | 0 | 0.0% |
| Psychology | 0 | 0.0% |
| Social Sciences | 0 | 0.0% |
| Engineering | 0 | 0.0% |
| Multidisciplinary Studies | 0 | 0.0% |
| Science & Technology | 54 | 35.3% |
| Business | 0 | 0.0% |
| Education | 37 | 24.2% |
| Literature & Languages | 44 | 28.8% |
| Liberal Arts & History | 0 | 0.0% |
| Visual & Performing Arts | 0 | 0.0% |
| Communications | 0 | 0.0% |
| Arts & Humanities | 0 | 0.0% |
| Total | 153 | 100.0% |
Transportation & Commute in The Silos
Vehicle Availability by Sex in The Silos
The most prevalent vehicle ownership categories in The Silos are males with 2 vehicles (57, accounting for 49.6%) and females with 2 vehicles (25, making up 58.2%).
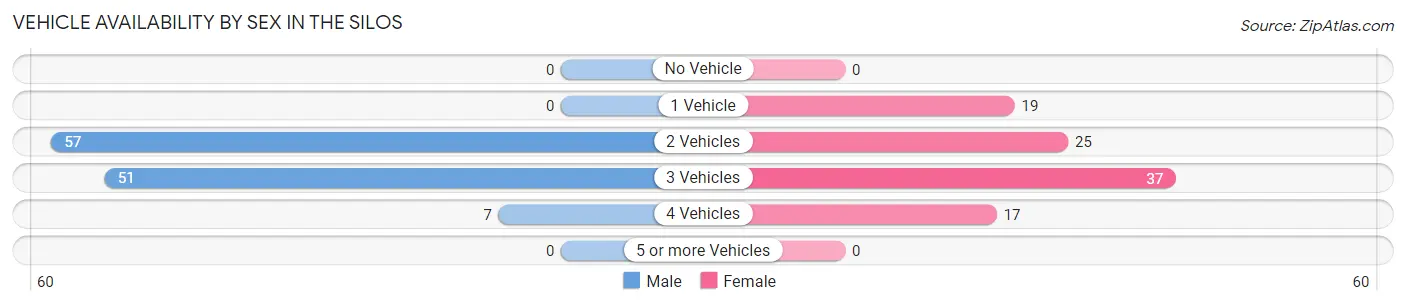
| Vehicles Available | Male | Female |
| No Vehicle | 0 (0.0%) | 0 (0.0%) |
| 1 Vehicle | 0 (0.0%) | 19 (19.4%) |
| 2 Vehicles | 57 (49.6%) | 25 (25.5%) |
| 3 Vehicles | 51 (44.4%) | 37 (37.8%) |
| 4 Vehicles | 7 (6.1%) | 17 (17.3%) |
| 5 or more Vehicles | 0 (0.0%) | 0 (0.0%) |
| Total | 115 (100.0%) | 98 (100.0%) |
Commute Time in The Silos
The most frequently occuring commute durations in The Silos are 45 to 59 minutes (65 commuters, 30.5%), 15 to 19 minutes (54 commuters, 25.4%), and 25 to 29 minutes (45 commuters, 21.1%).
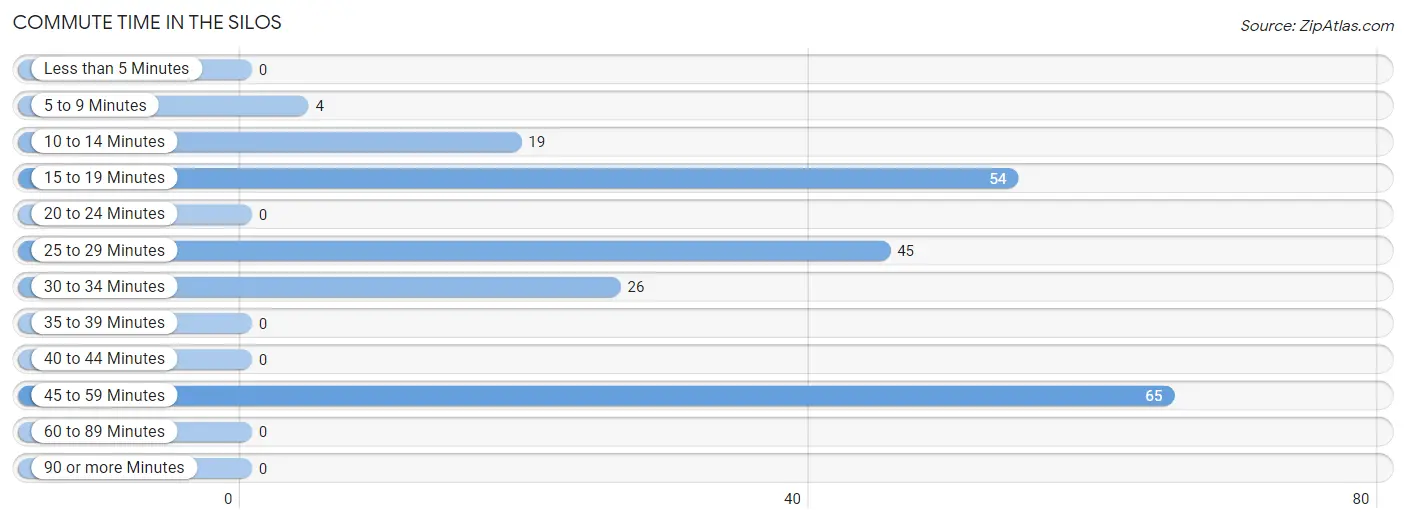
| Commute Time | # Commuters | % Commuters |
| Less than 5 Minutes | 0 | 0.0% |
| 5 to 9 Minutes | 4 | 1.9% |
| 10 to 14 Minutes | 19 | 8.9% |
| 15 to 19 Minutes | 54 | 25.4% |
| 20 to 24 Minutes | 0 | 0.0% |
| 25 to 29 Minutes | 45 | 21.1% |
| 30 to 34 Minutes | 26 | 12.2% |
| 35 to 39 Minutes | 0 | 0.0% |
| 40 to 44 Minutes | 0 | 0.0% |
| 45 to 59 Minutes | 65 | 30.5% |
| 60 to 89 Minutes | 0 | 0.0% |
| 90 or more Minutes | 0 | 0.0% |
Commute Time by Sex in The Silos
The most common commute times in The Silos are 15 to 19 minutes (54 commuters, 47.0%) for males and 25 to 29 minutes (41 commuters, 41.8%) for females.
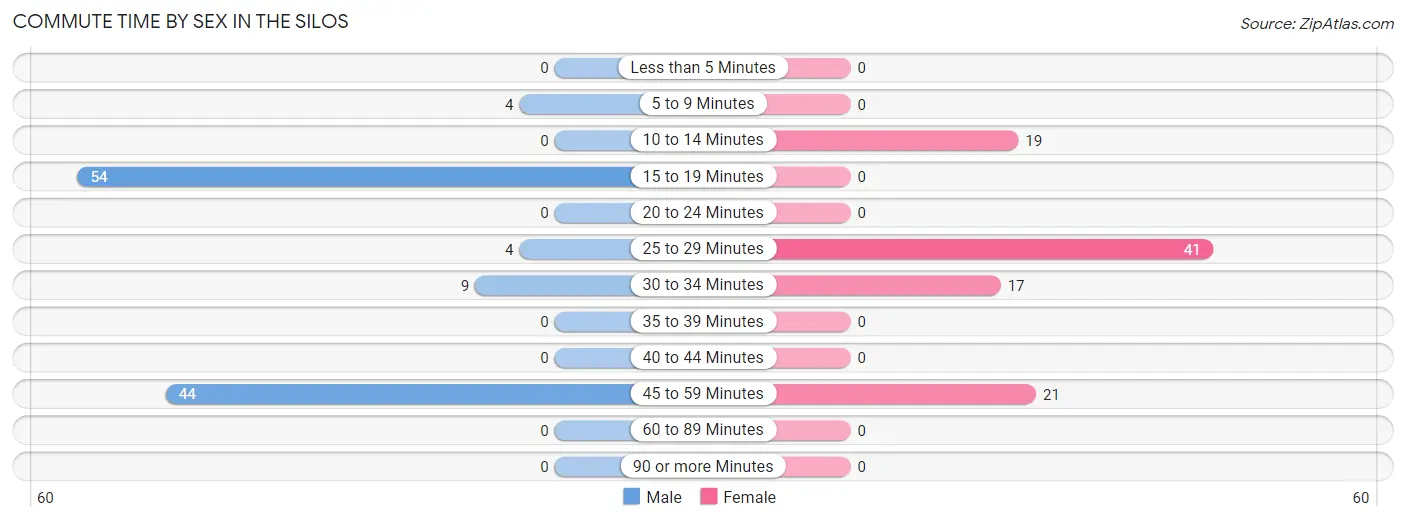
| Commute Time | Male | Female |
| Less than 5 Minutes | 0 (0.0%) | 0 (0.0%) |
| 5 to 9 Minutes | 4 (3.5%) | 0 (0.0%) |
| 10 to 14 Minutes | 0 (0.0%) | 19 (19.4%) |
| 15 to 19 Minutes | 54 (47.0%) | 0 (0.0%) |
| 20 to 24 Minutes | 0 (0.0%) | 0 (0.0%) |
| 25 to 29 Minutes | 4 (3.5%) | 41 (41.8%) |
| 30 to 34 Minutes | 9 (7.8%) | 17 (17.3%) |
| 35 to 39 Minutes | 0 (0.0%) | 0 (0.0%) |
| 40 to 44 Minutes | 0 (0.0%) | 0 (0.0%) |
| 45 to 59 Minutes | 44 (38.3%) | 21 (21.4%) |
| 60 to 89 Minutes | 0 (0.0%) | 0 (0.0%) |
| 90 or more Minutes | 0 (0.0%) | 0 (0.0%) |
Time of Departure to Work by Sex in The Silos
The most frequent times of departure to work in The Silos are 5:00 AM to 5:29 AM (51, 44.4%) for males and 7:30 AM to 7:59 AM (41, 41.8%) for females.

| Time of Departure | Male | Female |
| 12:00 AM to 4:59 AM | 0 (0.0%) | 0 (0.0%) |
| 5:00 AM to 5:29 AM | 51 (44.4%) | 21 (21.4%) |
| 5:30 AM to 5:59 AM | 0 (0.0%) | 19 (19.4%) |
| 6:00 AM to 6:29 AM | 4 (3.5%) | 0 (0.0%) |
| 6:30 AM to 6:59 AM | 47 (40.9%) | 0 (0.0%) |
| 7:00 AM to 7:29 AM | 4 (3.5%) | 4 (4.1%) |
| 7:30 AM to 7:59 AM | 0 (0.0%) | 41 (41.8%) |
| 8:00 AM to 8:29 AM | 9 (7.8%) | 0 (0.0%) |
| 8:30 AM to 8:59 AM | 0 (0.0%) | 13 (13.3%) |
| 9:00 AM to 9:59 AM | 0 (0.0%) | 0 (0.0%) |
| 10:00 AM to 10:59 AM | 0 (0.0%) | 0 (0.0%) |
| 11:00 AM to 11:59 AM | 0 (0.0%) | 0 (0.0%) |
| 12:00 PM to 3:59 PM | 0 (0.0%) | 0 (0.0%) |
| 4:00 PM to 11:59 PM | 0 (0.0%) | 0 (0.0%) |
| Total | 115 (100.0%) | 98 (100.0%) |
Housing Occupancy in The Silos
Occupancy by Ownership in The Silos
Of the total 233 dwellings in The Silos, owner-occupied units account for 214 (91.8%), while renter-occupied units make up 19 (8.2%).
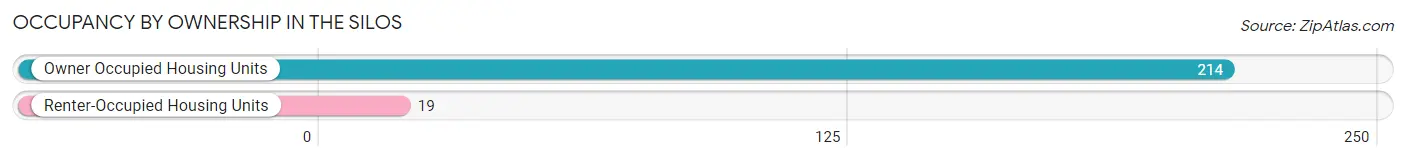
| Occupancy | # Housing Units | % Housing Units |
| Owner Occupied Housing Units | 214 | 91.8% |
| Renter-Occupied Housing Units | 19 | 8.2% |
| Total Occupied Housing Units | 233 | 100.0% |
Occupancy by Household Size in The Silos
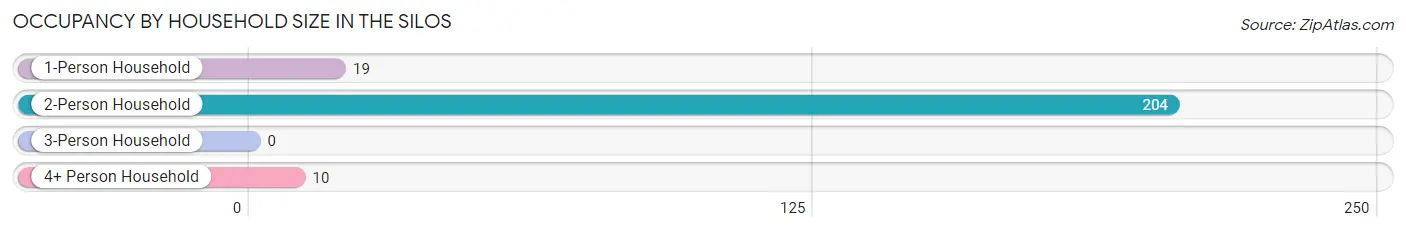
| Household Size | # Housing Units | % Housing Units |
| 1-Person Household | 19 | 8.2% |
| 2-Person Household | 204 | 87.5% |
| 3-Person Household | 0 | 0.0% |
| 4+ Person Household | 10 | 4.3% |
| Total Housing Units | 233 | 100.0% |
Occupancy by Ownership by Household Size in The Silos
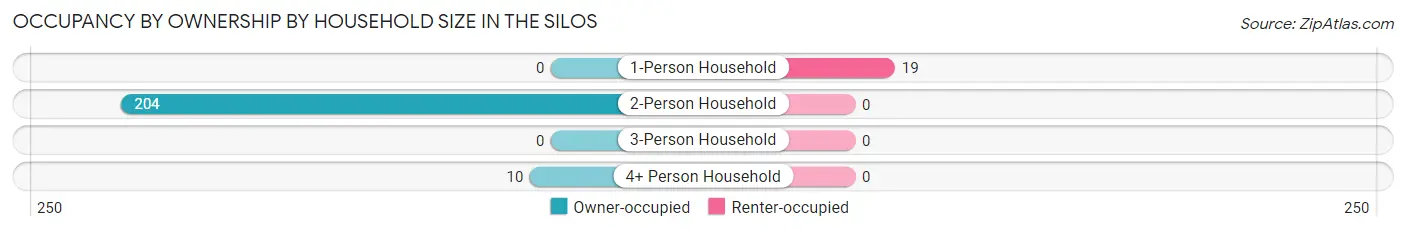
| Household Size | Owner-occupied | Renter-occupied |
| 1-Person Household | 0 (0.0%) | 19 (100.0%) |
| 2-Person Household | 204 (100.0%) | 0 (0.0%) |
| 3-Person Household | 0 (0.0%) | 0 (0.0%) |
| 4+ Person Household | 10 (100.0%) | 0 (0.0%) |
| Total Housing Units | 214 (91.8%) | 19 (8.2%) |
Occupancy by Educational Attainment in The Silos
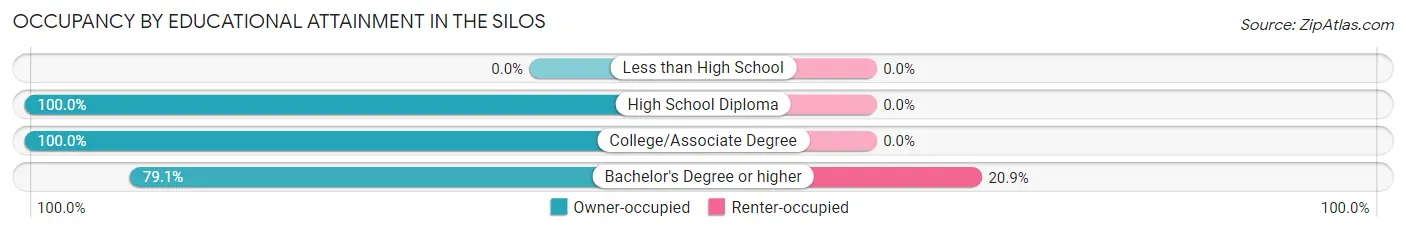
| Household Size | Owner-occupied | Renter-occupied |
| Less than High School | 0 (0.0%) | 0 (0.0%) |
| High School Diploma | 67 (100.0%) | 0 (0.0%) |
| College/Associate Degree | 75 (100.0%) | 0 (0.0%) |
| Bachelor's Degree or higher | 72 (79.1%) | 19 (20.9%) |
Occupancy by Age of Householder in The Silos
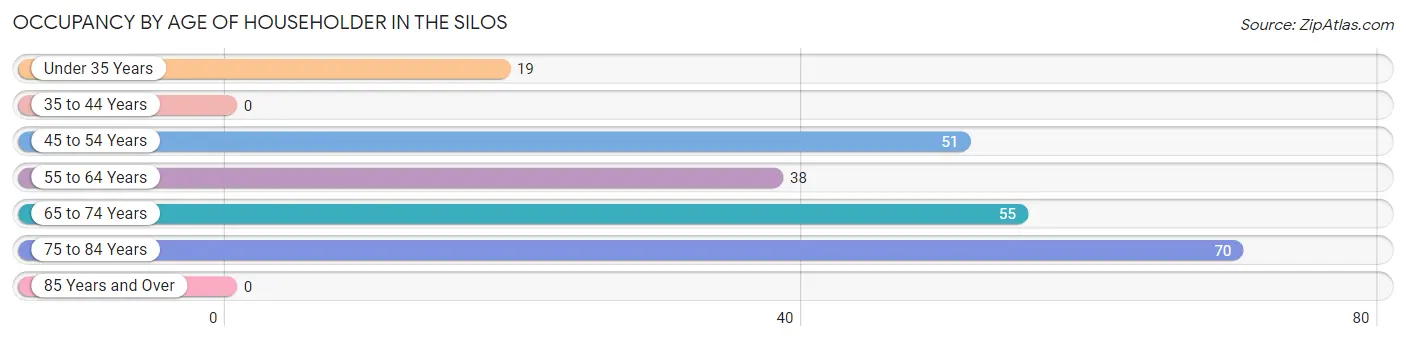
| Age Bracket | # Households | % Households |
| Under 35 Years | 19 | 8.2% |
| 35 to 44 Years | 0 | 0.0% |
| 45 to 54 Years | 51 | 21.9% |
| 55 to 64 Years | 38 | 16.3% |
| 65 to 74 Years | 55 | 23.6% |
| 75 to 84 Years | 70 | 30.0% |
| 85 Years and Over | 0 | 0.0% |
| Total | 233 | 100.0% |
Housing Finances in The Silos
Median Income by Occupancy in The Silos
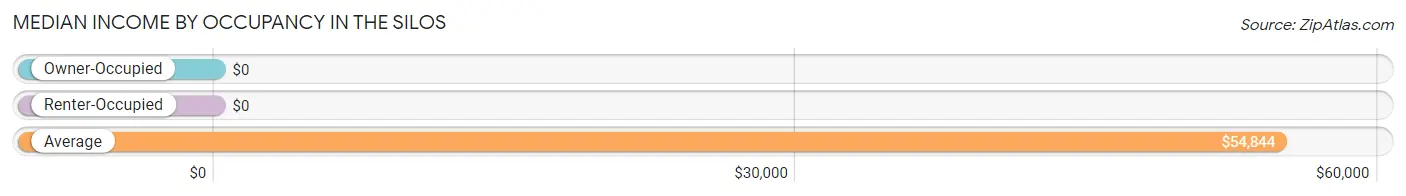
| Occupancy Type | # Households | Median Income |
| Owner-Occupied | 214 (91.8%) | $0 |
| Renter-Occupied | 19 (8.2%) | $0 |
| Average | 233 (100.0%) | $54,844 |
Occupancy by Householder Income Bracket in The Silos
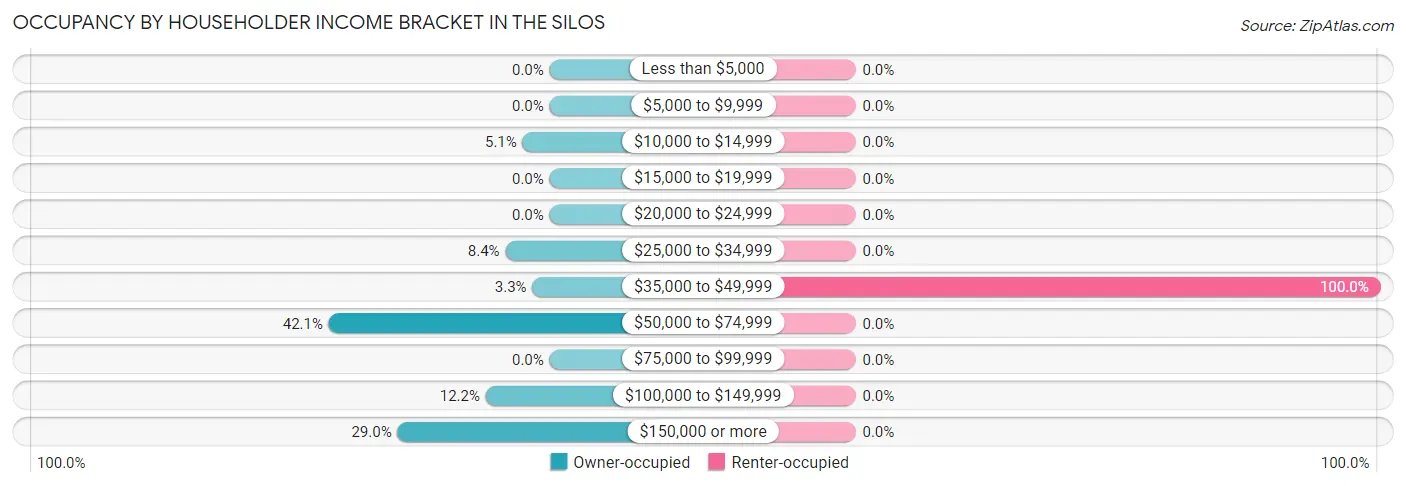
| Income Bracket | Owner-occupied | Renter-occupied |
| Less than $5,000 | 0 (0.0%) | 0 (0.0%) |
| $5,000 to $9,999 | 0 (0.0%) | 0 (0.0%) |
| $10,000 to $14,999 | 11 (5.1%) | 0 (0.0%) |
| $15,000 to $19,999 | 0 (0.0%) | 0 (0.0%) |
| $20,000 to $24,999 | 0 (0.0%) | 0 (0.0%) |
| $25,000 to $34,999 | 18 (8.4%) | 0 (0.0%) |
| $35,000 to $49,999 | 7 (3.3%) | 19 (100.0%) |
| $50,000 to $74,999 | 90 (42.1%) | 0 (0.0%) |
| $75,000 to $99,999 | 0 (0.0%) | 0 (0.0%) |
| $100,000 to $149,999 | 26 (12.1%) | 0 (0.0%) |
| $150,000 or more | 62 (29.0%) | 0 (0.0%) |
| Total | 214 (100.0%) | 19 (100.0%) |
Monthly Housing Cost Tiers in The Silos
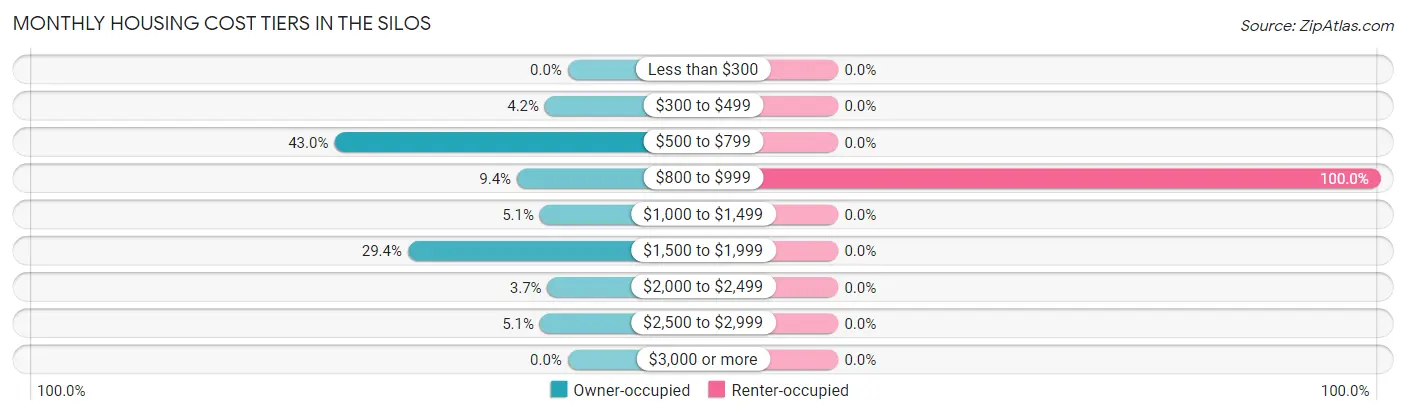
| Monthly Cost | Owner-occupied | Renter-occupied |
| Less than $300 | 0 (0.0%) | 0 (0.0%) |
| $300 to $499 | 9 (4.2%) | 0 (0.0%) |
| $500 to $799 | 92 (43.0%) | 0 (0.0%) |
| $800 to $999 | 20 (9.3%) | 19 (100.0%) |
| $1,000 to $1,499 | 11 (5.1%) | 0 (0.0%) |
| $1,500 to $1,999 | 63 (29.4%) | 0 (0.0%) |
| $2,000 to $2,499 | 8 (3.7%) | 0 (0.0%) |
| $2,500 to $2,999 | 11 (5.1%) | 0 (0.0%) |
| $3,000 or more | 0 (0.0%) | 0 (0.0%) |
| Total | 214 (100.0%) | 19 (100.0%) |
Physical Housing Characteristics in The Silos
Housing Structures in The Silos
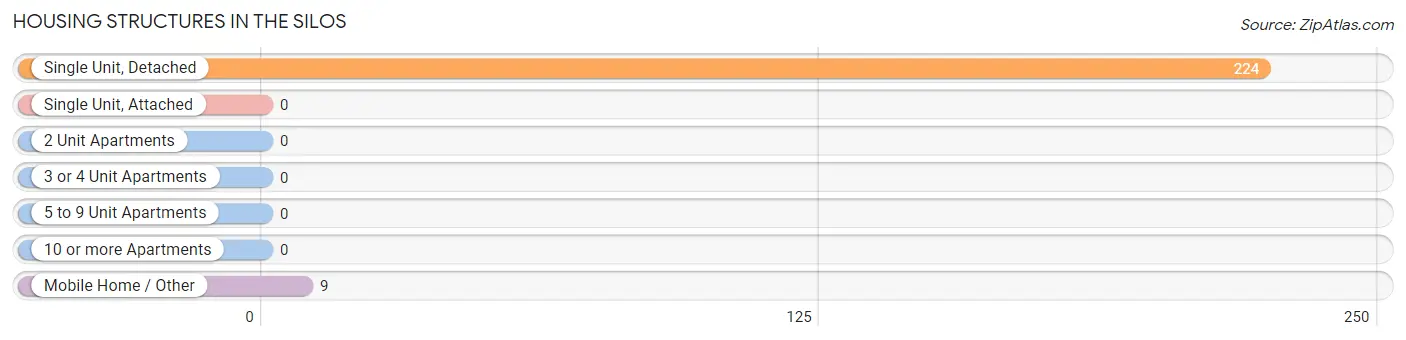
| Structure Type | # Housing Units | % Housing Units |
| Single Unit, Detached | 224 | 96.1% |
| Single Unit, Attached | 0 | 0.0% |
| 2 Unit Apartments | 0 | 0.0% |
| 3 or 4 Unit Apartments | 0 | 0.0% |
| 5 to 9 Unit Apartments | 0 | 0.0% |
| 10 or more Apartments | 0 | 0.0% |
| Mobile Home / Other | 9 | 3.9% |
| Total | 233 | 100.0% |
Housing Structures by Occupancy in The Silos
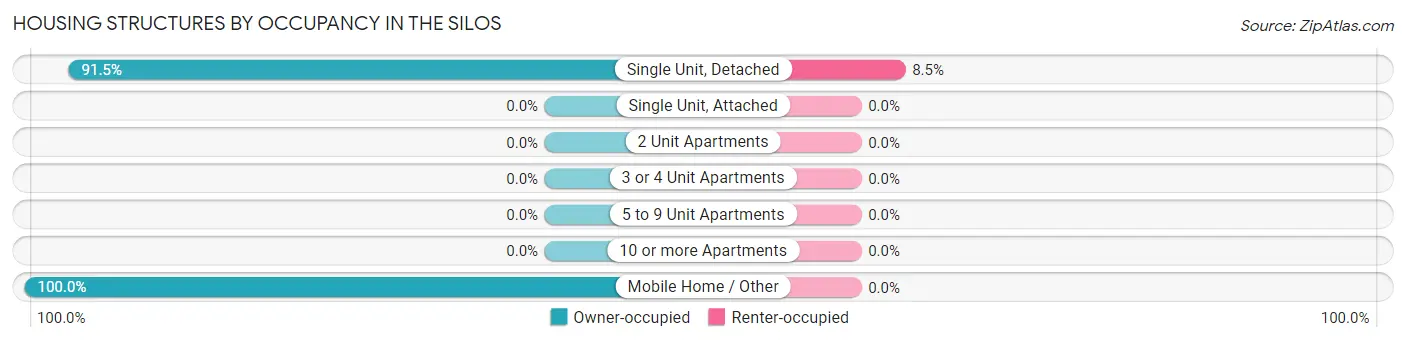
| Structure Type | Owner-occupied | Renter-occupied |
| Single Unit, Detached | 205 (91.5%) | 19 (8.5%) |
| Single Unit, Attached | 0 (0.0%) | 0 (0.0%) |
| 2 Unit Apartments | 0 (0.0%) | 0 (0.0%) |
| 3 or 4 Unit Apartments | 0 (0.0%) | 0 (0.0%) |
| 5 to 9 Unit Apartments | 0 (0.0%) | 0 (0.0%) |
| 10 or more Apartments | 0 (0.0%) | 0 (0.0%) |
| Mobile Home / Other | 9 (100.0%) | 0 (0.0%) |
| Total | 214 (91.8%) | 19 (8.2%) |
Housing Structures by Number of Rooms in The Silos
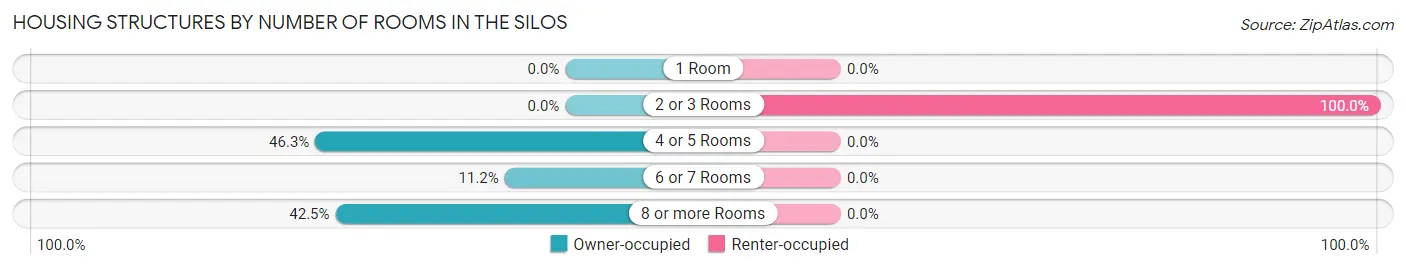
| Number of Rooms | Owner-occupied | Renter-occupied |
| 1 Room | 0 (0.0%) | 0 (0.0%) |
| 2 or 3 Rooms | 0 (0.0%) | 19 (100.0%) |
| 4 or 5 Rooms | 99 (46.3%) | 0 (0.0%) |
| 6 or 7 Rooms | 24 (11.2%) | 0 (0.0%) |
| 8 or more Rooms | 91 (42.5%) | 0 (0.0%) |
| Total | 214 (100.0%) | 19 (100.0%) |
Housing Structure by Heating Type in The Silos
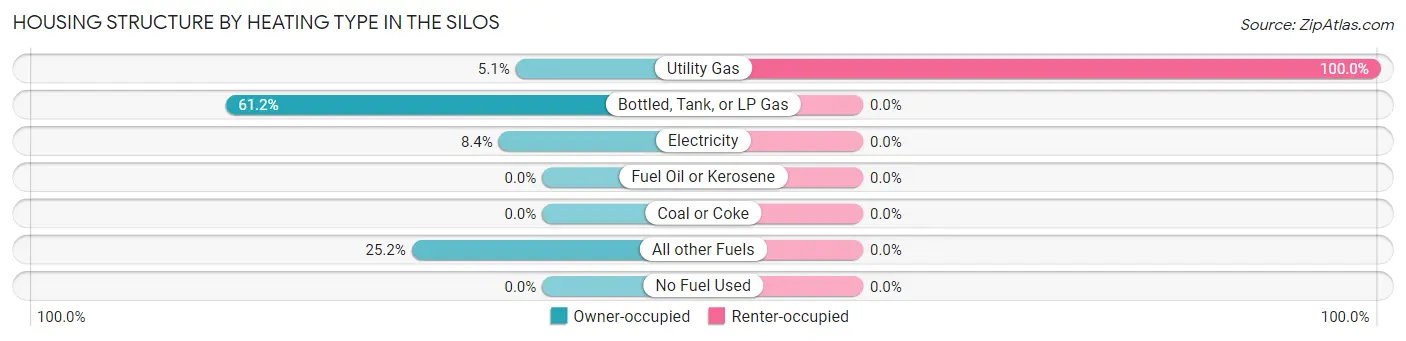
| Heating Type | Owner-occupied | Renter-occupied |
| Utility Gas | 11 (5.1%) | 19 (100.0%) |
| Bottled, Tank, or LP Gas | 131 (61.2%) | 0 (0.0%) |
| Electricity | 18 (8.4%) | 0 (0.0%) |
| Fuel Oil or Kerosene | 0 (0.0%) | 0 (0.0%) |
| Coal or Coke | 0 (0.0%) | 0 (0.0%) |
| All other Fuels | 54 (25.2%) | 0 (0.0%) |
| No Fuel Used | 0 (0.0%) | 0 (0.0%) |
| Total | 214 (100.0%) | 19 (100.0%) |
Household Vehicle Usage in The Silos
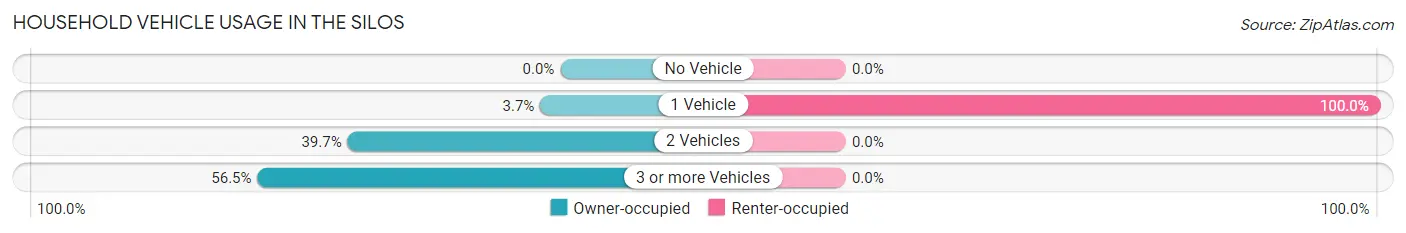
| Vehicles per Household | Owner-occupied | Renter-occupied |
| No Vehicle | 0 (0.0%) | 0 (0.0%) |
| 1 Vehicle | 8 (3.7%) | 19 (100.0%) |
| 2 Vehicles | 85 (39.7%) | 0 (0.0%) |
| 3 or more Vehicles | 121 (56.5%) | 0 (0.0%) |
| Total | 214 (100.0%) | 19 (100.0%) |
Real Estate & Mortgages in The Silos
Real Estate and Mortgage Overview in The Silos
| Characteristic | Without Mortgage | With Mortgage |
| Housing Units | 101 | 113 |
| Median Property Value | $415,800 | $566,500 |
| Median Household Income | $114,327 | $15 |
| Monthly Housing Costs | $588 | $0 |
| Real Estate Taxes | $2,351 | $0 |
Property Value by Mortgage Status in The Silos
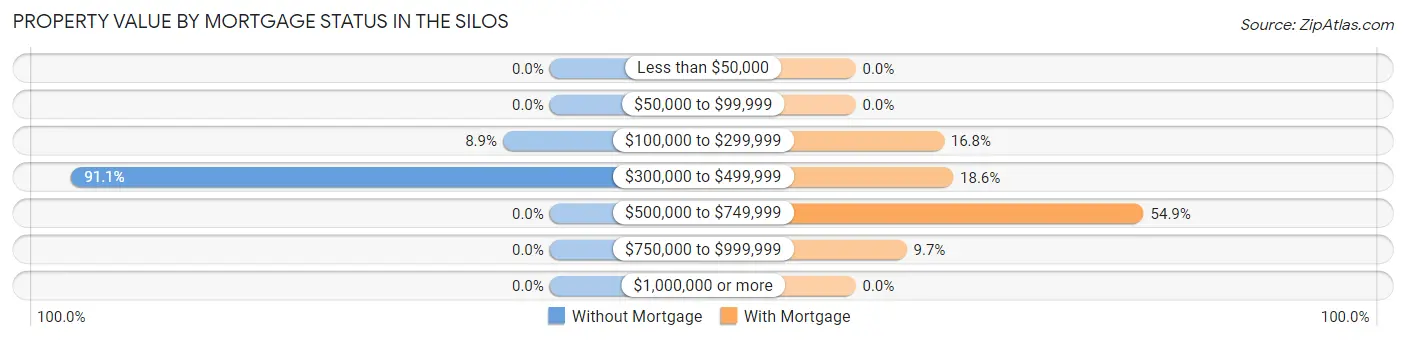
| Property Value | Without Mortgage | With Mortgage |
| Less than $50,000 | 0 (0.0%) | 0 (0.0%) |
| $50,000 to $99,999 | 0 (0.0%) | 0 (0.0%) |
| $100,000 to $299,999 | 9 (8.9%) | 19 (16.8%) |
| $300,000 to $499,999 | 92 (91.1%) | 21 (18.6%) |
| $500,000 to $749,999 | 0 (0.0%) | 62 (54.9%) |
| $750,000 to $999,999 | 0 (0.0%) | 11 (9.7%) |
| $1,000,000 or more | 0 (0.0%) | 0 (0.0%) |
| Total | 101 (100.0%) | 113 (100.0%) |
Household Income by Mortgage Status in The Silos
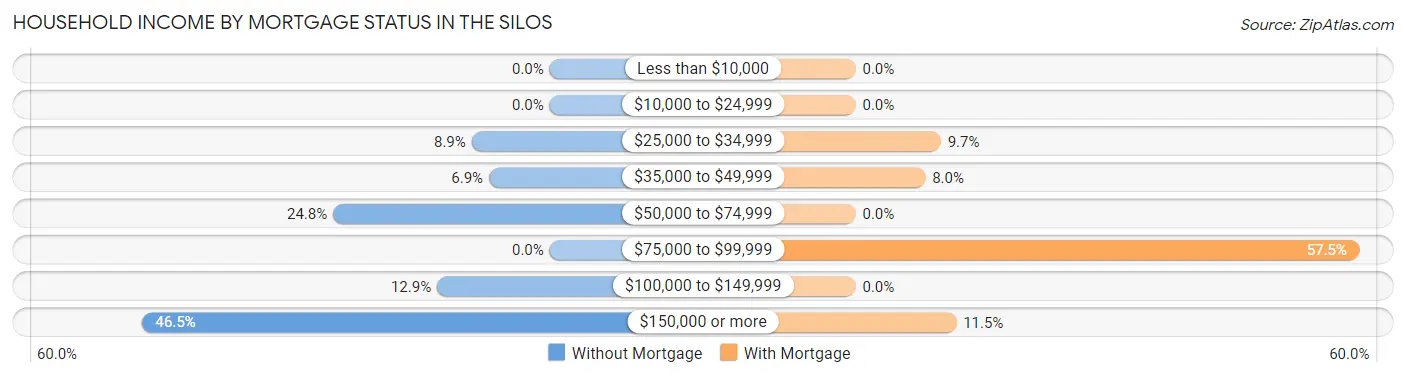
| Household Income | Without Mortgage | With Mortgage |
| Less than $10,000 | 0 (0.0%) | 0 (0.0%) |
| $10,000 to $24,999 | 0 (0.0%) | 0 (0.0%) |
| $25,000 to $34,999 | 9 (8.9%) | 11 (9.7%) |
| $35,000 to $49,999 | 7 (6.9%) | 9 (8.0%) |
| $50,000 to $74,999 | 25 (24.7%) | 0 (0.0%) |
| $75,000 to $99,999 | 0 (0.0%) | 65 (57.5%) |
| $100,000 to $149,999 | 13 (12.9%) | 0 (0.0%) |
| $150,000 or more | 47 (46.5%) | 13 (11.5%) |
| Total | 101 (100.0%) | 113 (100.0%) |
Property Value to Household Income Ratio in The Silos
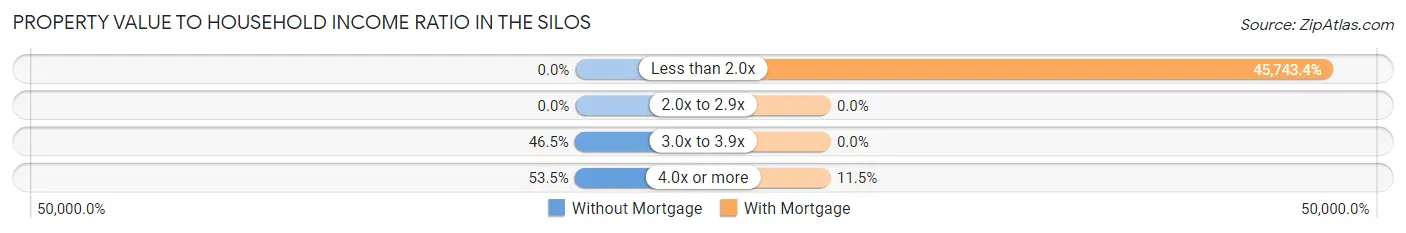
| Value-to-Income Ratio | Without Mortgage | With Mortgage |
| Less than 2.0x | 0 (0.0%) | 51,690 (45,743.4%) |
| 2.0x to 2.9x | 0 (0.0%) | 0 (0.0%) |
| 3.0x to 3.9x | 47 (46.5%) | 0 (0.0%) |
| 4.0x or more | 54 (53.5%) | 13 (11.5%) |
| Total | 101 (100.0%) | 113 (100.0%) |
Real Estate Taxes by Mortgage Status in The Silos
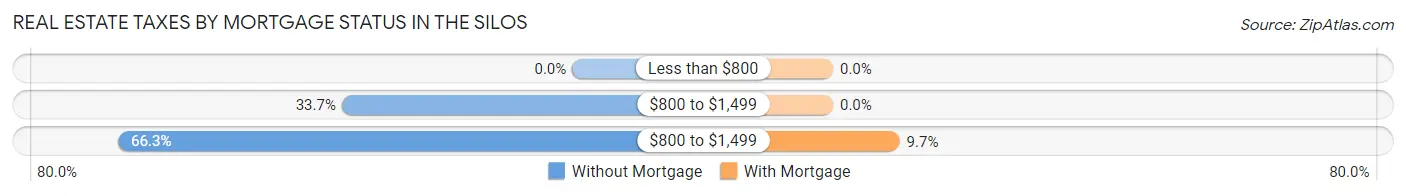
| Property Taxes | Without Mortgage | With Mortgage |
| Less than $800 | 0 (0.0%) | 0 (0.0%) |
| $800 to $1,499 | 34 (33.7%) | 0 (0.0%) |
| $800 to $1,499 | 67 (66.3%) | 11 (9.7%) |
| Total | 101 (100.0%) | 113 (100.0%) |
Health & Disability in The Silos
Health Insurance Coverage by Age in The Silos
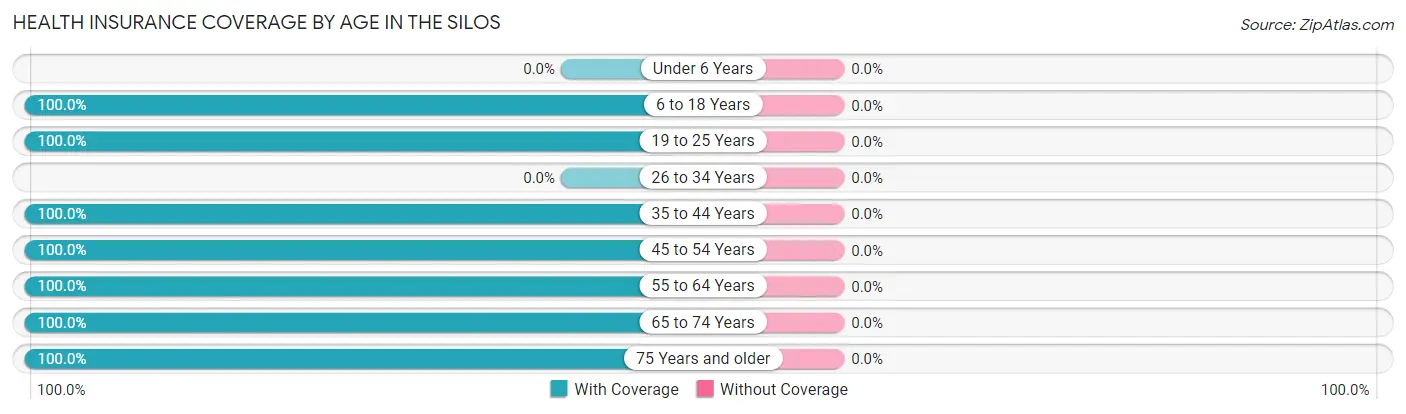
| Age Bracket | With Coverage | Without Coverage |
| Under 6 Years | 0 (0.0%) | 0 (0.0%) |
| 6 to 18 Years | 4 (100.0%) | 0 (0.0%) |
| 19 to 25 Years | 32 (100.0%) | 0 (0.0%) |
| 26 to 34 Years | 0 (0.0%) | 0 (0.0%) |
| 35 to 44 Years | 4 (100.0%) | 0 (0.0%) |
| 45 to 54 Years | 95 (100.0%) | 0 (0.0%) |
| 55 to 64 Years | 98 (100.0%) | 0 (0.0%) |
| 65 to 74 Years | 86 (100.0%) | 0 (0.0%) |
| 75 Years and older | 155 (100.0%) | 0 (0.0%) |
| Total | 474 (100.0%) | 0 (0.0%) |
Health Insurance Coverage by Citizenship Status in The Silos
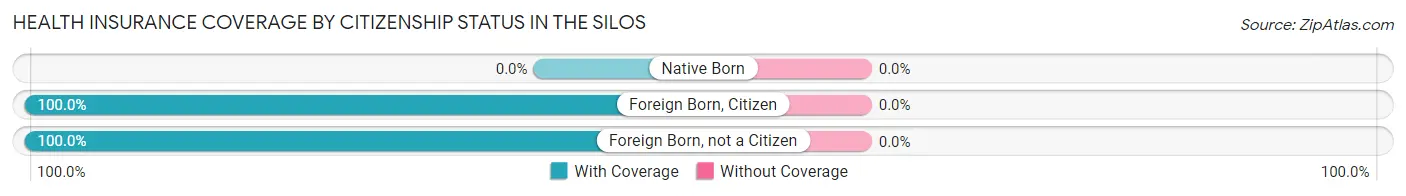
| Citizenship Status | With Coverage | Without Coverage |
| Native Born | 0 (0.0%) | 0 (0.0%) |
| Foreign Born, Citizen | 4 (100.0%) | 0 (0.0%) |
| Foreign Born, not a Citizen | 32 (100.0%) | 0 (0.0%) |
Health Insurance Coverage by Household Income in The Silos
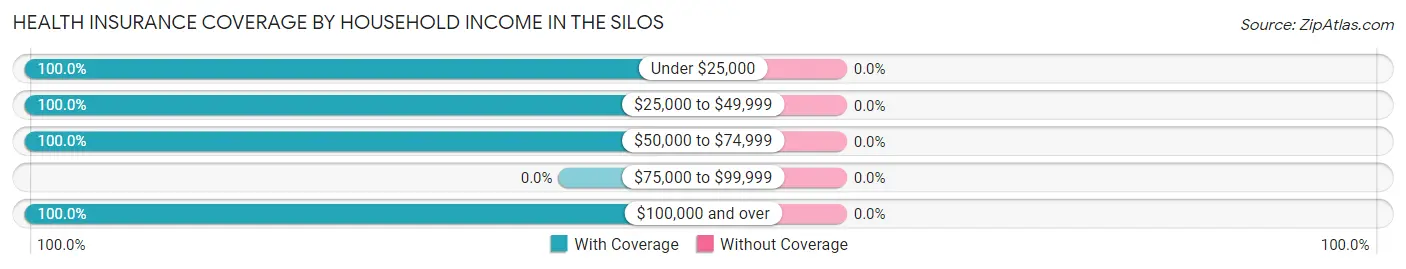
| Household Income | With Coverage | Without Coverage |
| Under $25,000 | 21 (100.0%) | 0 (0.0%) |
| $25,000 to $49,999 | 93 (100.0%) | 0 (0.0%) |
| $50,000 to $74,999 | 178 (100.0%) | 0 (0.0%) |
| $75,000 to $99,999 | 0 (0.0%) | 0 (0.0%) |
| $100,000 and over | 182 (100.0%) | 0 (0.0%) |
Public vs Private Health Insurance Coverage by Age in The Silos
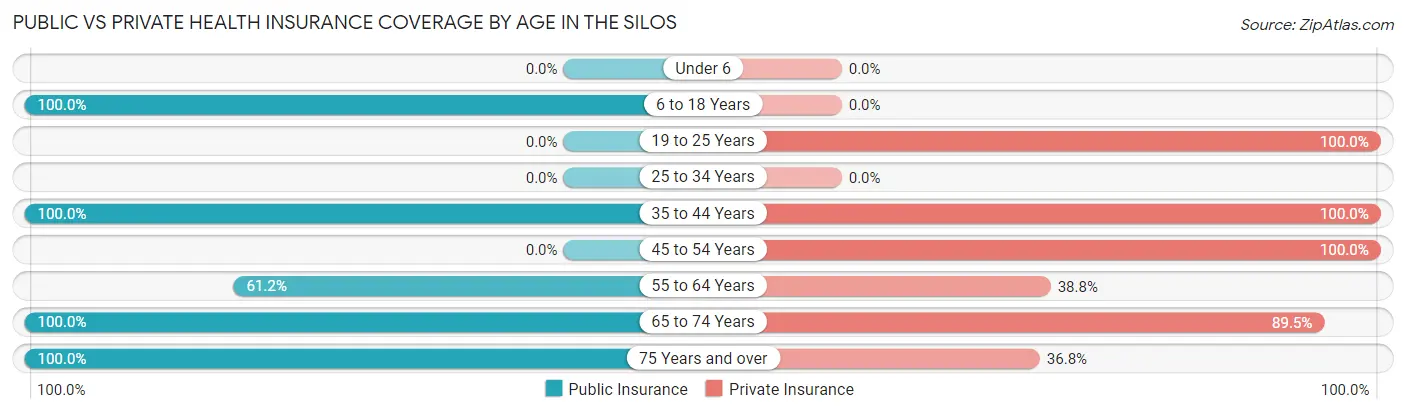
| Age Bracket | Public Insurance | Private Insurance |
| Under 6 | 0 (0.0%) | 0 (0.0%) |
| 6 to 18 Years | 4 (100.0%) | 0 (0.0%) |
| 19 to 25 Years | 0 (0.0%) | 32 (100.0%) |
| 25 to 34 Years | 0 (0.0%) | 0 (0.0%) |
| 35 to 44 Years | 4 (100.0%) | 4 (100.0%) |
| 45 to 54 Years | 0 (0.0%) | 95 (100.0%) |
| 55 to 64 Years | 60 (61.2%) | 38 (38.8%) |
| 65 to 74 Years | 86 (100.0%) | 77 (89.5%) |
| 75 Years and over | 155 (100.0%) | 57 (36.8%) |
| Total | 309 (65.2%) | 303 (63.9%) |
Disability Status by Sex by Age in The Silos
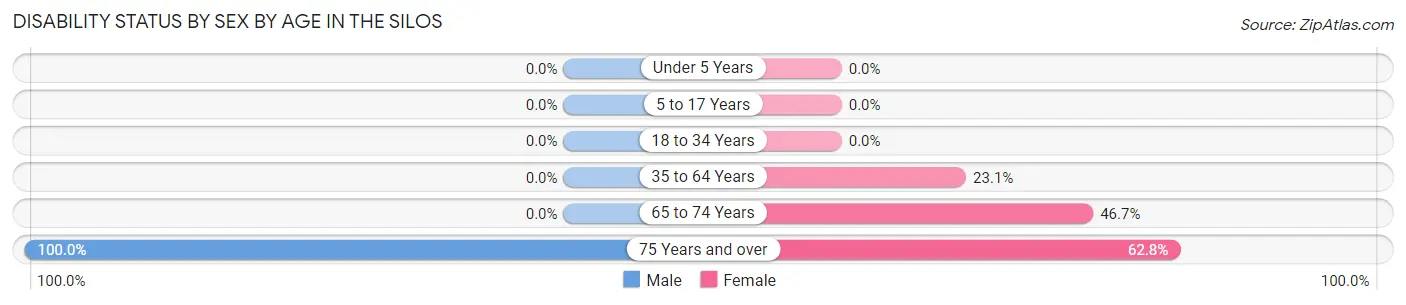
| Age Bracket | Male | Female |
| Under 5 Years | 0 (0.0%) | 0 (0.0%) |
| 5 to 17 Years | 0 (0.0%) | 0 (0.0%) |
| 18 to 34 Years | 0 (0.0%) | 0 (0.0%) |
| 35 to 64 Years | 0 (0.0%) | 21 (23.1%) |
| 65 to 74 Years | 0 (0.0%) | 21 (46.7%) |
| 75 Years and over | 69 (100.0%) | 54 (62.8%) |
Disability Class by Sex by Age in The Silos
Disability Class: Hearing Difficulty
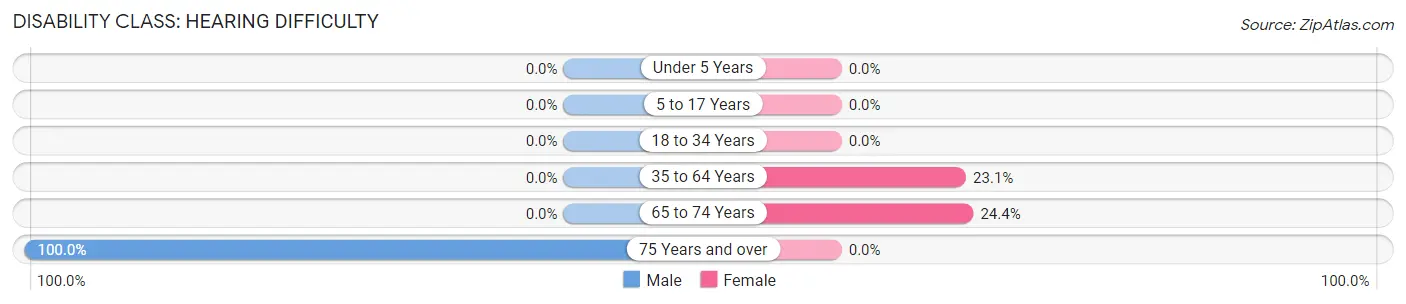
| Age Bracket | Male | Female |
| Under 5 Years | 0 (0.0%) | 0 (0.0%) |
| 5 to 17 Years | 0 (0.0%) | 0 (0.0%) |
| 18 to 34 Years | 0 (0.0%) | 0 (0.0%) |
| 35 to 64 Years | 0 (0.0%) | 21 (23.1%) |
| 65 to 74 Years | 0 (0.0%) | 11 (24.4%) |
| 75 Years and over | 69 (100.0%) | 0 (0.0%) |
Disability Class: Vision Difficulty
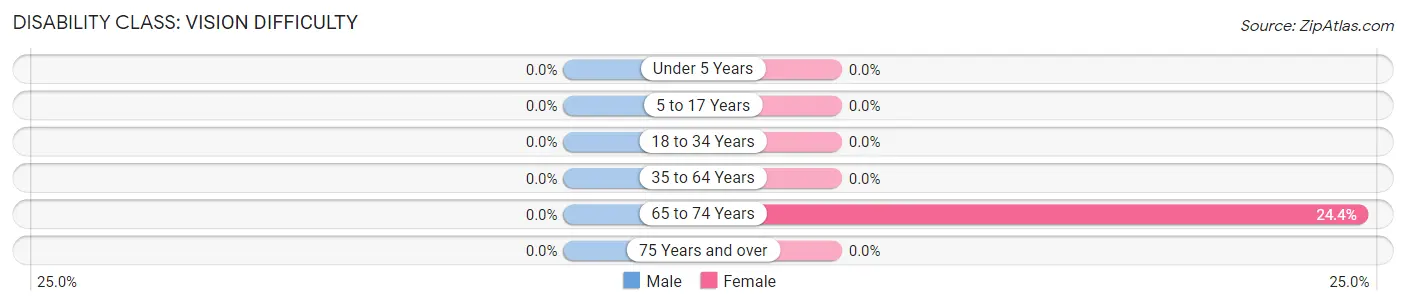
| Age Bracket | Male | Female |
| Under 5 Years | 0 (0.0%) | 0 (0.0%) |
| 5 to 17 Years | 0 (0.0%) | 0 (0.0%) |
| 18 to 34 Years | 0 (0.0%) | 0 (0.0%) |
| 35 to 64 Years | 0 (0.0%) | 0 (0.0%) |
| 65 to 74 Years | 0 (0.0%) | 11 (24.4%) |
| 75 Years and over | 0 (0.0%) | 0 (0.0%) |
Disability Class: Cognitive Difficulty
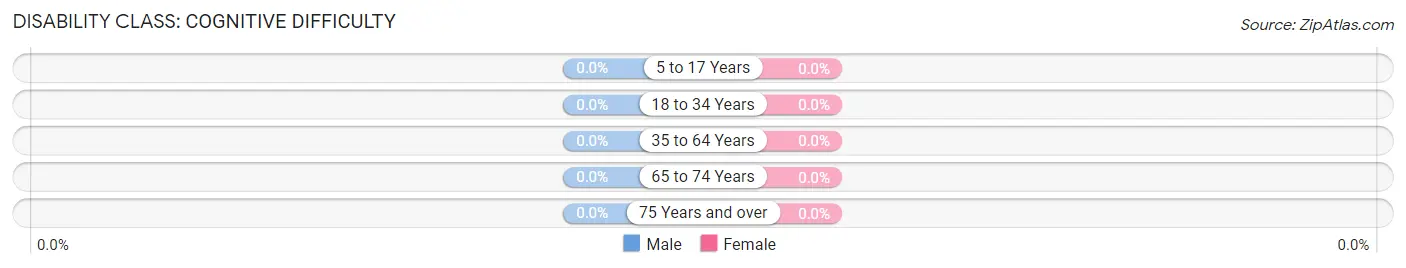
| Age Bracket | Male | Female |
| 5 to 17 Years | 0 (0.0%) | 0 (0.0%) |
| 18 to 34 Years | 0 (0.0%) | 0 (0.0%) |
| 35 to 64 Years | 0 (0.0%) | 0 (0.0%) |
| 65 to 74 Years | 0 (0.0%) | 0 (0.0%) |
| 75 Years and over | 0 (0.0%) | 0 (0.0%) |
Disability Class: Ambulatory Difficulty
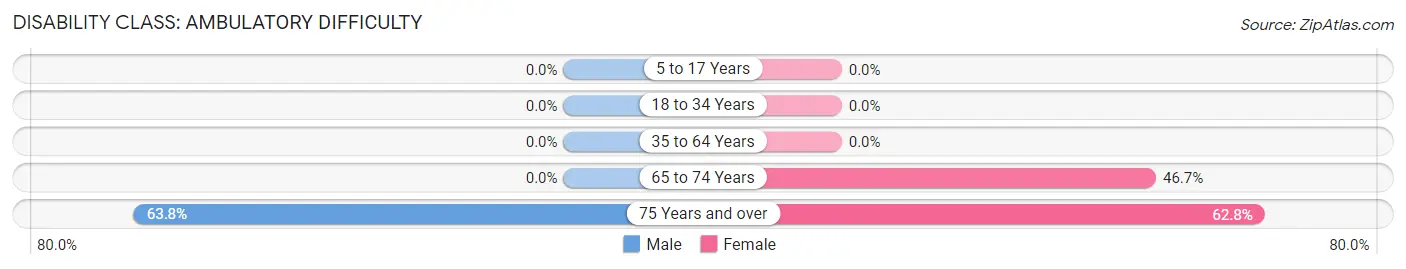
| Age Bracket | Male | Female |
| 5 to 17 Years | 0 (0.0%) | 0 (0.0%) |
| 18 to 34 Years | 0 (0.0%) | 0 (0.0%) |
| 35 to 64 Years | 0 (0.0%) | 0 (0.0%) |
| 65 to 74 Years | 0 (0.0%) | 21 (46.7%) |
| 75 Years and over | 44 (63.8%) | 54 (62.8%) |
Disability Class: Self-Care Difficulty
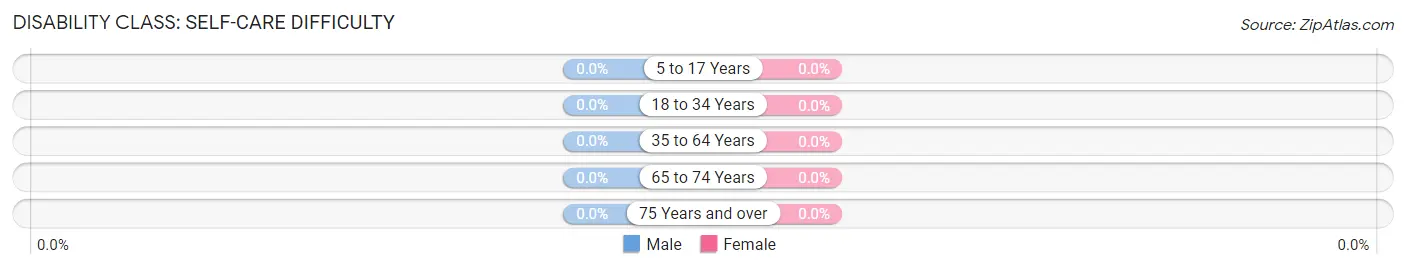
| Age Bracket | Male | Female |
| 5 to 17 Years | 0 (0.0%) | 0 (0.0%) |
| 18 to 34 Years | 0 (0.0%) | 0 (0.0%) |
| 35 to 64 Years | 0 (0.0%) | 0 (0.0%) |
| 65 to 74 Years | 0 (0.0%) | 0 (0.0%) |
| 75 Years and over | 0 (0.0%) | 0 (0.0%) |
Technology Access in The Silos
Computing Device Access in The Silos
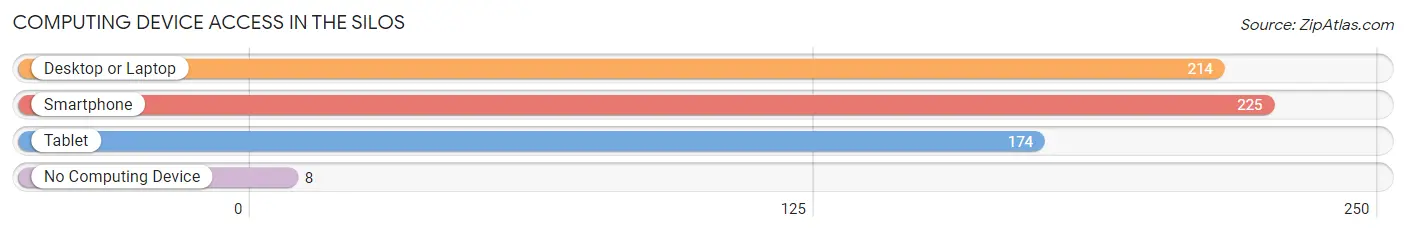
| Device Type | # Households | % Households |
| Desktop or Laptop | 214 | 91.8% |
| Smartphone | 225 | 96.6% |
| Tablet | 174 | 74.7% |
| No Computing Device | 8 | 3.4% |
| Total | 233 | 100.0% |
Internet Access in The Silos
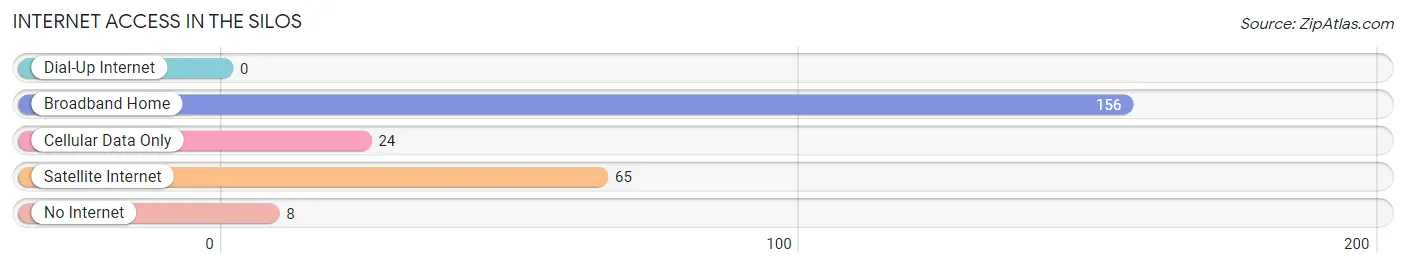
| Internet Type | # Households | % Households |
| Dial-Up Internet | 0 | 0.0% |
| Broadband Home | 156 | 66.9% |
| Cellular Data Only | 24 | 10.3% |
| Satellite Internet | 65 | 27.9% |
| No Internet | 8 | 3.4% |
| Total | 233 | 100.0% |
The Silos Summary
The Silos is a small town located in Montana, United States. It is situated in the south-central part of the state, in the foothills of the Rocky Mountains. The town is located in the county of Cascade, and is part of the Great Falls Metropolitan Statistical Area. The town has a population of approximately 1,000 people, and is a rural community with a strong agricultural base.
History
The Silos was founded in 1883 by a group of settlers from the Midwest. The settlers were looking for a place to settle and start a new life, and they chose the area around the Silos because of its fertile soil and abundant water supply. The town was named after the silos that were built to store grain and other agricultural products.
The town grew slowly over the years, and by the early 1900s it had become a thriving agricultural community. The town was home to several businesses, including a general store, a blacksmith, a livery stable, and a hotel. The town also had a school, a post office, and a church.
In the early 1900s, the town was also home to a large number of immigrants from Europe, including Italians, Germans, and Poles. These immigrants brought with them their own culture and traditions, which helped to shape the town’s culture and identity.
Geography
The Silos is located in the south-central part of Montana, in the foothills of the Rocky Mountains. The town is situated in the county of Cascade, and is part of the Great Falls Metropolitan Statistical Area. The town is located at an elevation of 4,000 feet, and is surrounded by rolling hills and grasslands. The town is located near the Missouri River, and is close to the city of Great Falls.
The climate in The Silos is semi-arid, with hot summers and cold winters. The average annual temperature is around 50 degrees Fahrenheit, and the average annual precipitation is around 15 inches.
Economy
The economy of The Silos is largely based on agriculture. The town is home to several farms, which produce a variety of crops, including wheat, barley, oats, and hay. The town is also home to several livestock operations, which produce beef, pork, and poultry.
The town is also home to several small businesses, including a general store, a hardware store, and a restaurant. The town is also home to a few manufacturing companies, which produce a variety of products, including furniture, clothing, and electronics.
Demographics
The population of The Silos is approximately 1,000 people. The town is predominantly white, with a small minority population. The town is home to a large number of immigrants from Europe, including Italians, Germans, and Poles. The town also has a small Native American population.
The town has a median household income of around $40,000, and the median home value is around $150,000. The town has a low unemployment rate, and the majority of the population is employed in the agricultural and manufacturing industries.
Conclusion
The Silos is a small town located in Montana, United States. It is situated in the south-central part of the state, in the foothills of the Rocky Mountains. The town has a population of approximately 1,000 people, and is a rural community with a strong agricultural base. The town is home to several farms, which produce a variety of crops, and is also home to several small businesses. The town has a median household income of around $40,000, and the median home value is around $150,000. The town has a low unemployment rate, and the majority of the population is employed in the agricultural and manufacturing industries.
Common Questions
What is Per Capita Income in The Silos?
Per Capita income in The Silos is $44,520.
What is the Median Household income in The Silos?
Median Household Income in The Silos is $54,844.
What is Inequality or Gini Index in The Silos?
Inequality or Gini Index in The Silos is 0.33.
What is the Total Population of The Silos?
Total Population of The Silos is 474.
What is the Total Male Population of The Silos?
Total Male Population of The Silos is 218.
What is the Total Female Population of The Silos?
Total Female Population of The Silos is 256.
What is the Ratio of Males per 100 Females in The Silos?
There are 85.16 Males per 100 Females in The Silos.
What is the Ratio of Females per 100 Males in The Silos?
There are 117.43 Females per 100 Males in The Silos.
What is the Median Population Age in The Silos?
Median Population Age in The Silos is 68.3 Years.
What is the Average Family Size in The Silos
Average Family Size in The Silos is 2.1 People.
What is the Average Household Size in The Silos
Average Household Size in The Silos is 2.0 People.
How Large is the Labor Force in The Silos?
There are 213 People in the Labor Forcein in The Silos.
What is the Percentage of People in the Labor Force in The Silos?
45.3% of People are in the Labor Force in The Silos.