Zip Codes with the Highest Percentage of Population with a Degree in Computers and Mathematics in Montana
RELATED REPORTS & OPTIONS
Computers and Mathematics
Montana
Compare Zip Codes
Map of Zip Codes with the Highest Percentage of Population with a Degree in Computers and Mathematics in Montana
0.0%
40.0%
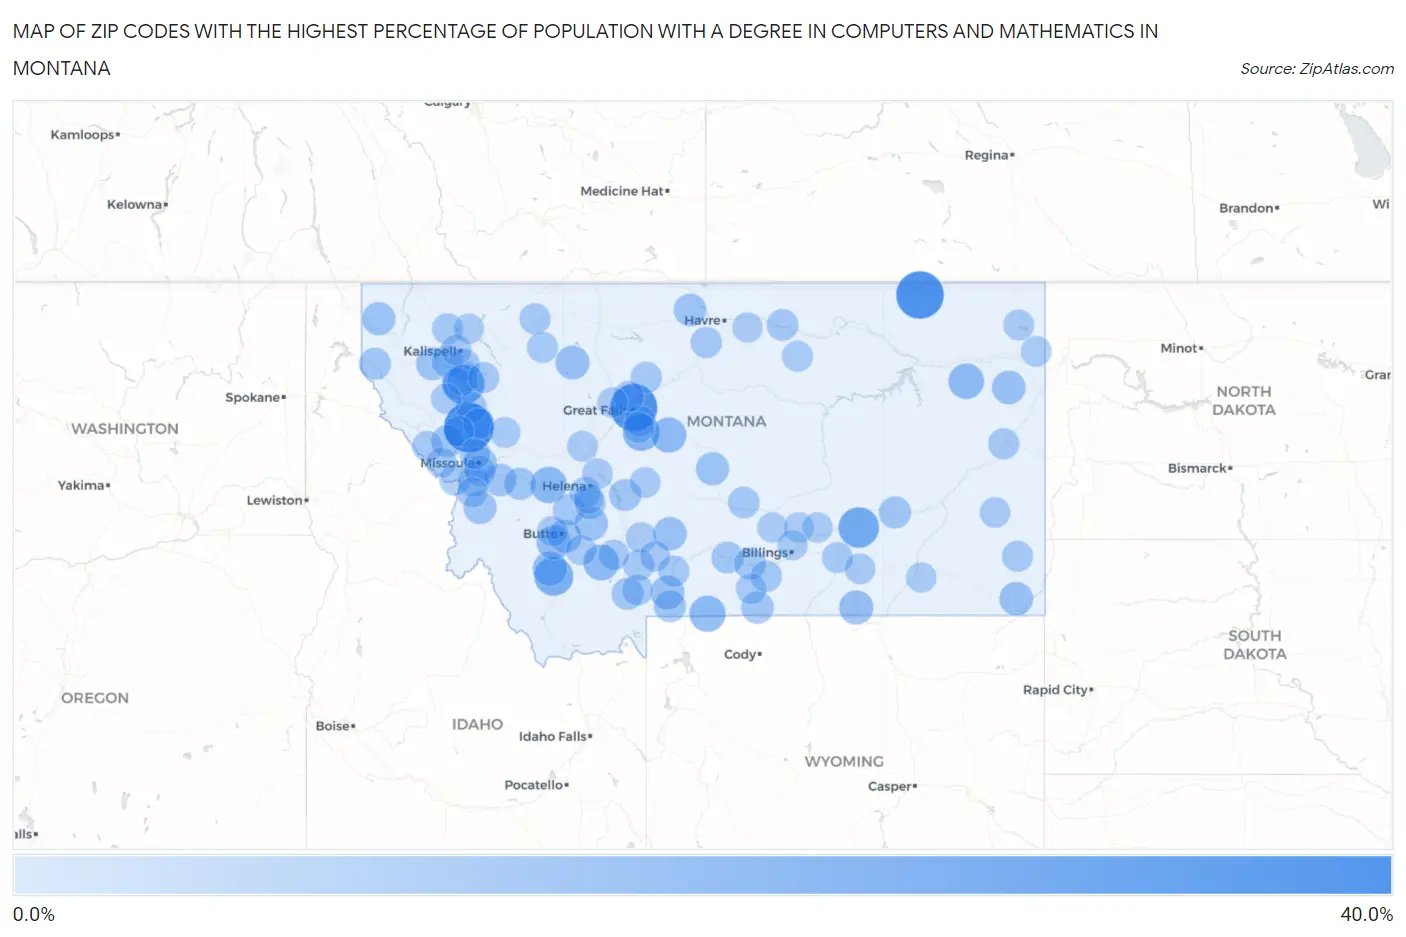
Zip Codes with the Highest Percentage of Population with a Degree in Computers and Mathematics in Montana
| Zip Code | % Graduates | vs State | vs National | |
| 1. | 59863 | 37.0% | 3.1%(+34.0)#1 | 4.9%(+32.1)#151 |
| 2. | 59240 | 33.3% | 3.1%(+30.3)#2 | 4.9%(+28.4)#194 |
| 3. | 59414 | 32.8% | 3.1%(+29.7)#3 | 4.9%(+27.9)#197 |
| 4. | 59910 | 22.6% | 3.1%(+19.6)#4 | 4.9%(+17.7)#372 |
| 5. | 59038 | 20.9% | 3.1%(+17.8)#5 | 4.9%(+16.0)#435 |
| 6. | 59732 | 18.0% | 3.1%(+14.9)#6 | 4.9%(+13.1)#563 |
| 7. | 59480 | 14.3% | 3.1%(+11.2)#7 | 4.9%(+9.39)#876 |
| 8. | 59731 | 13.3% | 3.1%(+10.3)#8 | 4.9%(+8.44)#1,009 |
| 9. | 59081 | 13.0% | 3.1%(+9.97)#9 | 4.9%(+8.15)#1,053 |
| 10. | 59735 | 12.5% | 3.1%(+9.43)#10 | 4.9%(+7.61)#1,141 |
| 11. | 59274 | 12.1% | 3.1%(+9.00)#11 | 4.9%(+7.17)#1,206 |
| 12. | 59469 | 11.5% | 3.1%(+8.47)#12 | 4.9%(+6.64)#1,323 |
| 13. | 59743 | 10.0% | 3.1%(+6.93)#13 | 4.9%(+5.11)#1,763 |
| 14. | 59750 | 9.8% | 3.1%(+6.69)#14 | 4.9%(+4.86)#1,856 |
| 15. | 59089 | 9.5% | 3.1%(+6.45)#15 | 4.9%(+4.63)#1,950 |
| 16. | 59812 | 9.1% | 3.1%(+6.02)#16 | 4.9%(+4.20)#2,186 |
| 17. | 59467 | 9.1% | 3.1%(+6.02)#17 | 4.9%(+4.20)#2,206 |
| 18. | 59065 | 8.9% | 3.1%(+5.86)#18 | 4.9%(+4.03)#2,302 |
| 19. | 59311 | 8.7% | 3.1%(+5.63)#19 | 4.9%(+3.80)#2,426 |
| 20. | 59243 | 8.6% | 3.1%(+5.53)#20 | 4.9%(+3.71)#2,473 |
| 21. | 59086 | 8.4% | 3.1%(+5.29)#21 | 4.9%(+3.47)#2,616 |
| 22. | 59632 | 8.1% | 3.1%(+5.05)#22 | 4.9%(+3.22)#2,807 |
| 23. | 59935 | 8.0% | 3.1%(+4.93)#23 | 4.9%(+3.11)#2,892 |
| 24. | 59418 | 8.0% | 3.1%(+4.93)#24 | 4.9%(+3.11)#2,901 |
| 25. | 59701 | 7.8% | 3.1%(+4.78)#25 | 4.9%(+2.96)#3,026 |
| 26. | 59828 | 7.6% | 3.1%(+4.52)#26 | 4.9%(+2.70)#3,250 |
| 27. | 59925 | 7.6% | 3.1%(+4.52)#27 | 4.9%(+2.70)#3,254 |
| 28. | 59525 | 6.9% | 3.1%(+3.83)#28 | 4.9%(+2.00)#3,956 |
| 29. | 59846 | 6.9% | 3.1%(+3.79)#29 | 4.9%(+1.97)#3,985 |
| 30. | 59825 | 6.6% | 3.1%(+3.51)#30 | 4.9%(+1.68)#4,356 |
| 31. | 59008 | 6.5% | 3.1%(+3.47)#31 | 4.9%(+1.65)#4,404 |
| 32. | 59327 | 6.4% | 3.1%(+3.30)#32 | 4.9%(+1.48)#4,659 |
| 33. | 59832 | 6.3% | 3.1%(+3.25)#33 | 4.9%(+1.43)#4,732 |
| 34. | 59932 | 6.3% | 3.1%(+3.21)#34 | 4.9%(+1.39)#4,805 |
| 35. | 59644 | 6.0% | 3.1%(+2.92)#35 | 4.9%(+1.10)#5,315 |
| 36. | 59069 | 5.8% | 3.1%(+2.73)#36 | 4.9%(+0.903)#5,679 |
| 37. | 59853 | 5.7% | 3.1%(+2.67)#37 | 4.9%(+0.844)#5,804 |
| 38. | 59030 | 5.7% | 3.1%(+2.64)#38 | 4.9%(+0.820)#5,844 |
| 39. | 59716 | 5.7% | 3.1%(+2.58)#39 | 4.9%(+0.756)#5,975 |
| 40. | 59920 | 5.3% | 3.1%(+2.28)#40 | 4.9%(+0.455)#6,645 |
| 41. | 59526 | 5.2% | 3.1%(+2.16)#41 | 4.9%(+0.333)#6,929 |
| 42. | 59019 | 5.2% | 3.1%(+2.13)#42 | 4.9%(+0.302)#6,999 |
| 43. | 59915 | 5.1% | 3.1%(+2.02)#43 | 4.9%(+0.191)#7,252 |
| 44. | 59074 | 5.1% | 3.1%(+1.99)#44 | 4.9%(+0.169)#7,301 |
| 45. | 59631 | 5.0% | 3.1%(+1.93)#45 | 4.9%(+0.106)#7,456 |
| 46. | 59041 | 4.9% | 3.1%(+1.83)#46 | 4.9%(+0.005)#7,700 |
| 47. | 59521 | 4.7% | 3.1%(+1.68)#47 | 4.9%(-0.148)#8,135 |
| 48. | 59833 | 4.7% | 3.1%(+1.62)#48 | 4.9%(-0.204)#8,295 |
| 49. | 59420 | 4.7% | 3.1%(+1.58)#49 | 4.9%(-0.243)#8,426 |
| 50. | 59417 | 4.5% | 3.1%(+1.45)#50 | 4.9%(-0.370)#8,797 |
| 51. | 59330 | 4.5% | 3.1%(+1.44)#51 | 4.9%(-0.389)#8,858 |
| 52. | 59718 | 4.5% | 3.1%(+1.43)#52 | 4.9%(-0.397)#8,883 |
| 53. | 59847 | 4.5% | 3.1%(+1.42)#53 | 4.9%(-0.406)#8,910 |
| 54. | 59864 | 4.5% | 3.1%(+1.40)#54 | 4.9%(-0.427)#8,978 |
| 55. | 59638 | 4.5% | 3.1%(+1.39)#55 | 4.9%(-0.435)#9,003 |
| 56. | 59047 | 4.4% | 3.1%(+1.35)#56 | 4.9%(-0.474)#9,122 |
| 57. | 59865 | 4.3% | 3.1%(+1.28)#57 | 4.9%(-0.546)#9,354 |
| 58. | 59937 | 4.3% | 3.1%(+1.26)#58 | 4.9%(-0.562)#9,425 |
| 59. | 59472 | 4.3% | 3.1%(+1.24)#59 | 4.9%(-0.584)#9,508 |
| 60. | 59405 | 4.2% | 3.1%(+1.10)#60 | 4.9%(-0.720)#9,916 |
| 61. | 59324 | 4.2% | 3.1%(+1.10)#61 | 4.9%(-0.727)#9,945 |
| 62. | 59914 | 4.2% | 3.1%(+1.10)#62 | 4.9%(-0.727)#9,948 |
| 63. | 59803 | 4.1% | 3.1%(+1.06)#63 | 4.9%(-0.765)#10,057 |
| 64. | 59911 | 4.1% | 3.1%(+1.02)#64 | 4.9%(-0.801)#10,159 |
| 65. | 59034 | 4.1% | 3.1%(+1.02)#65 | 4.9%(-0.804)#10,170 |
| 66. | 59601 | 4.0% | 3.1%(+0.975)#66 | 4.9%(-0.850)#10,322 |
| 67. | 59730 | 4.0% | 3.1%(+0.943)#67 | 4.9%(-0.881)#10,422 |
| 68. | 59448 | 4.0% | 3.1%(+0.931)#68 | 4.9%(-0.894)#10,461 |
| 69. | 59524 | 3.9% | 3.1%(+0.852)#69 | 4.9%(-0.972)#10,728 |
| 70. | 59070 | 3.9% | 3.1%(+0.790)#70 | 4.9%(-1.03)#10,952 |
| 71. | 59645 | 3.8% | 3.1%(+0.726)#71 | 4.9%(-1.10)#11,205 |
| 72. | 59868 | 3.8% | 3.1%(+0.693)#72 | 4.9%(-1.13)#11,317 |
| 73. | 59714 | 3.8% | 3.1%(+0.686)#73 | 4.9%(-1.14)#11,350 |
| 74. | 59022 | 3.7% | 3.1%(+0.634)#74 | 4.9%(-1.19)#11,517 |
| 75. | 59247 | 3.7% | 3.1%(+0.634)#75 | 4.9%(-1.19)#11,531 |
| 76. | 59901 | 3.7% | 3.1%(+0.625)#76 | 4.9%(-1.20)#11,558 |
| 77. | 59872 | 3.7% | 3.1%(+0.595)#77 | 4.9%(-1.23)#11,660 |
| 78. | 59715 | 3.6% | 3.1%(+0.575)#78 | 4.9%(-1.25)#11,721 |
| 79. | 59336 | 3.6% | 3.1%(+0.567)#79 | 4.9%(-1.26)#11,763 |
| 80. | 59404 | 3.6% | 3.1%(+0.530)#80 | 4.9%(-1.29)#11,890 |
| 81. | 59748 | 3.6% | 3.1%(+0.502)#81 | 4.9%(-1.32)#12,015 |
| 82. | 59648 | 3.6% | 3.1%(+0.502)#82 | 4.9%(-1.32)#12,016 |
| 83. | 59831 | 3.5% | 3.1%(+0.419)#83 | 4.9%(-1.41)#12,339 |
| 84. | 59602 | 3.5% | 3.1%(+0.388)#84 | 4.9%(-1.44)#12,453 |
| 85. | 59760 | 3.4% | 3.1%(+0.379)#85 | 4.9%(-1.45)#12,495 |
| 86. | 59845 | 3.4% | 3.1%(+0.362)#86 | 4.9%(-1.46)#12,554 |
| 87. | 59808 | 3.4% | 3.1%(+0.333)#87 | 4.9%(-1.49)#12,655 |
| 88. | 59212 | 3.4% | 3.1%(+0.320)#88 | 4.9%(-1.50)#12,698 |
| 89. | 59759 | 3.4% | 3.1%(+0.281)#89 | 4.9%(-1.54)#12,831 |
| 90. | 59487 | 3.3% | 3.1%(+0.209)#90 | 4.9%(-1.62)#13,090 |
| 91. | 59015 | 3.3% | 3.1%(+0.209)#91 | 4.9%(-1.62)#13,095 |
| 92. | 59523 | 3.1% | 3.1%(+0.074)#92 | 4.9%(-1.75)#13,570 |
| 93. | 59079 | 3.1% | 3.1%(+0.069)#93 | 4.9%(-1.76)#13,590 |
| 94. | 59088 | 3.1% | 3.1%(+0.056)#94 | 4.9%(-1.77)#13,645 |
| 95. | 59820 | 3.0% | 3.1%(-0.021)#95 | 4.9%(-1.85)#13,909 |
| 96. | 59003 | 3.0% | 3.1%(-0.057)#96 | 4.9%(-1.88)#14,058 |
| 97. | 59105 | 3.0% | 3.1%(-0.060)#97 | 4.9%(-1.88)#14,067 |
| 98. | 59634 | 3.0% | 3.1%(-0.082)#98 | 4.9%(-1.91)#14,132 |
| 99. | 59870 | 3.0% | 3.1%(-0.102)#99 | 4.9%(-1.93)#14,190 |
| 100. | 59912 | 3.0% | 3.1%(-0.103)#100 | 4.9%(-1.93)#14,192 |
Common Questions
What are the Top 10 Zip Codes with the Highest Percentage of Population with a Degree in Computers and Mathematics in Montana?
Top 10 Zip Codes with the Highest Percentage of Population with a Degree in Computers and Mathematics in Montana are:
What zip code has the Highest Percentage of Population with a Degree in Computers and Mathematics in Montana?
59863 has the Highest Percentage of Population with a Degree in Computers and Mathematics in Montana with 37.0%.
What is the Percentage of Population with a Degree in Computers and Mathematics in the State of Montana?
Percentage of Population with a Degree in Computers and Mathematics in Montana is 3.1%.
What is the Percentage of Population with a Degree in Computers and Mathematics in the United States?
Percentage of Population with a Degree in Computers and Mathematics in the United States is 4.9%.