Broadview, MT Map & Demographics
Broadview Map
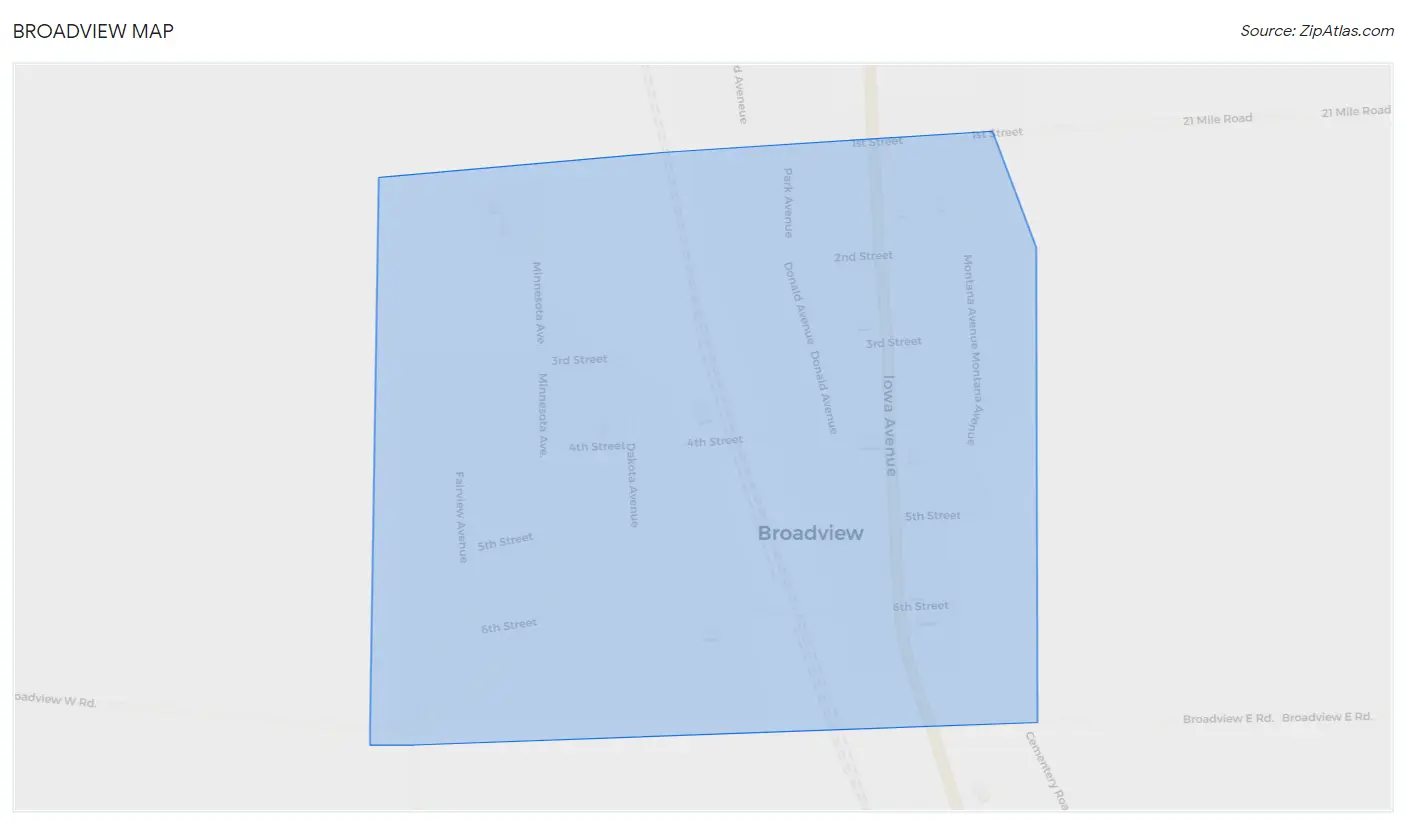
Broadview Overview
$29,245
PER CAPITA INCOME
$74,821
AVG FAMILY INCOME
$60,313
AVG HOUSEHOLD INCOME
0.35
INEQUALITY / GINI INDEX
202
TOTAL POPULATION
108
MALE POPULATION
94
FEMALE POPULATION
114.89
MALES / 100 FEMALES
87.04
FEMALES / 100 MALES
45.6
MEDIAN AGE
3.0
AVG FAMILY SIZE
2.4
AVG HOUSEHOLD SIZE
129
LABOR FORCE [ PEOPLE ]
70.9%
PERCENT IN LABOR FORCE
4.7%
UNEMPLOYMENT RATE
Broadview Zip Codes
Broadview Area Codes
Income in Broadview
Income Overview in Broadview
Per Capita Income in Broadview is $29,245, while median incomes of families and households are $74,821 and $60,313 respectively.
| Characteristic | Number | Measure |
| Per Capita Income | 202 | $29,245 |
| Median Family Income | 57 | $74,821 |
| Mean Family Income | 57 | $83,868 |
| Median Household Income | 85 | $60,313 |
| Mean Household Income | 85 | $66,531 |
| Income Deficit | 57 | $0 |
| Wage / Income Gap (%) | 202 | 0.00% |
| Wage / Income Gap ($) | 202 | 100.00¢ per $1 |
| Gini / Inequality Index | 202 | 0.35 |
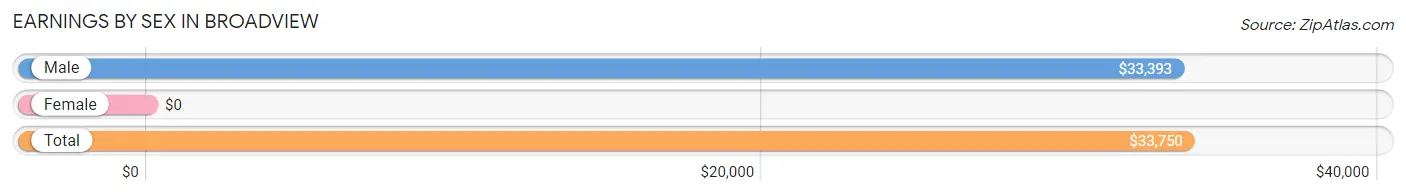
Earnings by Sex in Broadview
| Sex | Number | Average Earnings |
| Male | 81 (62.8%) | $33,393 |
| Female | 48 (37.2%) | $0 |
| Total | 129 (100.0%) | $33,750 |
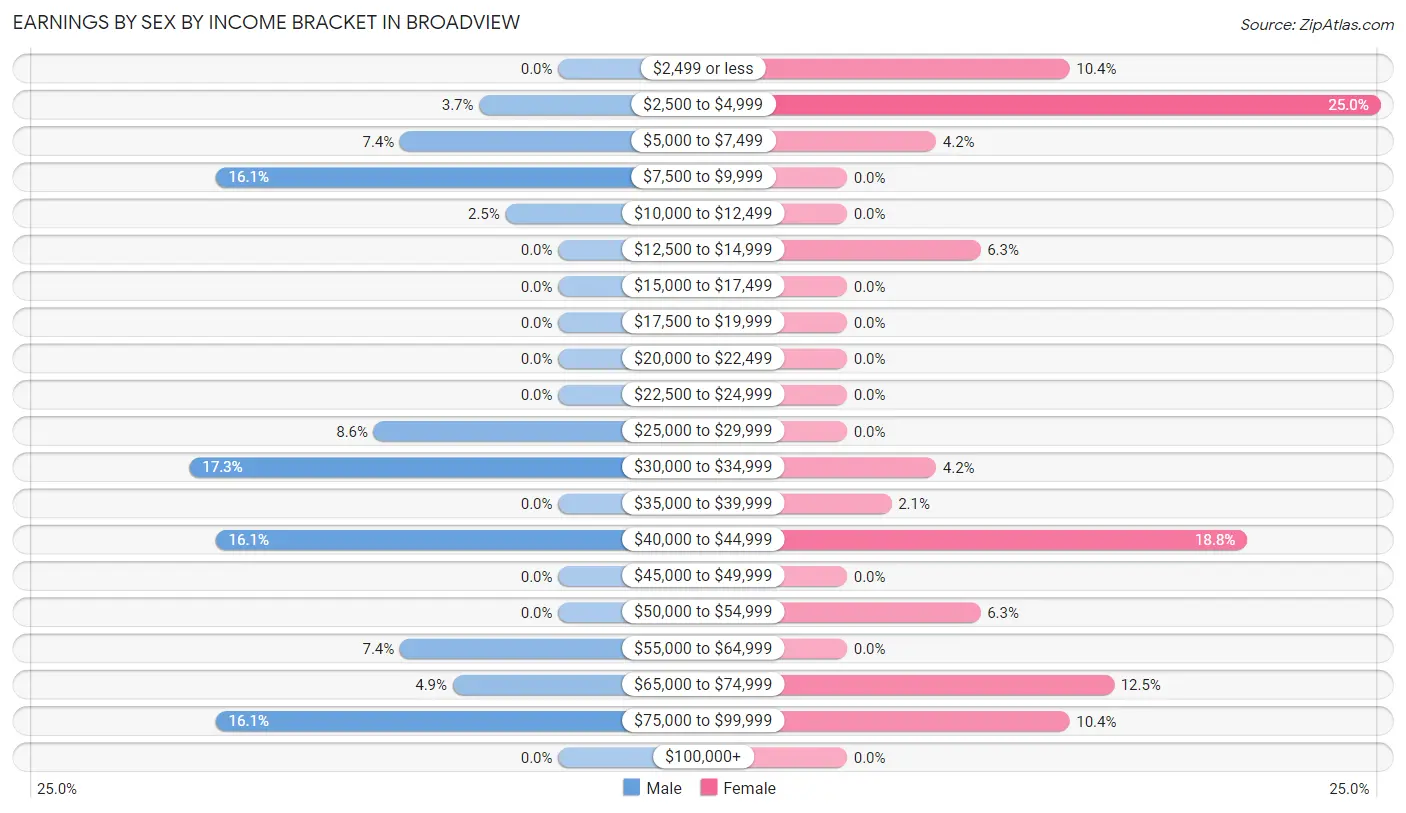
Earnings by Sex by Income Bracket in Broadview
The most common earnings brackets in Broadview are $30,000 to $34,999 for men (14 | 17.3%) and $2,500 to $4,999 for women (12 | 25.0%).
| Income | Male | Female |
| $2,499 or less | 0 (0.0%) | 5 (10.4%) |
| $2,500 to $4,999 | 3 (3.7%) | 12 (25.0%) |
| $5,000 to $7,499 | 6 (7.4%) | 2 (4.2%) |
| $7,500 to $9,999 | 13 (16.1%) | 0 (0.0%) |
| $10,000 to $12,499 | 2 (2.5%) | 0 (0.0%) |
| $12,500 to $14,999 | 0 (0.0%) | 3 (6.2%) |
| $15,000 to $17,499 | 0 (0.0%) | 0 (0.0%) |
| $17,500 to $19,999 | 0 (0.0%) | 0 (0.0%) |
| $20,000 to $22,499 | 0 (0.0%) | 0 (0.0%) |
| $22,500 to $24,999 | 0 (0.0%) | 0 (0.0%) |
| $25,000 to $29,999 | 7 (8.6%) | 0 (0.0%) |
| $30,000 to $34,999 | 14 (17.3%) | 2 (4.2%) |
| $35,000 to $39,999 | 0 (0.0%) | 1 (2.1%) |
| $40,000 to $44,999 | 13 (16.1%) | 9 (18.8%) |
| $45,000 to $49,999 | 0 (0.0%) | 0 (0.0%) |
| $50,000 to $54,999 | 0 (0.0%) | 3 (6.2%) |
| $55,000 to $64,999 | 6 (7.4%) | 0 (0.0%) |
| $65,000 to $74,999 | 4 (4.9%) | 6 (12.5%) |
| $75,000 to $99,999 | 13 (16.1%) | 5 (10.4%) |
| $100,000+ | 0 (0.0%) | 0 (0.0%) |
| Total | 81 (100.0%) | 48 (100.0%) |
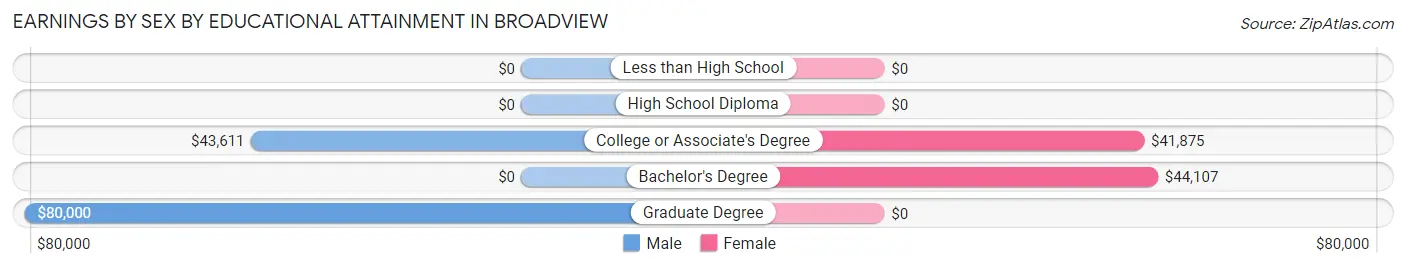
Earnings by Sex by Educational Attainment in Broadview
Average earnings in Broadview are $42,614 for men and $44,107 for women, a difference of 3.4%. Men with an educational attainment of graduate degree enjoy the highest average annual earnings of $80,000, while those with college or associate's degree education earn the least with $43,611. Women with an educational attainment of bachelor's degree earn the most with the average annual earnings of $44,107, while those with college or associate's degree education have the smallest earnings of $41,875.
| Educational Attainment | Male Income | Female Income |
| Less than High School | - | - |
| High School Diploma | - | - |
| College or Associate's Degree | $43,611 | $41,875 |
| Bachelor's Degree | - | - |
| Graduate Degree | $80,000 | $0 |
| Total | $42,614 | $44,107 |
Family Income in Broadview
Family Income Brackets in Broadview
According to the Broadview family income data, there are 19 families falling into the $50,000 to $74,999 income range, which is the most common income bracket and makes up 33.3% of all families.
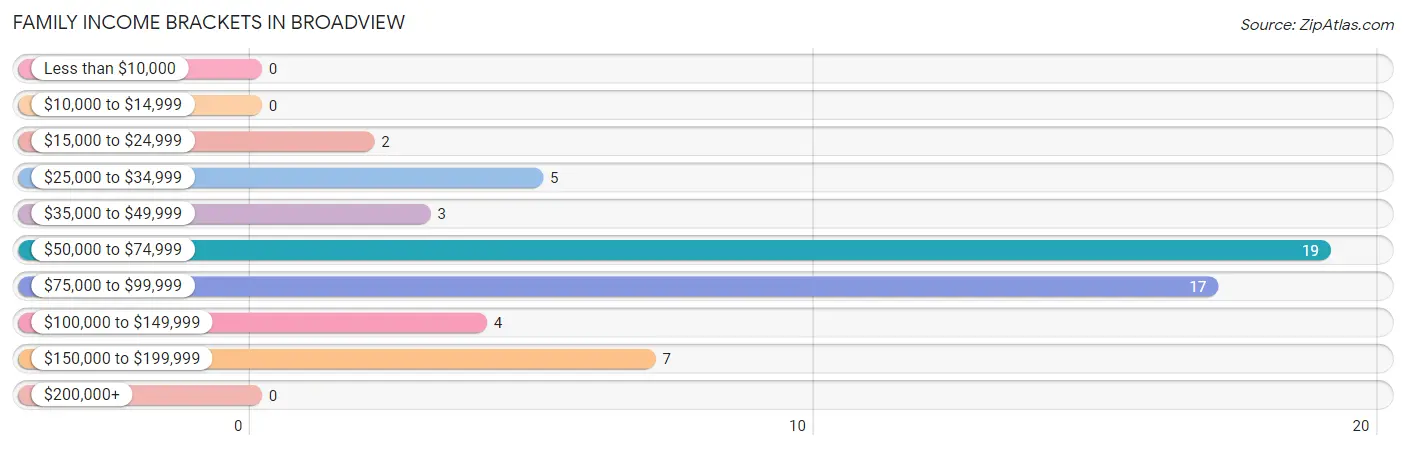
| Income Bracket | # Families | % Families |
| Less than $10,000 | 0 | 0.0% |
| $10,000 to $14,999 | 0 | 0.0% |
| $15,000 to $24,999 | 2 | 3.5% |
| $25,000 to $34,999 | 5 | 8.8% |
| $35,000 to $49,999 | 3 | 5.3% |
| $50,000 to $74,999 | 19 | 33.3% |
| $75,000 to $99,999 | 17 | 29.8% |
| $100,000 to $149,999 | 4 | 7.0% |
| $150,000 to $199,999 | 7 | 12.3% |
| $200,000+ | 0 | 0.0% |
Family Income by Famaliy Size in Broadview
2-person families (31 | 54.4%) account for the highest median family income in Broadview with $79,375 per family, while 2-person families (31 | 54.4%) have the highest median income of $39,688 per family member.
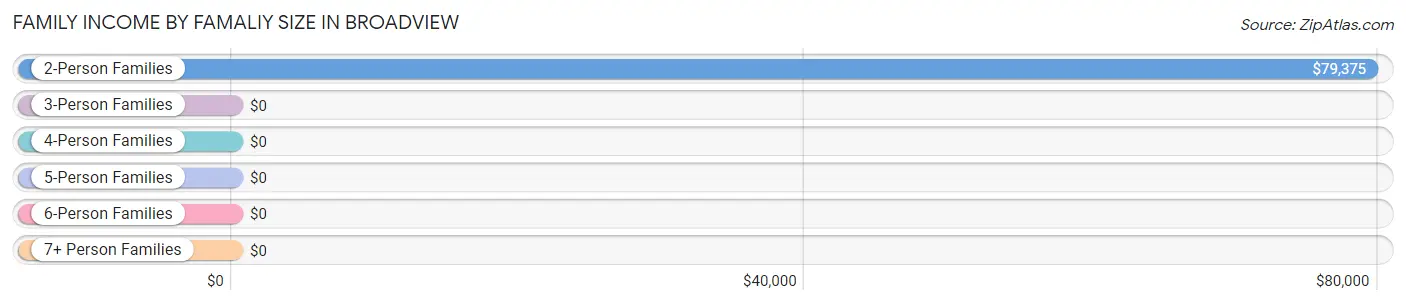
| Income Bracket | # Families | Median Income |
| 2-Person Families | 31 (54.4%) | $79,375 |
| 3-Person Families | 9 (15.8%) | $0 |
| 4-Person Families | 13 (22.8%) | $0 |
| 5-Person Families | 0 (0.0%) | $0 |
| 6-Person Families | 2 (3.5%) | $0 |
| 7+ Person Families | 2 (3.5%) | $0 |
| Total | 57 (100.0%) | $74,821 |
Family Income by Number of Earners in Broadview
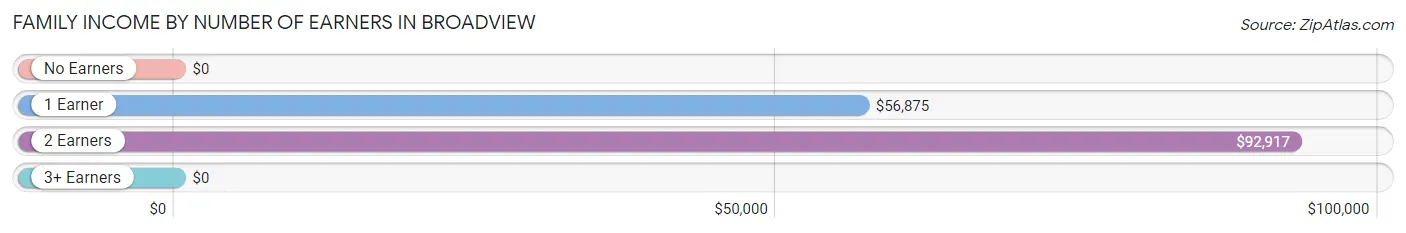
| Number of Earners | # Families | Median Income |
| No Earners | 5 (8.8%) | $0 |
| 1 Earner | 15 (26.3%) | $56,875 |
| 2 Earners | 25 (43.9%) | $92,917 |
| 3+ Earners | 12 (21.0%) | $0 |
| Total | 57 (100.0%) | $74,821 |
Household Income in Broadview
Household Income Brackets in Broadview
With 21 households falling in the category, the $50,000 to $74,999 income range is the most frequent in Broadview, accounting for 24.7% of all households.
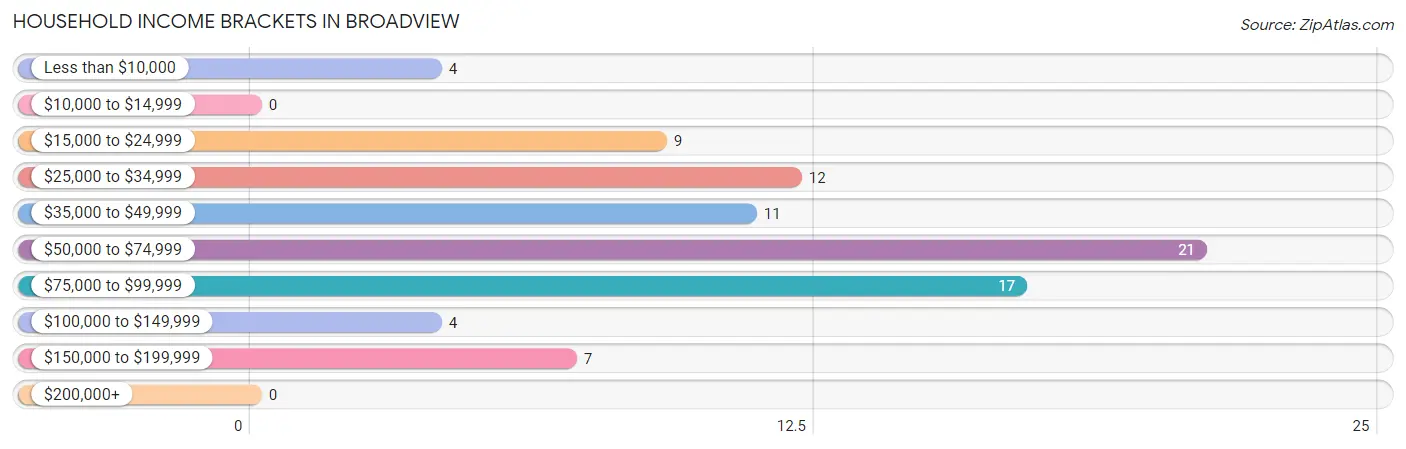
| Income Bracket | # Households | % Households |
| Less than $10,000 | 4 | 4.7% |
| $10,000 to $14,999 | 0 | 0.0% |
| $15,000 to $24,999 | 9 | 10.6% |
| $25,000 to $34,999 | 12 | 14.1% |
| $35,000 to $49,999 | 11 | 12.9% |
| $50,000 to $74,999 | 21 | 24.7% |
| $75,000 to $99,999 | 17 | 20.0% |
| $100,000 to $149,999 | 4 | 4.7% |
| $150,000 to $199,999 | 7 | 8.2% |
| $200,000+ | 0 | 0.0% |
Household Income by Householder Age in Broadview
The median household income in Broadview is $60,313, with the highest median household income of $74,464 found in the 25 to 44 years age bracket for the primary householder. A total of 25 households (29.4%) fall into this category. Meanwhile, the 15 to 24 years age bracket for the primary householder has the lowest median household income of $0, with 2 households (2.4%) in this group.
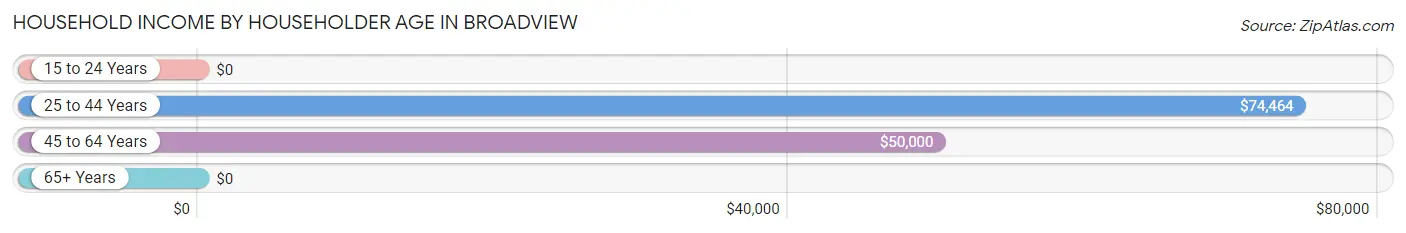
| Income Bracket | # Households | Median Income |
| 15 to 24 Years | 2 (2.4%) | $0 |
| 25 to 44 Years | 25 (29.4%) | $74,464 |
| 45 to 64 Years | 44 (51.8%) | $50,000 |
| 65+ Years | 14 (16.5%) | $0 |
| Total | 85 (100.0%) | $60,313 |
Poverty in Broadview
Income Below Poverty by Sex and Age in Broadview
With 17.6% poverty level for males and 23.4% for females among the residents of Broadview, 6 to 11 year old males and under 5 year old females are the most vulnerable to poverty, with 2 males (50.0%) and 1 females (100.0%) in their respective age groups living below the poverty level.
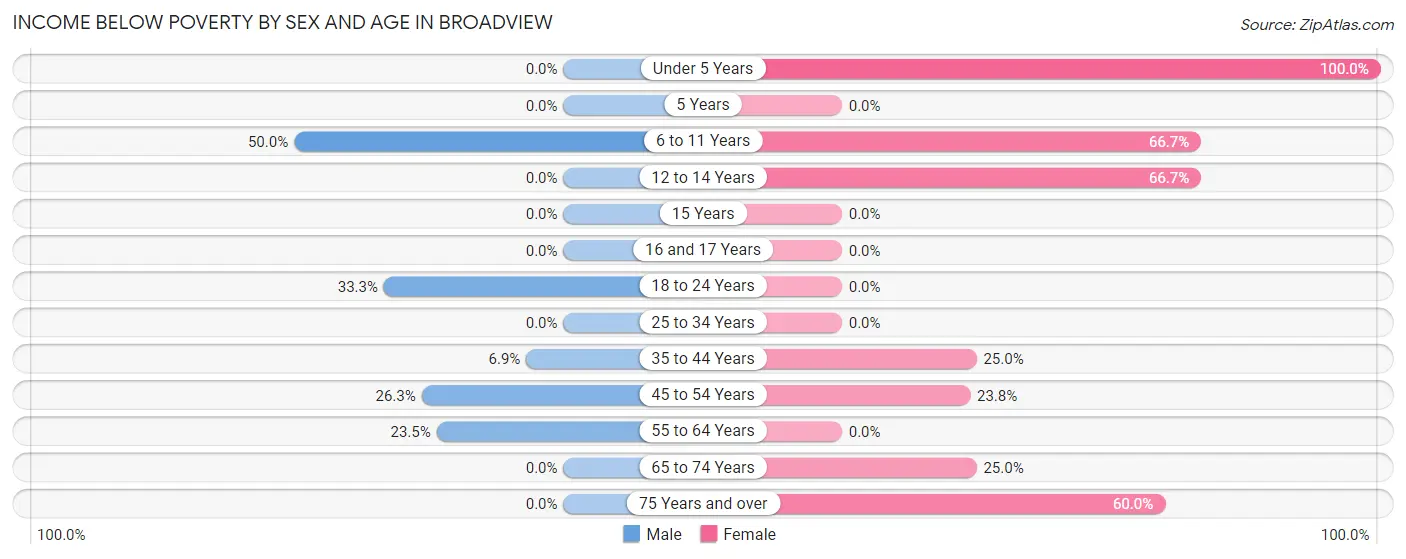
| Age Bracket | Male | Female |
| Under 5 Years | 0 (0.0%) | 1 (100.0%) |
| 5 Years | 0 (0.0%) | 0 (0.0%) |
| 6 to 11 Years | 2 (50.0%) | 2 (66.7%) |
| 12 to 14 Years | 0 (0.0%) | 4 (66.7%) |
| 15 Years | 0 (0.0%) | 0 (0.0%) |
| 16 and 17 Years | 0 (0.0%) | 0 (0.0%) |
| 18 to 24 Years | 6 (33.3%) | 0 (0.0%) |
| 25 to 34 Years | 0 (0.0%) | 0 (0.0%) |
| 35 to 44 Years | 2 (6.9%) | 2 (25.0%) |
| 45 to 54 Years | 5 (26.3%) | 5 (23.8%) |
| 55 to 64 Years | 4 (23.5%) | 0 (0.0%) |
| 65 to 74 Years | 0 (0.0%) | 2 (25.0%) |
| 75 Years and over | 0 (0.0%) | 6 (60.0%) |
| Total | 19 (17.6%) | 22 (23.4%) |
Income Above Poverty by Sex and Age in Broadview
According to the poverty statistics in Broadview, males aged under 5 years and females aged 5 years are the age groups that are most secure financially, with 100.0% of males and 100.0% of females in these age groups living above the poverty line.
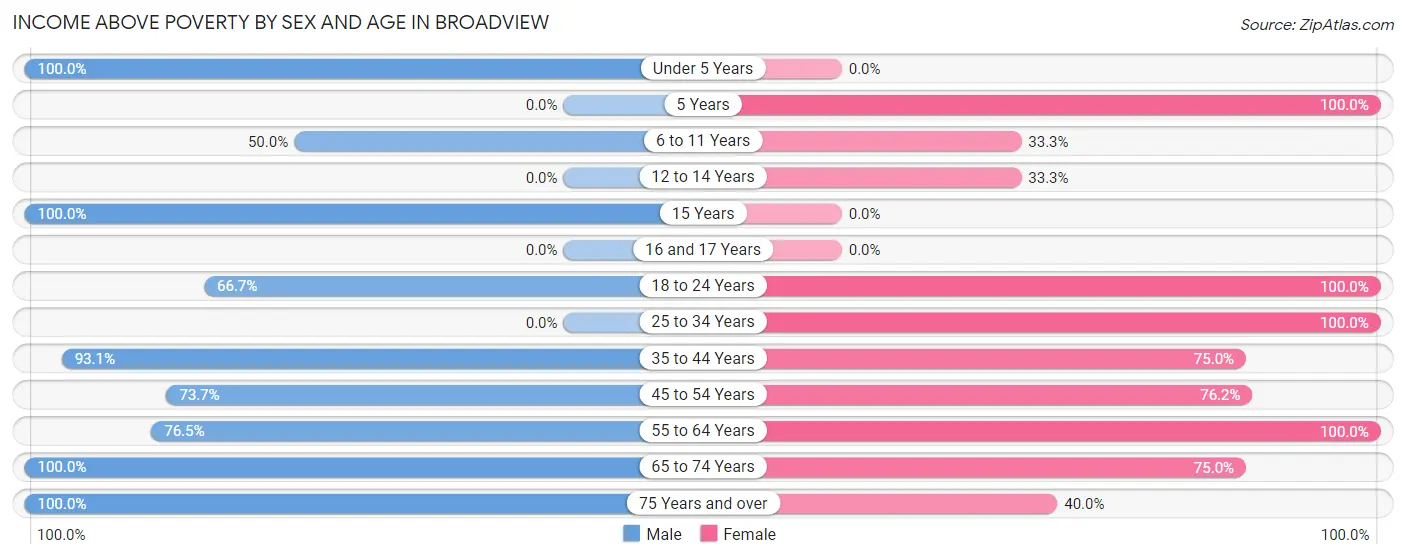
| Age Bracket | Male | Female |
| Under 5 Years | 2 (100.0%) | 0 (0.0%) |
| 5 Years | 0 (0.0%) | 1 (100.0%) |
| 6 to 11 Years | 2 (50.0%) | 1 (33.3%) |
| 12 to 14 Years | 0 (0.0%) | 2 (33.3%) |
| 15 Years | 3 (100.0%) | 0 (0.0%) |
| 16 and 17 Years | 0 (0.0%) | 0 (0.0%) |
| 18 to 24 Years | 12 (66.7%) | 19 (100.0%) |
| 25 to 34 Years | 0 (0.0%) | 1 (100.0%) |
| 35 to 44 Years | 27 (93.1%) | 6 (75.0%) |
| 45 to 54 Years | 14 (73.7%) | 16 (76.2%) |
| 55 to 64 Years | 13 (76.5%) | 16 (100.0%) |
| 65 to 74 Years | 12 (100.0%) | 6 (75.0%) |
| 75 Years and over | 4 (100.0%) | 4 (40.0%) |
| Total | 89 (82.4%) | 72 (76.6%) |
Income Below Poverty Among Married-Couple Families in Broadview
The poverty statistics for married-couple families in Broadview show that 18.4% or 7 of the total 38 families live below the poverty line. Families with 5 or more children have the highest poverty rate of 100.0%, comprising of 2 families. On the other hand, families with 1 or 2 children have the lowest poverty rate of 0.0%, which includes 0 families.
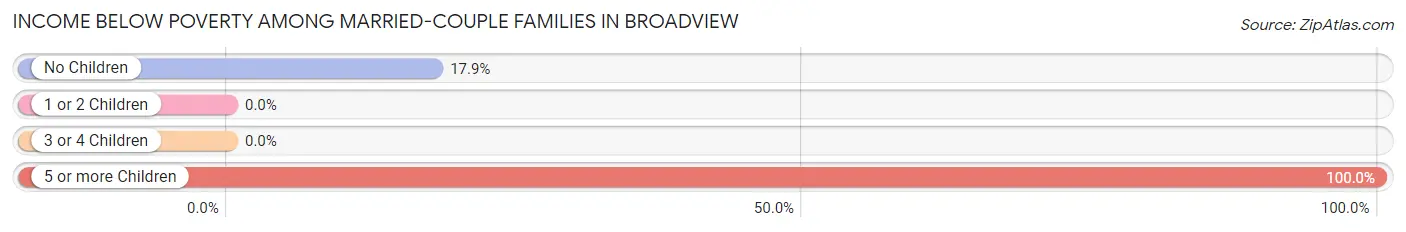
| Children | Above Poverty | Below Poverty |
| No Children | 23 (82.1%) | 5 (17.9%) |
| 1 or 2 Children | 6 (100.0%) | 0 (0.0%) |
| 3 or 4 Children | 2 (100.0%) | 0 (0.0%) |
| 5 or more Children | 0 (0.0%) | 2 (100.0%) |
| Total | 31 (81.6%) | 7 (18.4%) |
Income Below Poverty Among Single-Parent Households in Broadview
| Children | Single Father | Single Mother |
| No Children | 0 (0.0%) | 0 (0.0%) |
| 1 or 2 Children | 0 (0.0%) | 0 (0.0%) |
| 3 or 4 Children | 0 (0.0%) | 0 (0.0%) |
| 5 or more Children | 0 (0.0%) | 0 (0.0%) |
| Total | 0 (0.0%) | 0 (0.0%) |
Income Below Poverty Among Married-Couple vs Single-Parent Households in Broadview
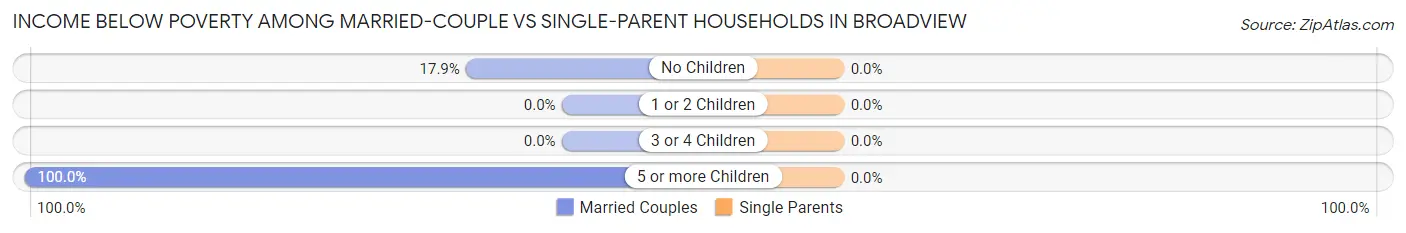
| Children | Married-Couple Families | Single-Parent Households |
| No Children | 5 (17.9%) | 0 (0.0%) |
| 1 or 2 Children | 0 (0.0%) | 0 (0.0%) |
| 3 or 4 Children | 0 (0.0%) | 0 (0.0%) |
| 5 or more Children | 2 (100.0%) | 0 (0.0%) |
| Total | 7 (18.4%) | 0 (0.0%) |
Race in Broadview
The most populous races in Broadview are White / Caucasian (176 | 87.1%), Two or more Races (14 | 6.9%), and Native / Alaskan (12 | 5.9%).
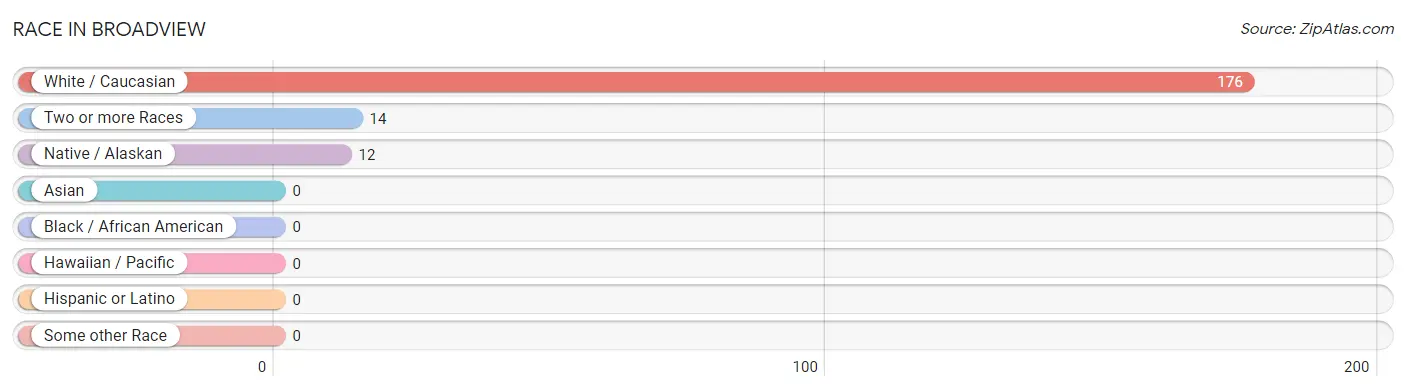
| Race | # Population | % Population |
| Asian | 0 | 0.0% |
| Black / African American | 0 | 0.0% |
| Hawaiian / Pacific | 0 | 0.0% |
| Hispanic or Latino | 0 | 0.0% |
| Native / Alaskan | 12 | 5.9% |
| White / Caucasian | 176 | 87.1% |
| Two or more Races | 14 | 6.9% |
| Some other Race | 0 | 0.0% |
| Total | 202 | 100.0% |
Ancestry in Broadview
The most populous ancestries reported in Broadview are German (92 | 45.5%), English (31 | 15.3%), Irish (29 | 14.4%), American (22 | 10.9%), and Danish (13 | 6.4%), together accounting for 92.6% of all Broadview residents.
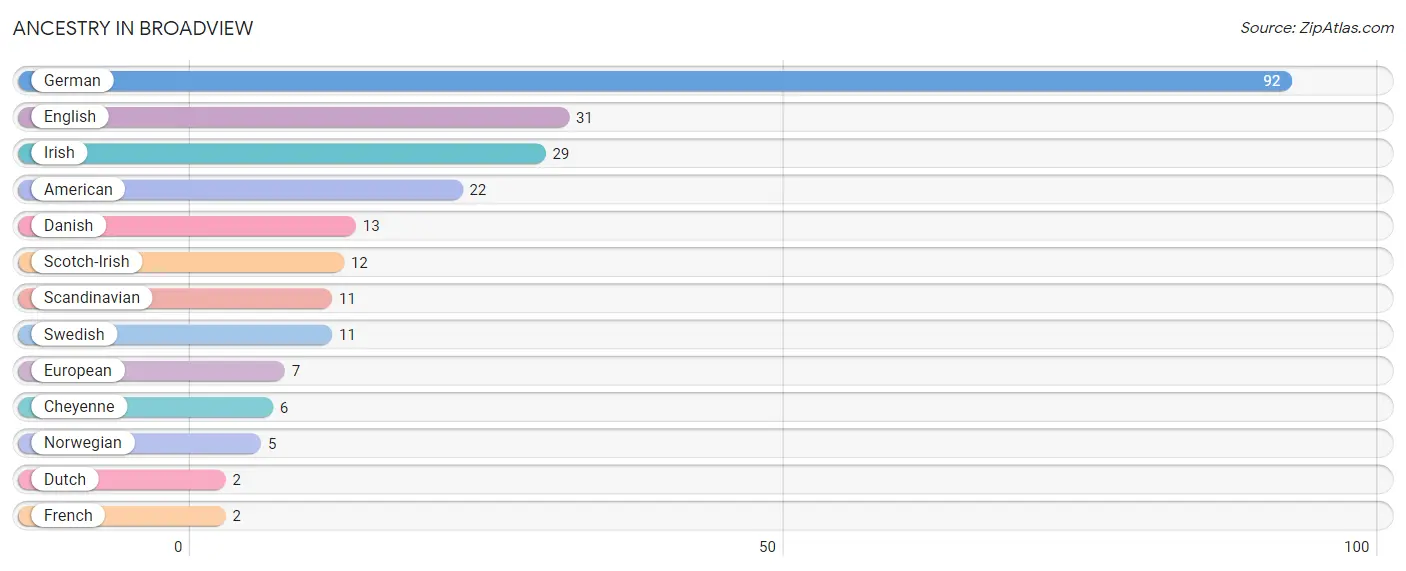
| Ancestry | # Population | % Population |
| American | 22 | 10.9% |
| Cheyenne | 6 | 3.0% |
| Danish | 13 | 6.4% |
| Dutch | 2 | 1.0% |
| English | 31 | 15.3% |
| European | 7 | 3.5% |
| French | 2 | 1.0% |
| German | 92 | 45.5% |
| Irish | 29 | 14.4% |
| Norwegian | 5 | 2.5% |
| Scandinavian | 11 | 5.4% |
| Scotch-Irish | 12 | 5.9% |
| Swedish | 11 | 5.4% | View All 13 Rows |
Immigrants in Broadview
The most numerous immigrant groups reported in Broadview came from , and Canada (2 | 1.0%), together accounting for 1.0% of all Broadview residents.

| Immigration Origin | # Population | % Population |
| Canada | 2 | 1.0% | View All 1 Rows |
Sex and Age in Broadview
Sex and Age in Broadview
The most populous age groups in Broadview are 15 to 19 Years (19 | 17.6%) for men and 45 to 49 Years (15 | 16.0%) for women.
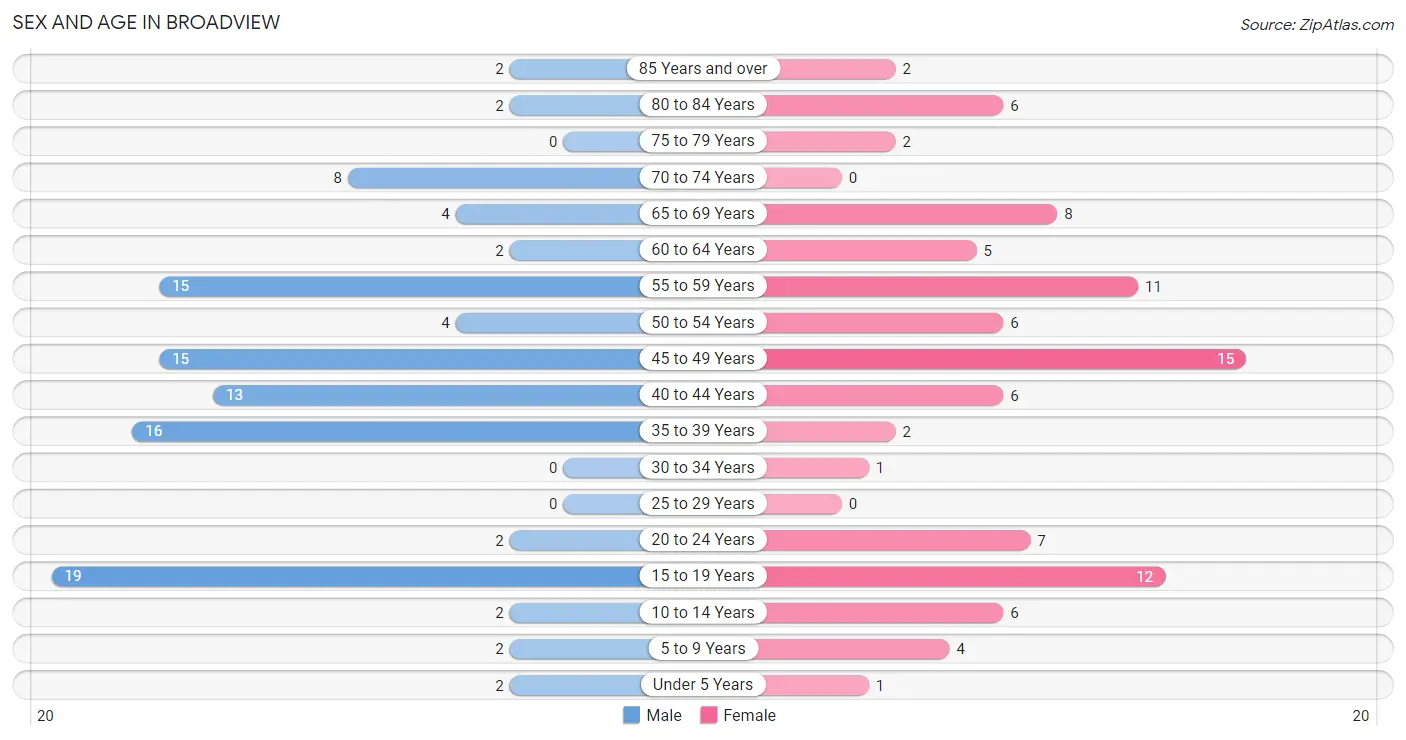
| Age Bracket | Male | Female |
| Under 5 Years | 2 (1.8%) | 1 (1.1%) |
| 5 to 9 Years | 2 (1.8%) | 4 (4.3%) |
| 10 to 14 Years | 2 (1.8%) | 6 (6.4%) |
| 15 to 19 Years | 19 (17.6%) | 12 (12.8%) |
| 20 to 24 Years | 2 (1.8%) | 7 (7.4%) |
| 25 to 29 Years | 0 (0.0%) | 0 (0.0%) |
| 30 to 34 Years | 0 (0.0%) | 1 (1.1%) |
| 35 to 39 Years | 16 (14.8%) | 2 (2.1%) |
| 40 to 44 Years | 13 (12.0%) | 6 (6.4%) |
| 45 to 49 Years | 15 (13.9%) | 15 (16.0%) |
| 50 to 54 Years | 4 (3.7%) | 6 (6.4%) |
| 55 to 59 Years | 15 (13.9%) | 11 (11.7%) |
| 60 to 64 Years | 2 (1.8%) | 5 (5.3%) |
| 65 to 69 Years | 4 (3.7%) | 8 (8.5%) |
| 70 to 74 Years | 8 (7.4%) | 0 (0.0%) |
| 75 to 79 Years | 0 (0.0%) | 2 (2.1%) |
| 80 to 84 Years | 2 (1.8%) | 6 (6.4%) |
| 85 Years and over | 2 (1.8%) | 2 (2.1%) |
| Total | 108 (100.0%) | 94 (100.0%) |
Families and Households in Broadview
Median Family Size in Broadview
The median family size in Broadview is 3.04 persons per family, with married-couple families (38 | 66.7%) accounting for the largest median family size of 3.5 persons per family. On the other hand, single male/father families (18 | 31.6%) represent the smallest median family size with 2.06 persons per family.
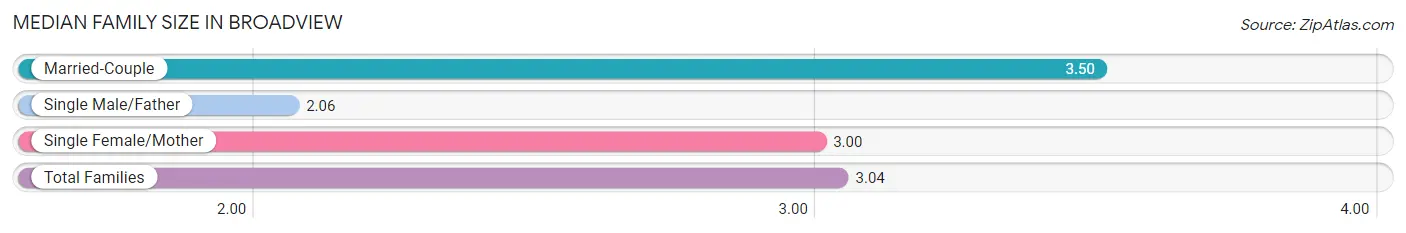
| Family Type | # Families | Family Size |
| Married-Couple | 38 (66.7%) | 3.50 |
| Single Male/Father | 18 (31.6%) | 2.06 |
| Single Female/Mother | 1 (1.8%) | 3.00 |
| Total Families | 57 (100.0%) | 3.04 |
Median Household Size in Broadview
The median household size in Broadview is 2.38 persons per household, with married-couple households (38 | 44.7%) accounting for the largest median household size of 3.5 persons per household. non-family households (28 | 32.9%) represent the smallest median household size with 1.04 persons per household.
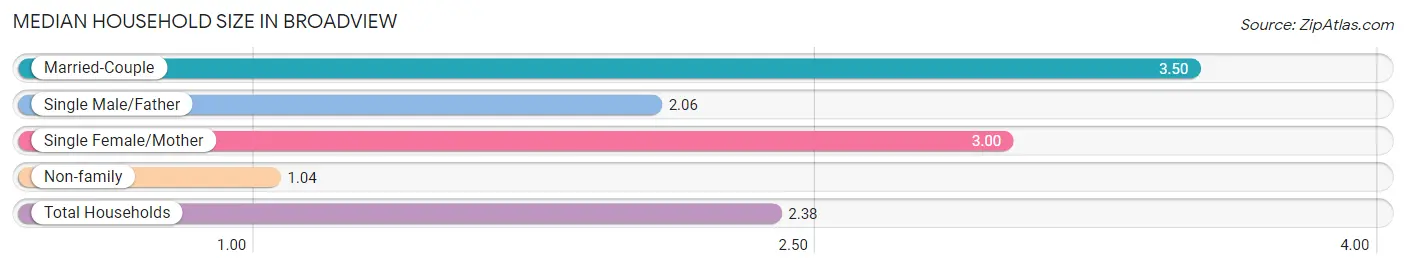
| Household Type | # Households | Household Size |
| Married-Couple | 38 (44.7%) | 3.50 |
| Single Male/Father | 18 (21.2%) | 2.06 |
| Single Female/Mother | 1 (1.2%) | 3.00 |
| Non-family | 28 (32.9%) | 1.04 |
| Total Households | 85 (100.0%) | 2.38 |
Household Size by Marriage Status in Broadview
Out of a total of 85 households in Broadview, 57 (67.1%) are family households, while 28 (32.9%) are nonfamily households. The most numerous type of family households are 2-person households, comprising 31, and the most common type of nonfamily households are 1-person households, comprising 26.
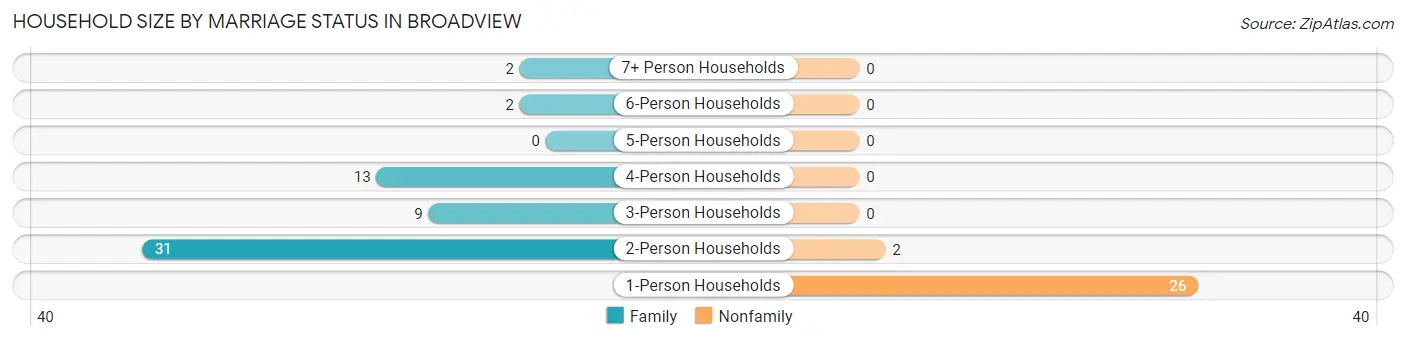
| Household Size | Family Households | Nonfamily Households |
| 1-Person Households | - | 26 (30.6%) |
| 2-Person Households | 31 (36.5%) | 2 (2.4%) |
| 3-Person Households | 9 (10.6%) | 0 (0.0%) |
| 4-Person Households | 13 (15.3%) | 0 (0.0%) |
| 5-Person Households | 0 (0.0%) | 0 (0.0%) |
| 6-Person Households | 2 (2.4%) | 0 (0.0%) |
| 7+ Person Households | 2 (2.4%) | 0 (0.0%) |
| Total | 57 (67.1%) | 28 (32.9%) |
Female Fertility in Broadview
Fertility by Age in Broadview
| Age Bracket | Women with Births | Births / 1,000 Women |
| 15 to 19 years | 0 (0.0%) | 0.0 |
| 20 to 34 years | 0 (0.0%) | 0.0 |
| 35 to 50 years | 0 (0.0%) | 0.0 |
| Total | 0 (0.0%) | 0.0 |
Fertility by Age by Marriage Status in Broadview
| Age Bracket | Married | Unmarried |
| 15 to 19 years | 0 (0.0%) | 0 (0.0%) |
| 20 to 34 years | 0 (0.0%) | 0 (0.0%) |
| 35 to 50 years | 0 (0.0%) | 0 (0.0%) |
| Total | 0 (0.0%) | 0 (0.0%) |
Fertility by Education in Broadview
| Educational Attainment | Women with Births | Births / 1,000 Women |
| Less than High School | 0 (0.0%) | 0.0 |
| High School Diploma | 0 (0.0%) | 0.0 |
| College or Associate's Degree | 0 (0.0%) | 0.0 |
| Bachelor's Degree | 0 (0.0%) | 0.0 |
| Graduate Degree | 0 (0.0%) | 0.0 |
| Total | 0 (0.0%) | 0.0 |
Fertility by Education by Marriage Status in Broadview
| Educational Attainment | Married | Unmarried |
| Less than High School | 0 (0.0%) | 0 (0.0%) |
| High School Diploma | 0 (0.0%) | 0 (0.0%) |
| College or Associate's Degree | 0 (0.0%) | 0 (0.0%) |
| Bachelor's Degree | 0 (0.0%) | 0 (0.0%) |
| Graduate Degree | 0 (0.0%) | 0 (0.0%) |
| Total | 0 (0.0%) | 0 (0.0%) |
Employment Characteristics in Broadview
Employment by Class of Employer in Broadview
Among the 112 employed individuals in Broadview, private company employees (78 | 69.6%), local government employees (8 | 7.1%), and not-for-profit organizations (7 | 6.2%) make up the most common classes of employment.
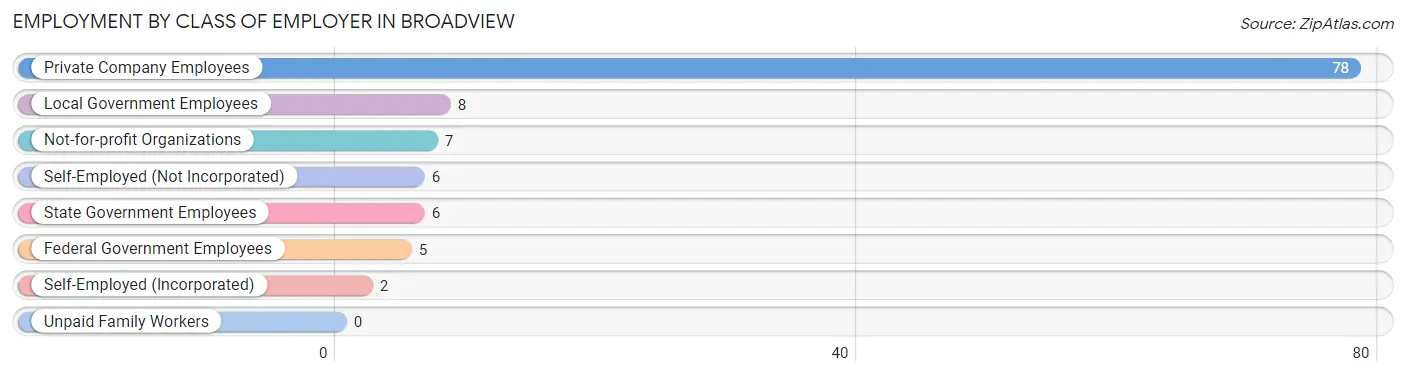
| Employer Class | # Employees | % Employees |
| Private Company Employees | 78 | 69.6% |
| Self-Employed (Incorporated) | 2 | 1.8% |
| Self-Employed (Not Incorporated) | 6 | 5.4% |
| Not-for-profit Organizations | 7 | 6.2% |
| Local Government Employees | 8 | 7.1% |
| State Government Employees | 6 | 5.4% |
| Federal Government Employees | 5 | 4.5% |
| Unpaid Family Workers | 0 | 0.0% |
| Total | 112 | 100.0% |
Employment Status by Age in Broadview
According to the labor force statistics for Broadview, out of the total population over 16 years of age (182), 70.9% or 129 individuals are in the labor force, with 4.7% or 6 of them unemployed. The age group with the highest labor force participation rate is 30 to 34 years, with 100.0% or 1 individuals in the labor force. Within the labor force, the 45 to 54 years age range has the highest percentage of unemployed individuals, with 15.0% or 6 of them being unemployed.
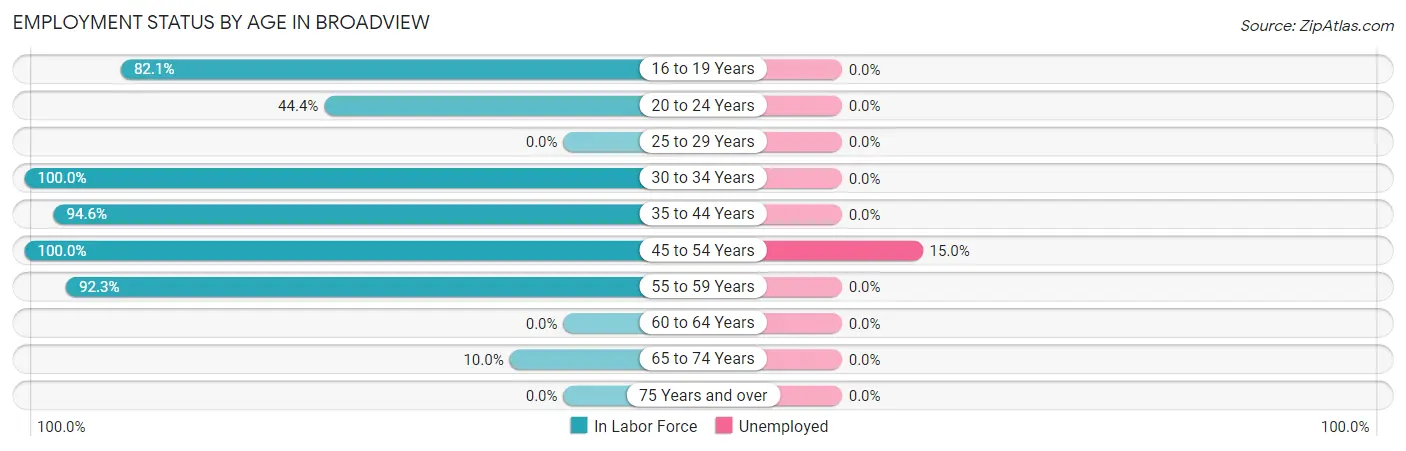
| Age Bracket | In Labor Force | Unemployed |
| 16 to 19 Years | 23 (82.1%) | 0 (0.0%) |
| 20 to 24 Years | 4 (44.4%) | 0 (0.0%) |
| 25 to 29 Years | 0 (0.0%) | 0 (0.0%) |
| 30 to 34 Years | 1 (100.0%) | 0 (0.0%) |
| 35 to 44 Years | 35 (94.6%) | 0 (0.0%) |
| 45 to 54 Years | 40 (100.0%) | 6 (15.0%) |
| 55 to 59 Years | 24 (92.3%) | 0 (0.0%) |
| 60 to 64 Years | 0 (0.0%) | 0 (0.0%) |
| 65 to 74 Years | 2 (10.0%) | 0 (0.0%) |
| 75 Years and over | 0 (0.0%) | 0 (0.0%) |
| Total | 129 (70.9%) | 6 (4.7%) |
Employment Status by Educational Attainment in Broadview
According to labor force statistics for Broadview, 90.1% of individuals (100) out of the total population between 25 and 64 years of age (111) are in the labor force, with 6.0% or 6 of them being unemployed. The group with the highest labor force participation rate are those with the educational attainment of less than high school, with 100.0% or 6 individuals in the labor force. Within the labor force, individuals with less than high school education have the highest percentage of unemployment, with 100.0% or 6 of them being unemployed.
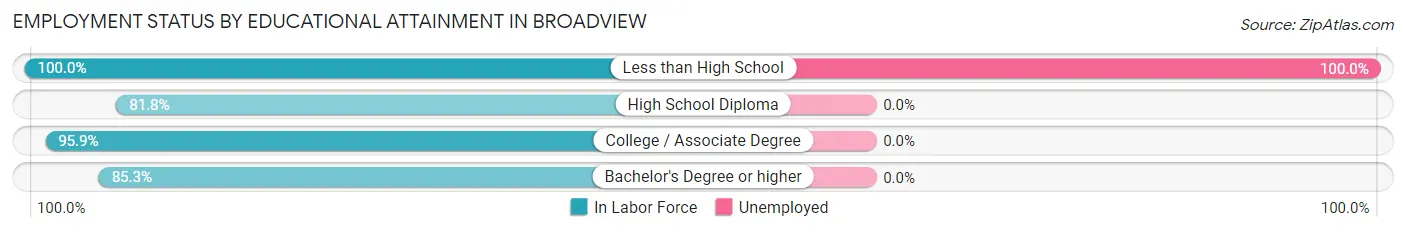
| Educational Attainment | In Labor Force | Unemployed |
| Less than High School | 6 (100.0%) | 6 (100.0%) |
| High School Diploma | 18 (81.8%) | 0 (0.0%) |
| College / Associate Degree | 47 (95.9%) | 0 (0.0%) |
| Bachelor's Degree or higher | 29 (85.3%) | 0 (0.0%) |
| Total | 100 (90.1%) | 7 (6.0%) |
Employment Occupations by Sex in Broadview
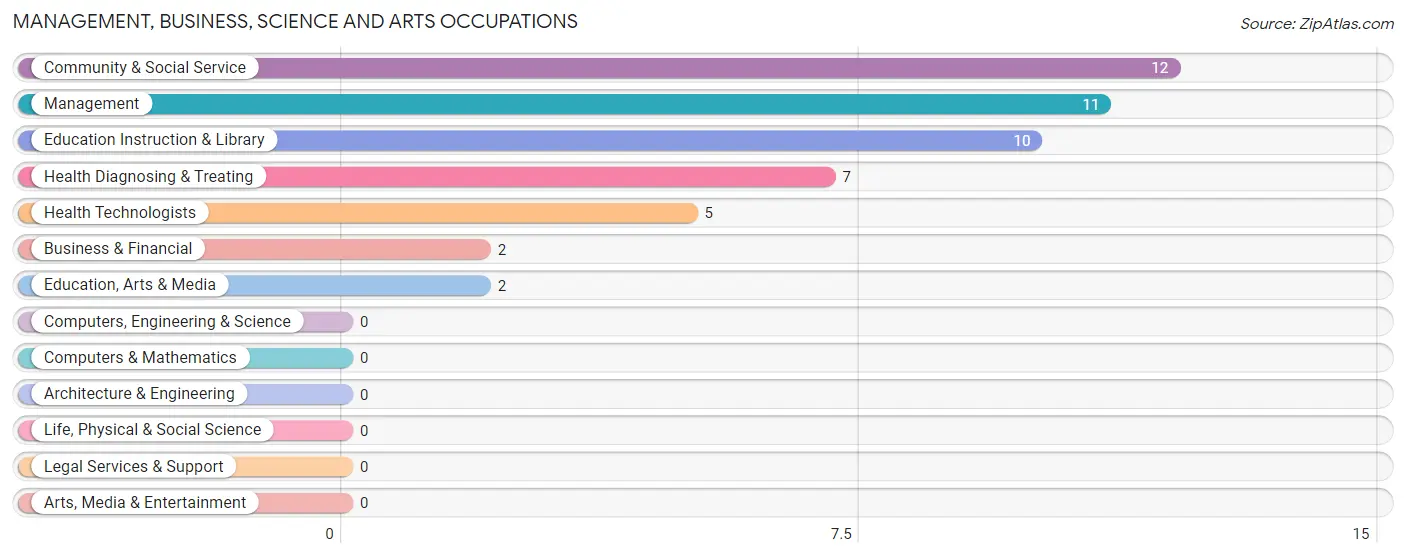
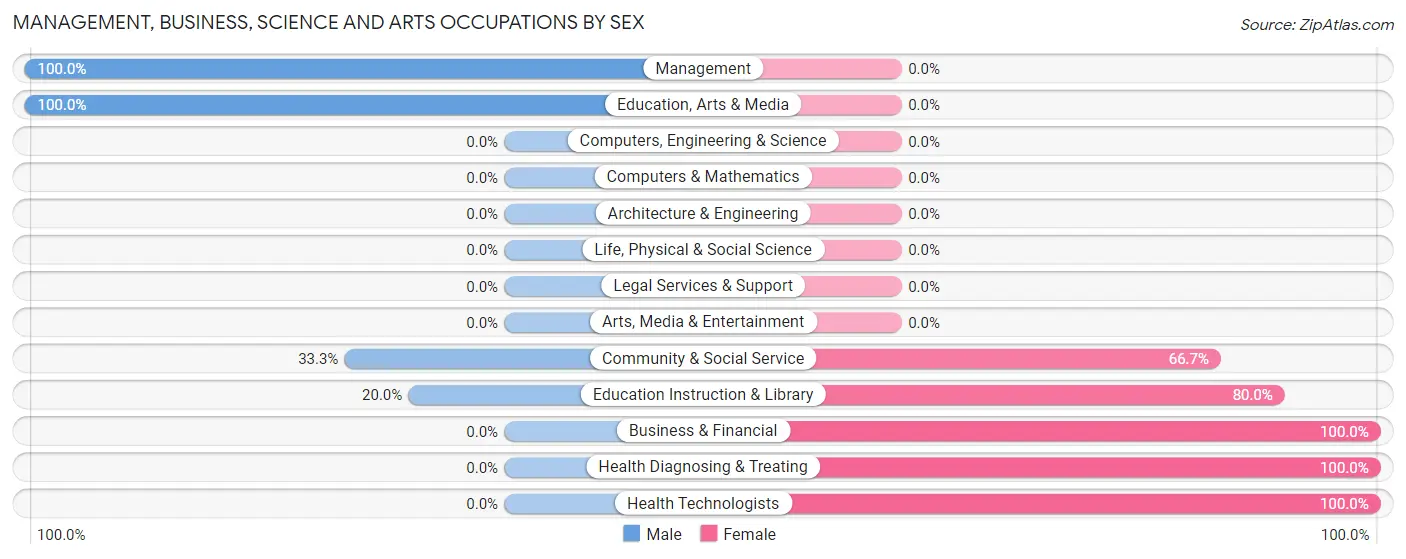
Management, Business, Science and Arts Occupations
The most common Management, Business, Science and Arts occupations in Broadview are Community & Social Service (12 | 9.8%), Management (11 | 8.9%), Education Instruction & Library (10 | 8.1%), Health Diagnosing & Treating (7 | 5.7%), and Health Technologists (5 | 4.1%).
Management, Business, Science and Arts Occupations by Sex
Within the Management, Business, Science and Arts occupations in Broadview, the most male-oriented occupations are Management (100.0%), Education, Arts & Media (100.0%), and Community & Social Service (33.3%), while the most female-oriented occupations are Business & Financial (100.0%), Health Diagnosing & Treating (100.0%), and Health Technologists (100.0%).
| Occupation | Male | Female |
| Management | 11 (100.0%) | 0 (0.0%) |
| Business & Financial | 0 (0.0%) | 2 (100.0%) |
| Computers, Engineering & Science | 0 (0.0%) | 0 (0.0%) |
| Computers & Mathematics | 0 (0.0%) | 0 (0.0%) |
| Architecture & Engineering | 0 (0.0%) | 0 (0.0%) |
| Life, Physical & Social Science | 0 (0.0%) | 0 (0.0%) |
| Community & Social Service | 4 (33.3%) | 8 (66.7%) |
| Education, Arts & Media | 2 (100.0%) | 0 (0.0%) |
| Legal Services & Support | 0 (0.0%) | 0 (0.0%) |
| Education Instruction & Library | 2 (20.0%) | 8 (80.0%) |
| Arts, Media & Entertainment | 0 (0.0%) | 0 (0.0%) |
| Health Diagnosing & Treating | 0 (0.0%) | 7 (100.0%) |
| Health Technologists | 0 (0.0%) | 5 (100.0%) |
| Total (Category) | 15 (46.9%) | 17 (53.1%) |
| Total (Overall) | 78 (63.4%) | 45 (36.6%) |
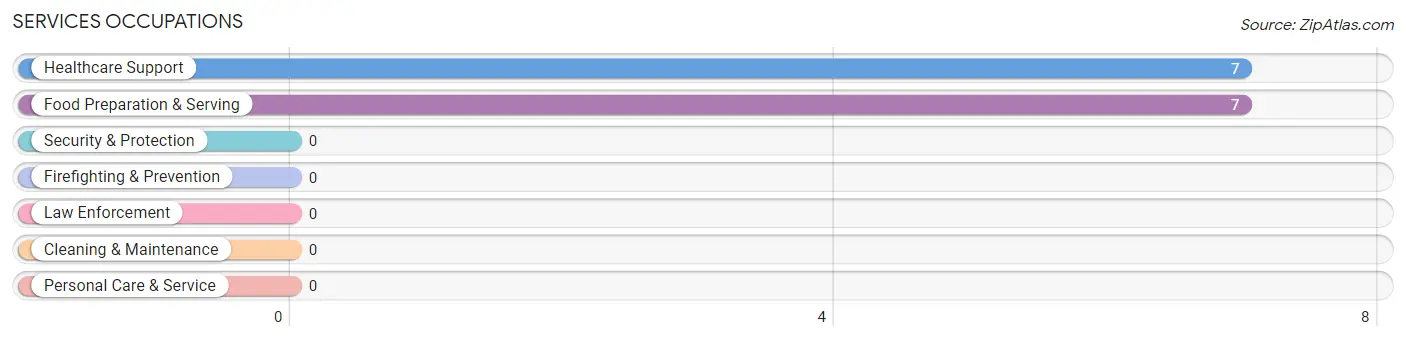
Services Occupations
The most common Services occupations in Broadview are Healthcare Support (7 | 5.7%), and Food Preparation & Serving (7 | 5.7%).
Services Occupations by Sex
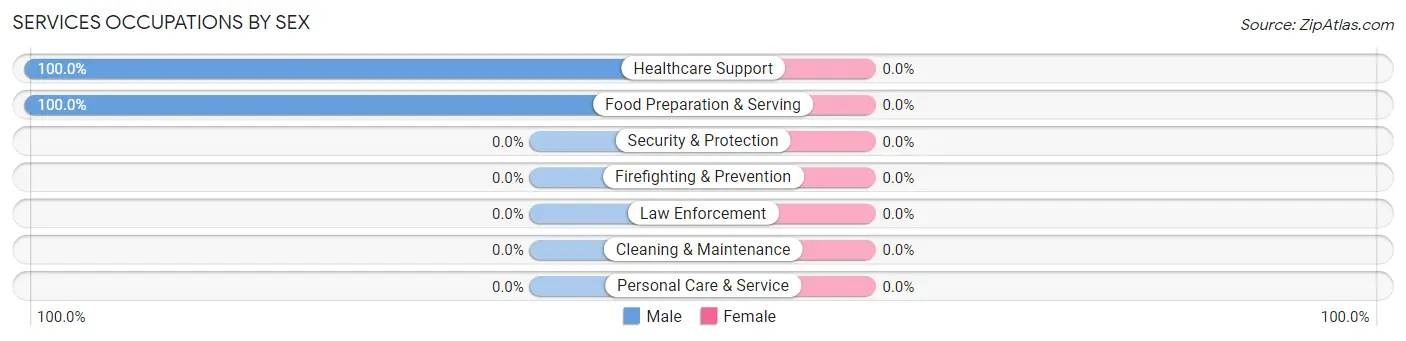
| Occupation | Male | Female |
| Healthcare Support | 7 (100.0%) | 0 (0.0%) |
| Security & Protection | 0 (0.0%) | 0 (0.0%) |
| Firefighting & Prevention | 0 (0.0%) | 0 (0.0%) |
| Law Enforcement | 0 (0.0%) | 0 (0.0%) |
| Food Preparation & Serving | 7 (100.0%) | 0 (0.0%) |
| Cleaning & Maintenance | 0 (0.0%) | 0 (0.0%) |
| Personal Care & Service | 0 (0.0%) | 0 (0.0%) |
| Total (Category) | 14 (100.0%) | 0 (0.0%) |
| Total (Overall) | 78 (63.4%) | 45 (36.6%) |
Sales and Office Occupations
The most common Sales and Office occupations in Broadview are Office & Administration (11 | 8.9%), and Sales & Related (2 | 1.6%).

Sales and Office Occupations by Sex

| Occupation | Male | Female |
| Sales & Related | 2 (100.0%) | 0 (0.0%) |
| Office & Administration | 0 (0.0%) | 11 (100.0%) |
| Total (Category) | 2 (15.4%) | 11 (84.6%) |
| Total (Overall) | 78 (63.4%) | 45 (36.6%) |
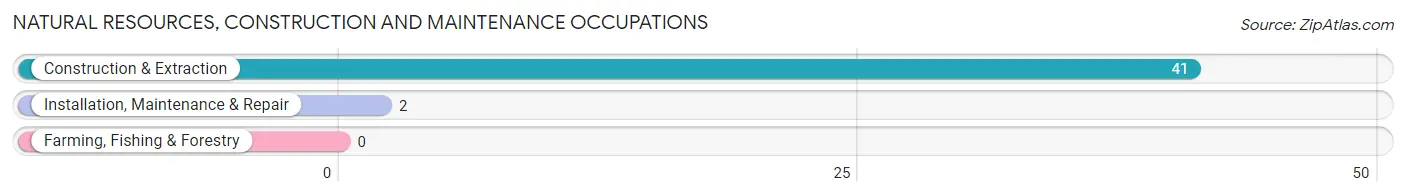
Natural Resources, Construction and Maintenance Occupations
The most common Natural Resources, Construction and Maintenance occupations in Broadview are Construction & Extraction (41 | 33.3%), and Installation, Maintenance & Repair (2 | 1.6%).
Natural Resources, Construction and Maintenance Occupations by Sex
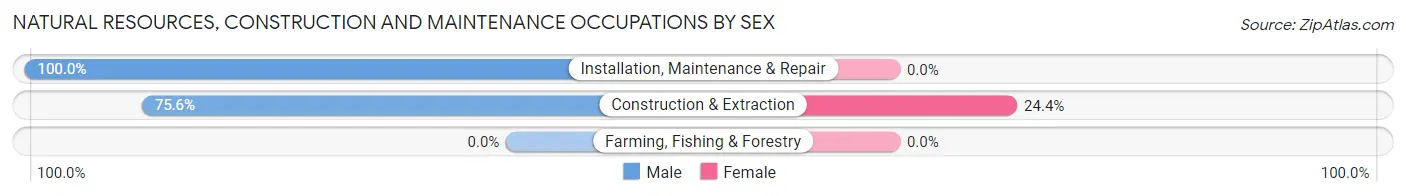
| Occupation | Male | Female |
| Farming, Fishing & Forestry | 0 (0.0%) | 0 (0.0%) |
| Construction & Extraction | 31 (75.6%) | 10 (24.4%) |
| Installation, Maintenance & Repair | 2 (100.0%) | 0 (0.0%) |
| Total (Category) | 33 (76.7%) | 10 (23.3%) |
| Total (Overall) | 78 (63.4%) | 45 (36.6%) |
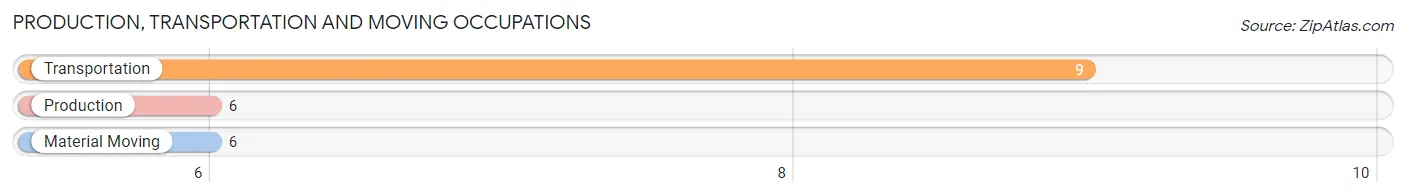
Production, Transportation and Moving Occupations
The most common Production, Transportation and Moving occupations in Broadview are Transportation (9 | 7.3%), Production (6 | 4.9%), and Material Moving (6 | 4.9%).
Production, Transportation and Moving Occupations by Sex
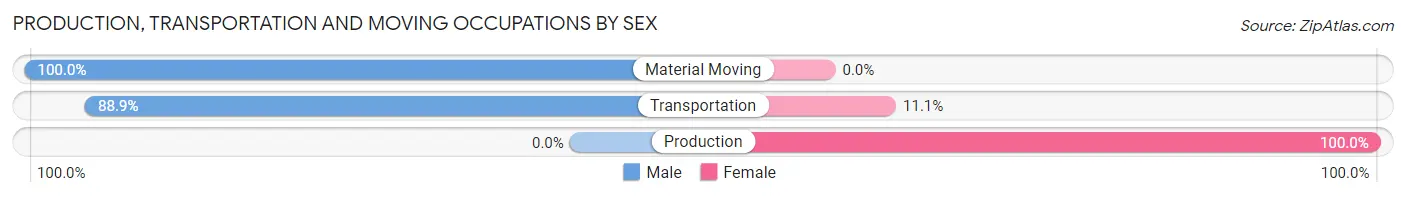
| Occupation | Male | Female |
| Production | 0 (0.0%) | 6 (100.0%) |
| Transportation | 8 (88.9%) | 1 (11.1%) |
| Material Moving | 6 (100.0%) | 0 (0.0%) |
| Total (Category) | 14 (66.7%) | 7 (33.3%) |
| Total (Overall) | 78 (63.4%) | 45 (36.6%) |
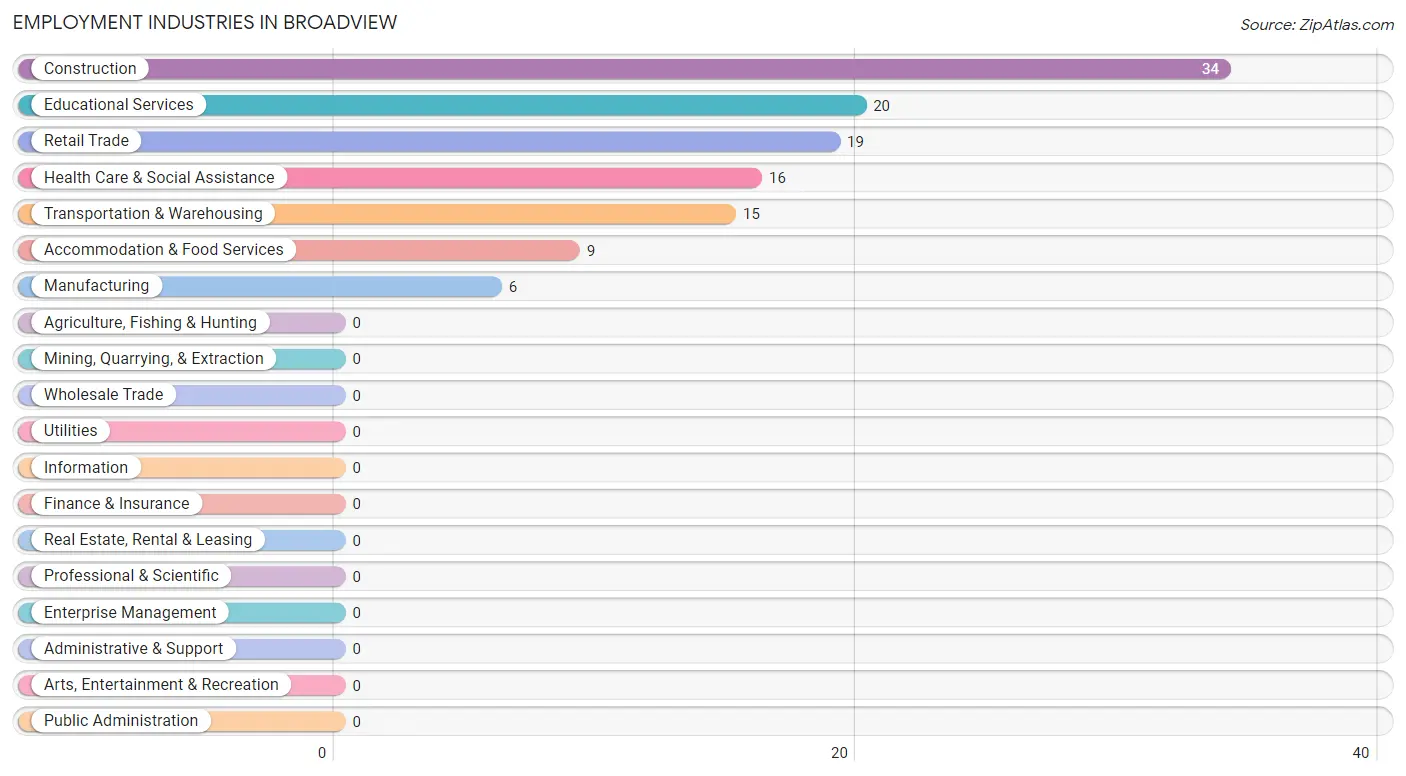
Employment Industries by Sex in Broadview
Employment Industries in Broadview
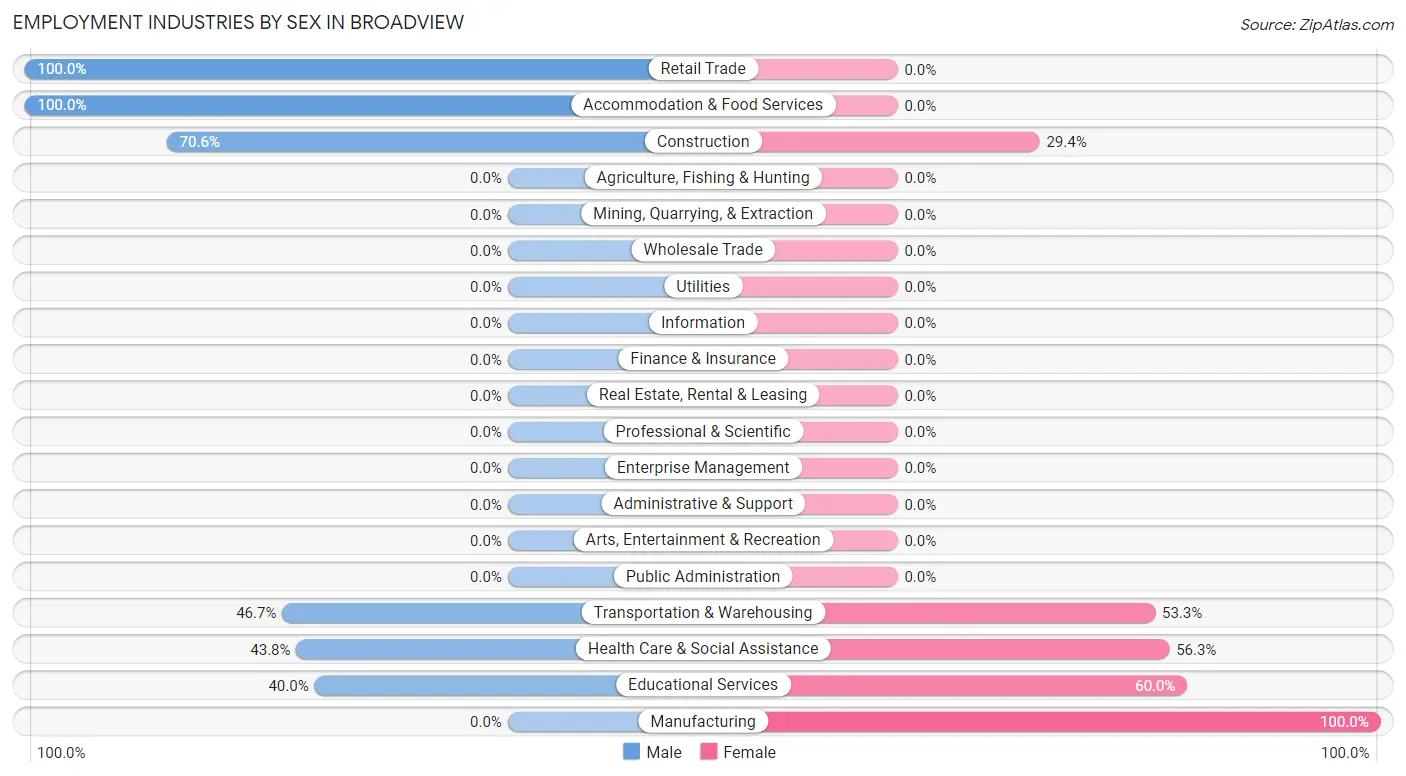
The major employment industries in Broadview include Construction (34 | 27.6%), Educational Services (20 | 16.3%), Retail Trade (19 | 15.4%), Health Care & Social Assistance (16 | 13.0%), and Transportation & Warehousing (15 | 12.2%).
Employment Industries by Sex in Broadview
The Broadview industries that see more men than women are Retail Trade (100.0%), Accommodation & Food Services (100.0%), and Construction (70.6%), whereas the industries that tend to have a higher number of women are Manufacturing (100.0%), Educational Services (60.0%), and Health Care & Social Assistance (56.2%).
| Industry | Male | Female |
| Agriculture, Fishing & Hunting | 0 (0.0%) | 0 (0.0%) |
| Mining, Quarrying, & Extraction | 0 (0.0%) | 0 (0.0%) |
| Construction | 24 (70.6%) | 10 (29.4%) |
| Manufacturing | 0 (0.0%) | 6 (100.0%) |
| Wholesale Trade | 0 (0.0%) | 0 (0.0%) |
| Retail Trade | 19 (100.0%) | 0 (0.0%) |
| Transportation & Warehousing | 7 (46.7%) | 8 (53.3%) |
| Utilities | 0 (0.0%) | 0 (0.0%) |
| Information | 0 (0.0%) | 0 (0.0%) |
| Finance & Insurance | 0 (0.0%) | 0 (0.0%) |
| Real Estate, Rental & Leasing | 0 (0.0%) | 0 (0.0%) |
| Professional & Scientific | 0 (0.0%) | 0 (0.0%) |
| Enterprise Management | 0 (0.0%) | 0 (0.0%) |
| Administrative & Support | 0 (0.0%) | 0 (0.0%) |
| Educational Services | 8 (40.0%) | 12 (60.0%) |
| Health Care & Social Assistance | 7 (43.8%) | 9 (56.2%) |
| Arts, Entertainment & Recreation | 0 (0.0%) | 0 (0.0%) |
| Accommodation & Food Services | 9 (100.0%) | 0 (0.0%) |
| Public Administration | 0 (0.0%) | 0 (0.0%) |
| Total | 78 (63.4%) | 45 (36.6%) |
Education in Broadview
School Enrollment in Broadview
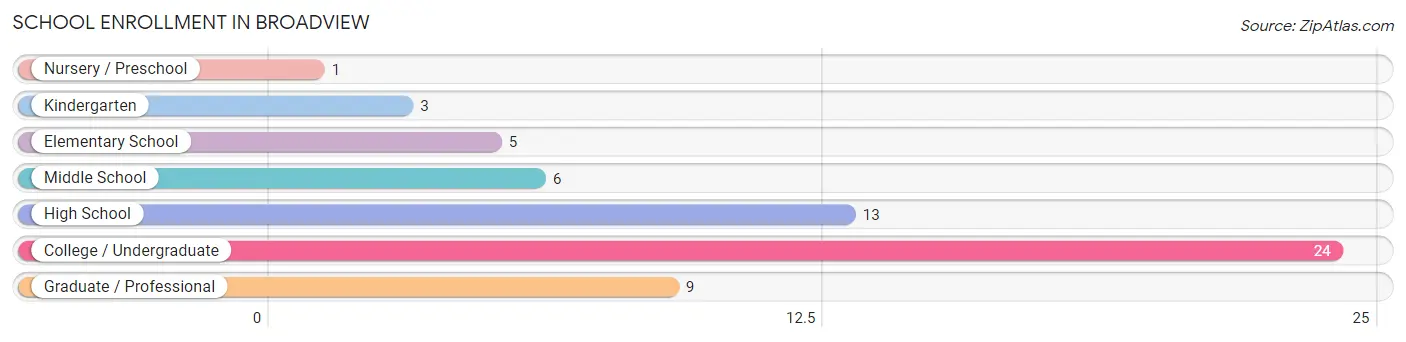
The most common levels of schooling among the 61 students in Broadview are college / undergraduate (24 | 39.3%), high school (13 | 21.3%), and graduate / professional (9 | 14.7%).
| School Level | # Students | % Students |
| Nursery / Preschool | 1 | 1.6% |
| Kindergarten | 3 | 4.9% |
| Elementary School | 5 | 8.2% |
| Middle School | 6 | 9.8% |
| High School | 13 | 21.3% |
| College / Undergraduate | 24 | 39.3% |
| Graduate / Professional | 9 | 14.7% |
| Total | 61 | 100.0% |
School Enrollment by Age by Funding Source in Broadview
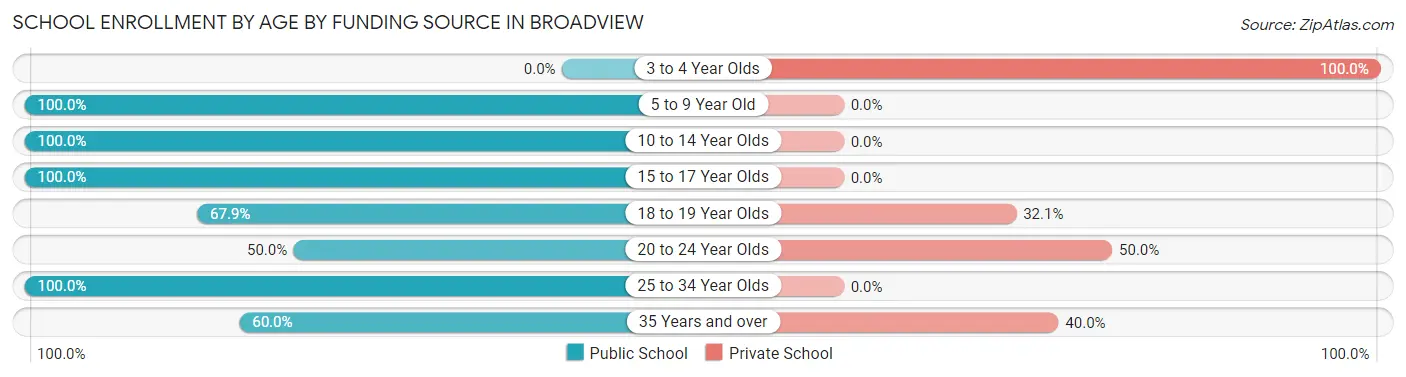
Out of a total of 61 students who are enrolled in schools in Broadview, 16 (26.2%) attend a private institution, while the remaining 45 (73.8%) are enrolled in public schools. The age group of 3 to 4 year olds has the highest likelihood of being enrolled in private schools, with 1 (100.0% in the age bracket) enrolled. Conversely, the age group of 5 to 9 year old has the lowest likelihood of being enrolled in a private school, with 6 (100.0% in the age bracket) attending a public institution.
| Age Bracket | Public School | Private School |
| 3 to 4 Year Olds | 0 (0.0%) | 1 (100.0%) |
| 5 to 9 Year Old | 6 (100.0%) | 0 (0.0%) |
| 10 to 14 Year Olds | 8 (100.0%) | 0 (0.0%) |
| 15 to 17 Year Olds | 3 (100.0%) | 0 (0.0%) |
| 18 to 19 Year Olds | 19 (67.9%) | 9 (32.1%) |
| 20 to 24 Year Olds | 2 (50.0%) | 2 (50.0%) |
| 25 to 34 Year Olds | 1 (100.0%) | 0 (0.0%) |
| 35 Years and over | 6 (60.0%) | 4 (40.0%) |
| Total | 45 (73.8%) | 16 (26.2%) |
Educational Attainment by Field of Study in Broadview
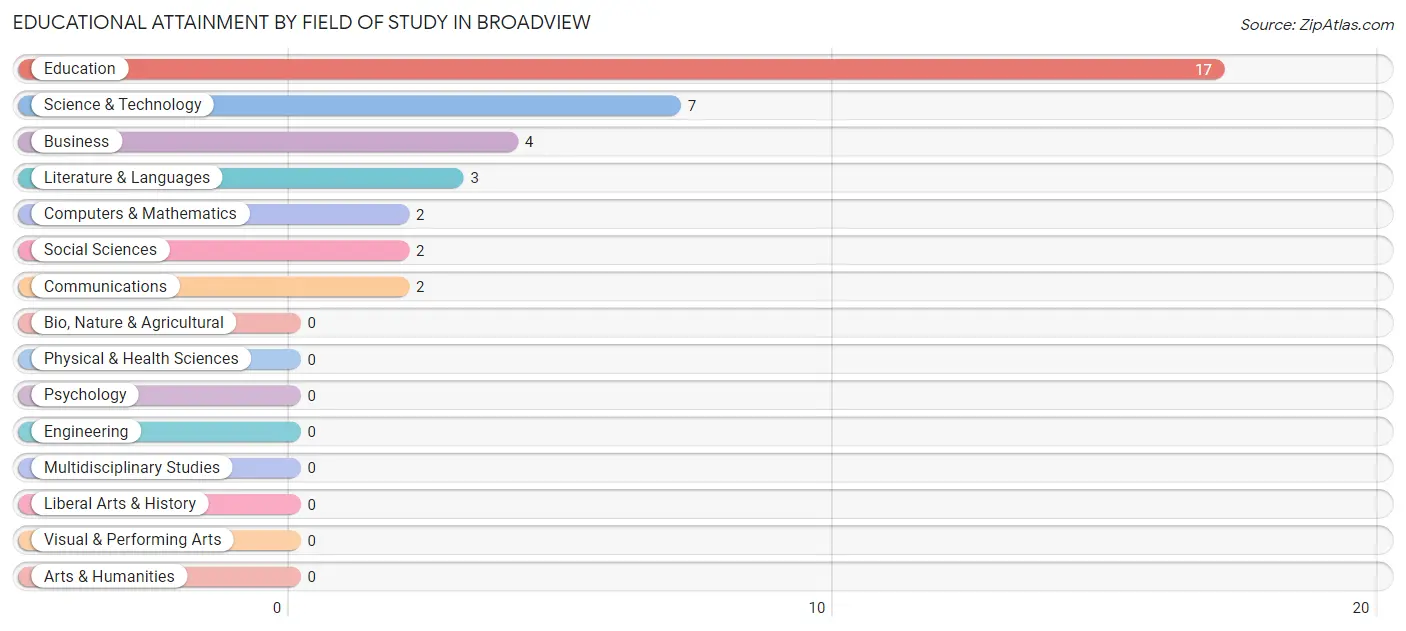
Education (17 | 46.0%), science & technology (7 | 18.9%), business (4 | 10.8%), literature & languages (3 | 8.1%), and computers & mathematics (2 | 5.4%) are the most common fields of study among 37 individuals in Broadview who have obtained a bachelor's degree or higher.
| Field of Study | # Graduates | % Graduates |
| Computers & Mathematics | 2 | 5.4% |
| Bio, Nature & Agricultural | 0 | 0.0% |
| Physical & Health Sciences | 0 | 0.0% |
| Psychology | 0 | 0.0% |
| Social Sciences | 2 | 5.4% |
| Engineering | 0 | 0.0% |
| Multidisciplinary Studies | 0 | 0.0% |
| Science & Technology | 7 | 18.9% |
| Business | 4 | 10.8% |
| Education | 17 | 46.0% |
| Literature & Languages | 3 | 8.1% |
| Liberal Arts & History | 0 | 0.0% |
| Visual & Performing Arts | 0 | 0.0% |
| Communications | 2 | 5.4% |
| Arts & Humanities | 0 | 0.0% |
| Total | 37 | 100.0% |
Transportation & Commute in Broadview
Vehicle Availability by Sex in Broadview
The most prevalent vehicle ownership categories in Broadview are males with 3 vehicles (19, accounting for 27.5%) and females with 3 vehicles (10, making up 44.2%).
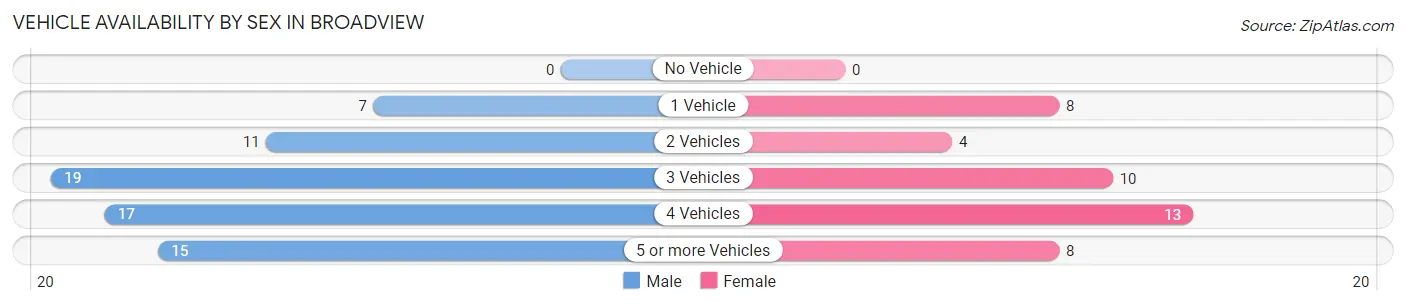
| Vehicles Available | Male | Female |
| No Vehicle | 0 (0.0%) | 0 (0.0%) |
| 1 Vehicle | 7 (10.1%) | 8 (18.6%) |
| 2 Vehicles | 11 (15.9%) | 4 (9.3%) |
| 3 Vehicles | 19 (27.5%) | 10 (23.3%) |
| 4 Vehicles | 17 (24.6%) | 13 (30.2%) |
| 5 or more Vehicles | 15 (21.7%) | 8 (18.6%) |
| Total | 69 (100.0%) | 43 (100.0%) |
Commute Time in Broadview
The most frequently occuring commute durations in Broadview are less than 5 minutes (27 commuters, 24.1%), 35 to 39 minutes (21 commuters, 18.8%), and 45 to 59 minutes (19 commuters, 17.0%).
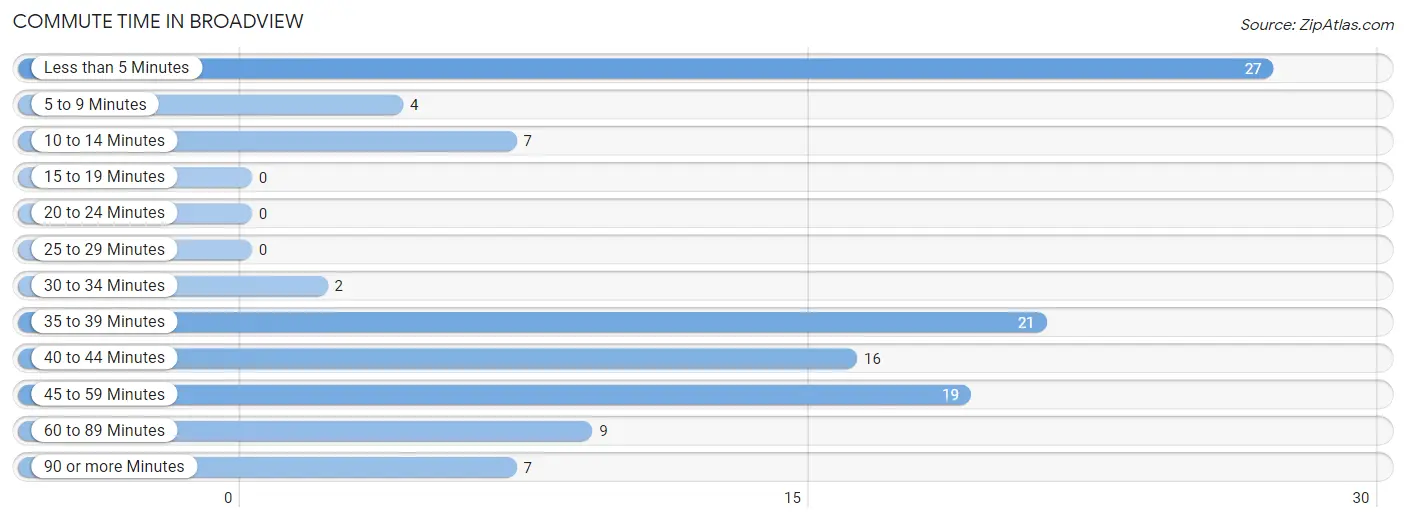
| Commute Time | # Commuters | % Commuters |
| Less than 5 Minutes | 27 | 24.1% |
| 5 to 9 Minutes | 4 | 3.6% |
| 10 to 14 Minutes | 7 | 6.2% |
| 15 to 19 Minutes | 0 | 0.0% |
| 20 to 24 Minutes | 0 | 0.0% |
| 25 to 29 Minutes | 0 | 0.0% |
| 30 to 34 Minutes | 2 | 1.8% |
| 35 to 39 Minutes | 21 | 18.8% |
| 40 to 44 Minutes | 16 | 14.3% |
| 45 to 59 Minutes | 19 | 17.0% |
| 60 to 89 Minutes | 9 | 8.0% |
| 90 or more Minutes | 7 | 6.2% |
Commute Time by Sex in Broadview
The most common commute times in Broadview are 40 to 44 minutes (14 commuters, 20.3%) for males and less than 5 minutes (21 commuters, 48.8%) for females.
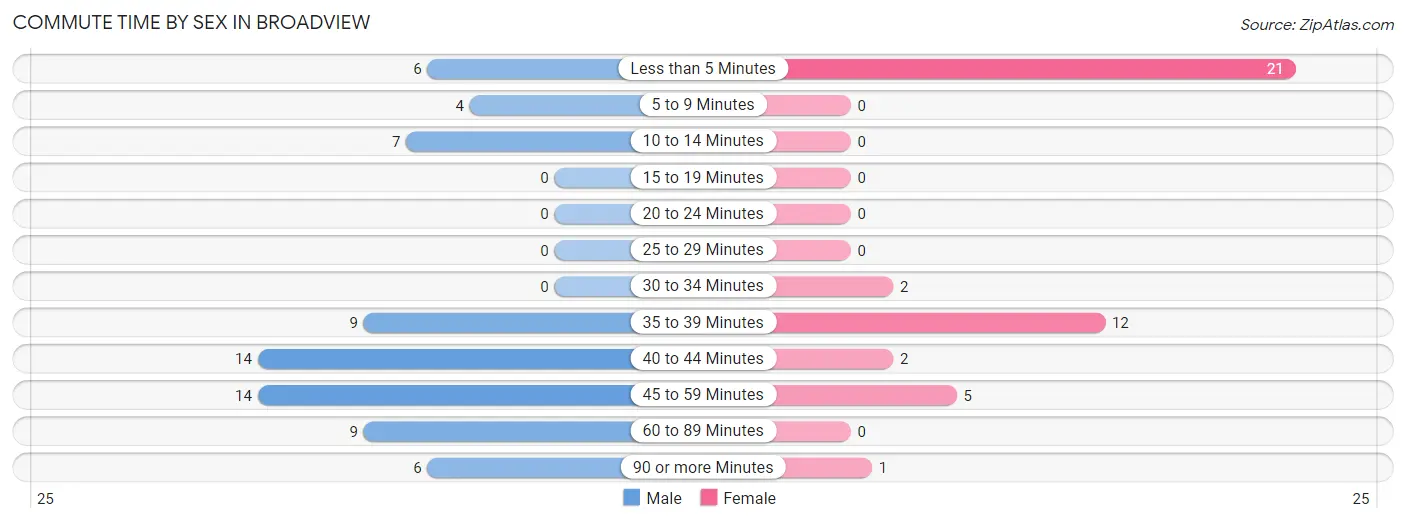
| Commute Time | Male | Female |
| Less than 5 Minutes | 6 (8.7%) | 21 (48.8%) |
| 5 to 9 Minutes | 4 (5.8%) | 0 (0.0%) |
| 10 to 14 Minutes | 7 (10.1%) | 0 (0.0%) |
| 15 to 19 Minutes | 0 (0.0%) | 0 (0.0%) |
| 20 to 24 Minutes | 0 (0.0%) | 0 (0.0%) |
| 25 to 29 Minutes | 0 (0.0%) | 0 (0.0%) |
| 30 to 34 Minutes | 0 (0.0%) | 2 (4.6%) |
| 35 to 39 Minutes | 9 (13.0%) | 12 (27.9%) |
| 40 to 44 Minutes | 14 (20.3%) | 2 (4.6%) |
| 45 to 59 Minutes | 14 (20.3%) | 5 (11.6%) |
| 60 to 89 Minutes | 9 (13.0%) | 0 (0.0%) |
| 90 or more Minutes | 6 (8.7%) | 1 (2.3%) |
Time of Departure to Work by Sex in Broadview
The most frequent times of departure to work in Broadview are 6:00 AM to 6:29 AM (17, 24.6%) for males and 7:00 AM to 7:29 AM (20, 46.5%) for females.
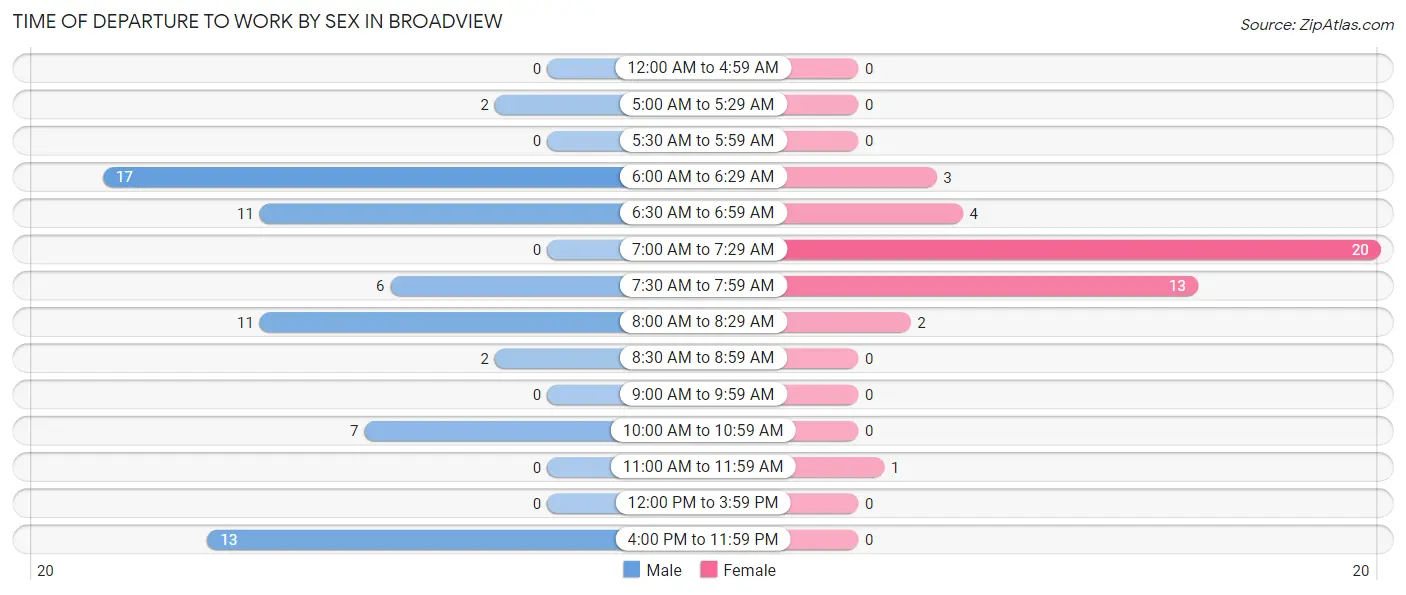
| Time of Departure | Male | Female |
| 12:00 AM to 4:59 AM | 0 (0.0%) | 0 (0.0%) |
| 5:00 AM to 5:29 AM | 2 (2.9%) | 0 (0.0%) |
| 5:30 AM to 5:59 AM | 0 (0.0%) | 0 (0.0%) |
| 6:00 AM to 6:29 AM | 17 (24.6%) | 3 (7.0%) |
| 6:30 AM to 6:59 AM | 11 (15.9%) | 4 (9.3%) |
| 7:00 AM to 7:29 AM | 0 (0.0%) | 20 (46.5%) |
| 7:30 AM to 7:59 AM | 6 (8.7%) | 13 (30.2%) |
| 8:00 AM to 8:29 AM | 11 (15.9%) | 2 (4.6%) |
| 8:30 AM to 8:59 AM | 2 (2.9%) | 0 (0.0%) |
| 9:00 AM to 9:59 AM | 0 (0.0%) | 0 (0.0%) |
| 10:00 AM to 10:59 AM | 7 (10.1%) | 0 (0.0%) |
| 11:00 AM to 11:59 AM | 0 (0.0%) | 1 (2.3%) |
| 12:00 PM to 3:59 PM | 0 (0.0%) | 0 (0.0%) |
| 4:00 PM to 11:59 PM | 13 (18.8%) | 0 (0.0%) |
| Total | 69 (100.0%) | 43 (100.0%) |
Housing Occupancy in Broadview
Occupancy by Ownership in Broadview
Of the total 85 dwellings in Broadview, owner-occupied units account for 68 (80.0%), while renter-occupied units make up 17 (20.0%).
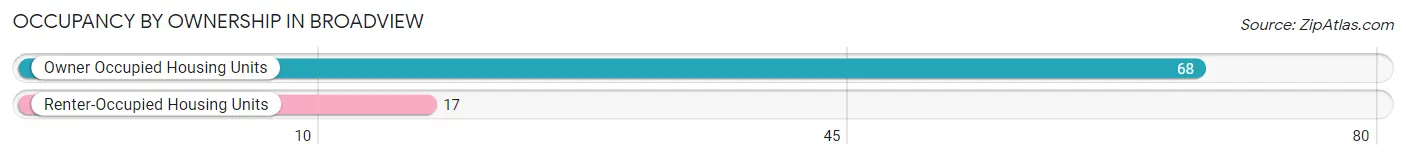
| Occupancy | # Housing Units | % Housing Units |
| Owner Occupied Housing Units | 68 | 80.0% |
| Renter-Occupied Housing Units | 17 | 20.0% |
| Total Occupied Housing Units | 85 | 100.0% |
Occupancy by Household Size in Broadview
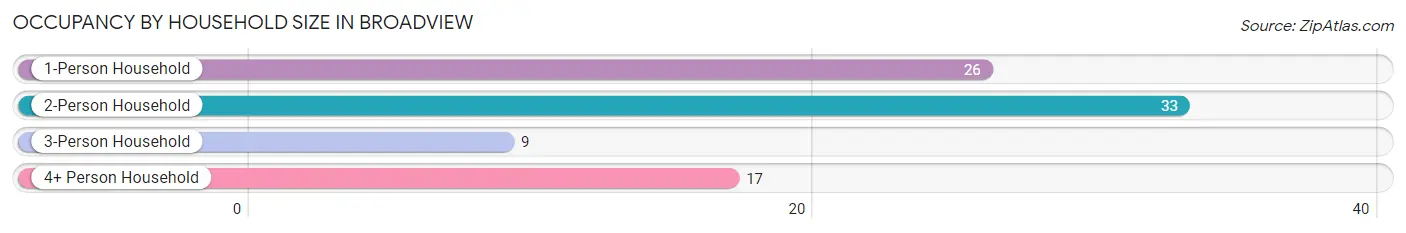
| Household Size | # Housing Units | % Housing Units |
| 1-Person Household | 26 | 30.6% |
| 2-Person Household | 33 | 38.8% |
| 3-Person Household | 9 | 10.6% |
| 4+ Person Household | 17 | 20.0% |
| Total Housing Units | 85 | 100.0% |
Occupancy by Ownership by Household Size in Broadview
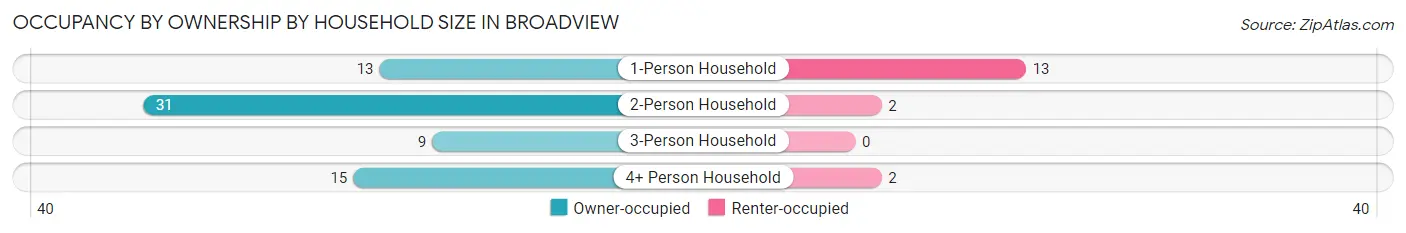
| Household Size | Owner-occupied | Renter-occupied |
| 1-Person Household | 13 (50.0%) | 13 (50.0%) |
| 2-Person Household | 31 (93.9%) | 2 (6.1%) |
| 3-Person Household | 9 (100.0%) | 0 (0.0%) |
| 4+ Person Household | 15 (88.2%) | 2 (11.8%) |
| Total Housing Units | 68 (80.0%) | 17 (20.0%) |
Occupancy by Educational Attainment in Broadview
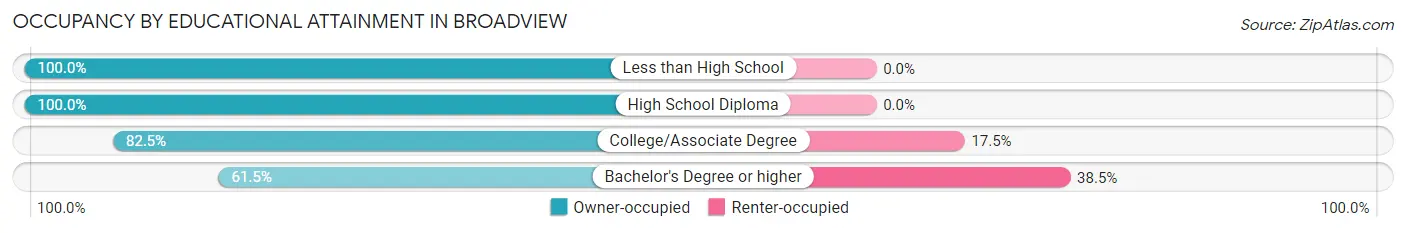
| Household Size | Owner-occupied | Renter-occupied |
| Less than High School | 6 (100.0%) | 0 (0.0%) |
| High School Diploma | 13 (100.0%) | 0 (0.0%) |
| College/Associate Degree | 33 (82.5%) | 7 (17.5%) |
| Bachelor's Degree or higher | 16 (61.5%) | 10 (38.5%) |
Occupancy by Age of Householder in Broadview
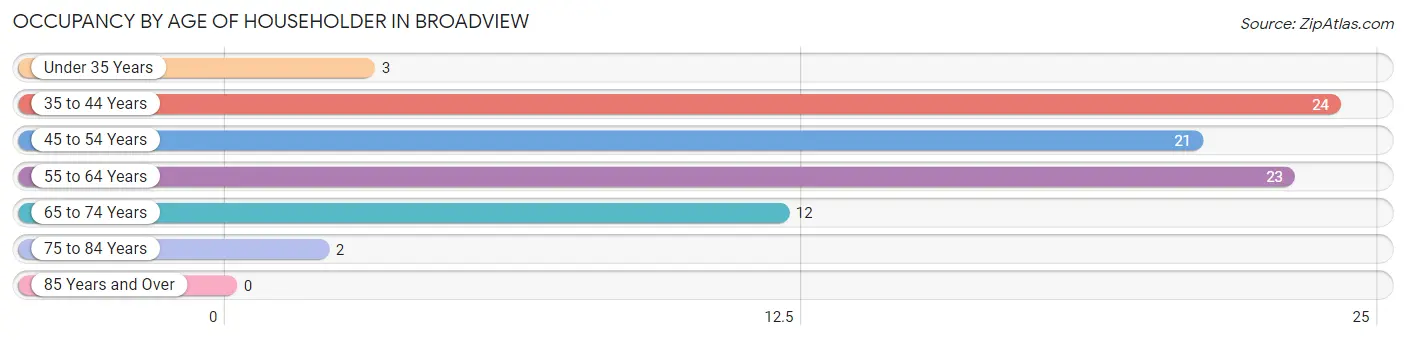
| Age Bracket | # Households | % Households |
| Under 35 Years | 3 | 3.5% |
| 35 to 44 Years | 24 | 28.2% |
| 45 to 54 Years | 21 | 24.7% |
| 55 to 64 Years | 23 | 27.1% |
| 65 to 74 Years | 12 | 14.1% |
| 75 to 84 Years | 2 | 2.4% |
| 85 Years and Over | 0 | 0.0% |
| Total | 85 | 100.0% |
Housing Finances in Broadview
Median Income by Occupancy in Broadview
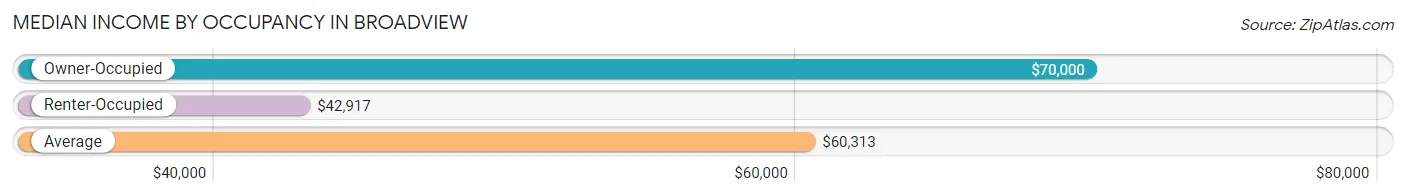
| Occupancy Type | # Households | Median Income |
| Owner-Occupied | 68 (80.0%) | $70,000 |
| Renter-Occupied | 17 (20.0%) | $42,917 |
| Average | 85 (100.0%) | $60,313 |
Occupancy by Householder Income Bracket in Broadview
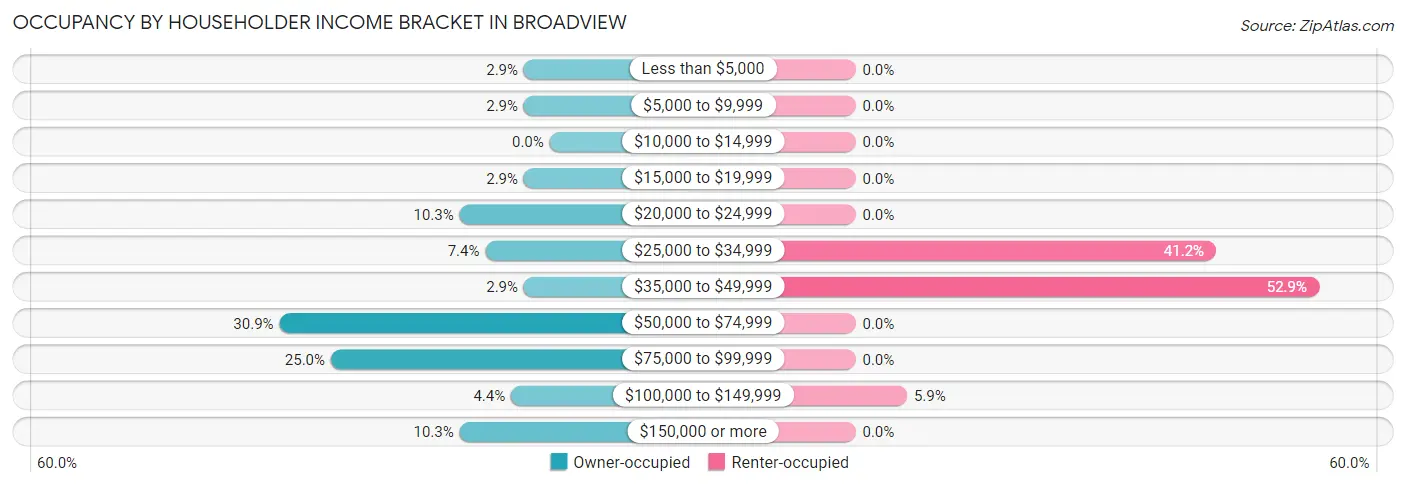
| Income Bracket | Owner-occupied | Renter-occupied |
| Less than $5,000 | 2 (2.9%) | 0 (0.0%) |
| $5,000 to $9,999 | 2 (2.9%) | 0 (0.0%) |
| $10,000 to $14,999 | 0 (0.0%) | 0 (0.0%) |
| $15,000 to $19,999 | 2 (2.9%) | 0 (0.0%) |
| $20,000 to $24,999 | 7 (10.3%) | 0 (0.0%) |
| $25,000 to $34,999 | 5 (7.3%) | 7 (41.2%) |
| $35,000 to $49,999 | 2 (2.9%) | 9 (52.9%) |
| $50,000 to $74,999 | 21 (30.9%) | 0 (0.0%) |
| $75,000 to $99,999 | 17 (25.0%) | 0 (0.0%) |
| $100,000 to $149,999 | 3 (4.4%) | 1 (5.9%) |
| $150,000 or more | 7 (10.3%) | 0 (0.0%) |
| Total | 68 (100.0%) | 17 (100.0%) |
Monthly Housing Cost Tiers in Broadview
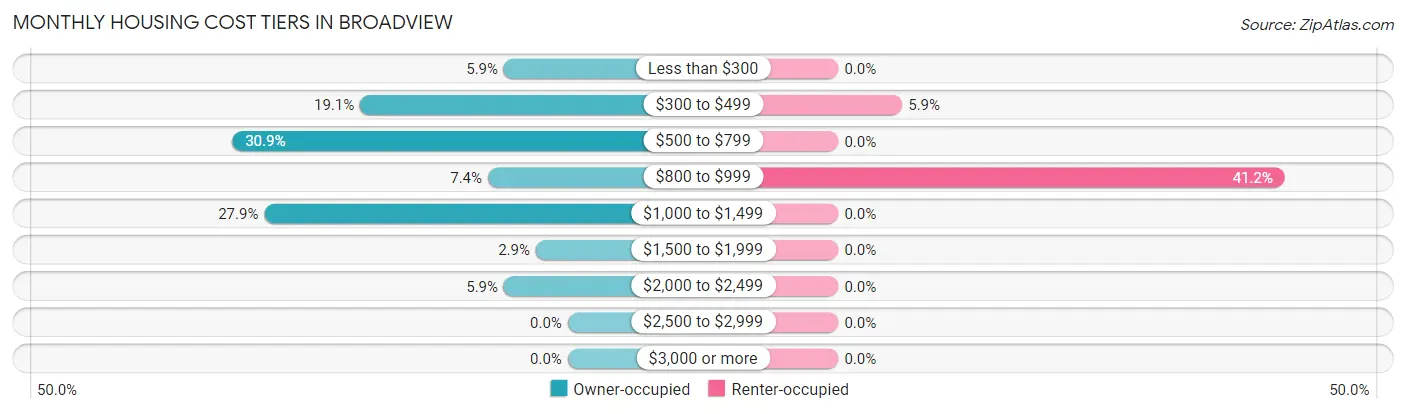
| Monthly Cost | Owner-occupied | Renter-occupied |
| Less than $300 | 4 (5.9%) | 0 (0.0%) |
| $300 to $499 | 13 (19.1%) | 1 (5.9%) |
| $500 to $799 | 21 (30.9%) | 0 (0.0%) |
| $800 to $999 | 5 (7.3%) | 7 (41.2%) |
| $1,000 to $1,499 | 19 (27.9%) | 0 (0.0%) |
| $1,500 to $1,999 | 2 (2.9%) | 0 (0.0%) |
| $2,000 to $2,499 | 4 (5.9%) | 0 (0.0%) |
| $2,500 to $2,999 | 0 (0.0%) | 0 (0.0%) |
| $3,000 or more | 0 (0.0%) | 0 (0.0%) |
| Total | 68 (100.0%) | 17 (100.0%) |
Physical Housing Characteristics in Broadview
Housing Structures in Broadview
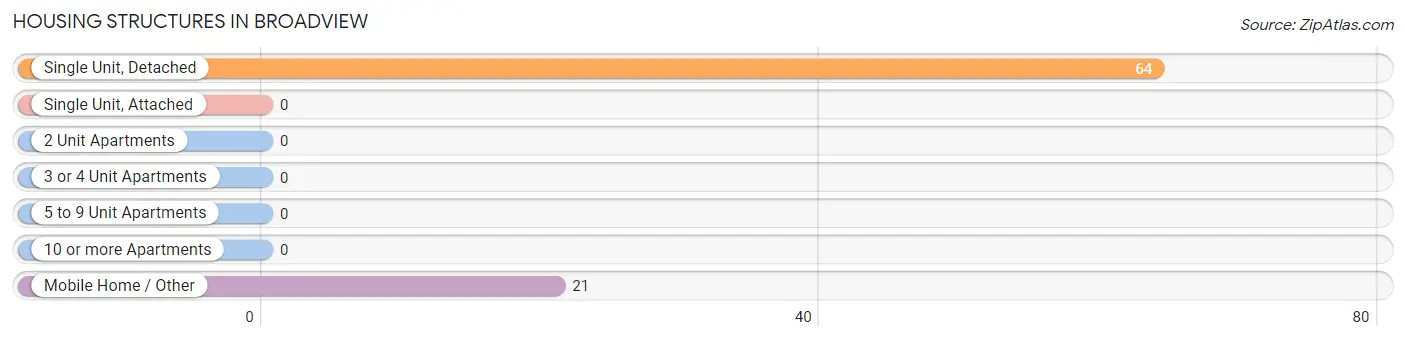
| Structure Type | # Housing Units | % Housing Units |
| Single Unit, Detached | 64 | 75.3% |
| Single Unit, Attached | 0 | 0.0% |
| 2 Unit Apartments | 0 | 0.0% |
| 3 or 4 Unit Apartments | 0 | 0.0% |
| 5 to 9 Unit Apartments | 0 | 0.0% |
| 10 or more Apartments | 0 | 0.0% |
| Mobile Home / Other | 21 | 24.7% |
| Total | 85 | 100.0% |
Housing Structures by Occupancy in Broadview
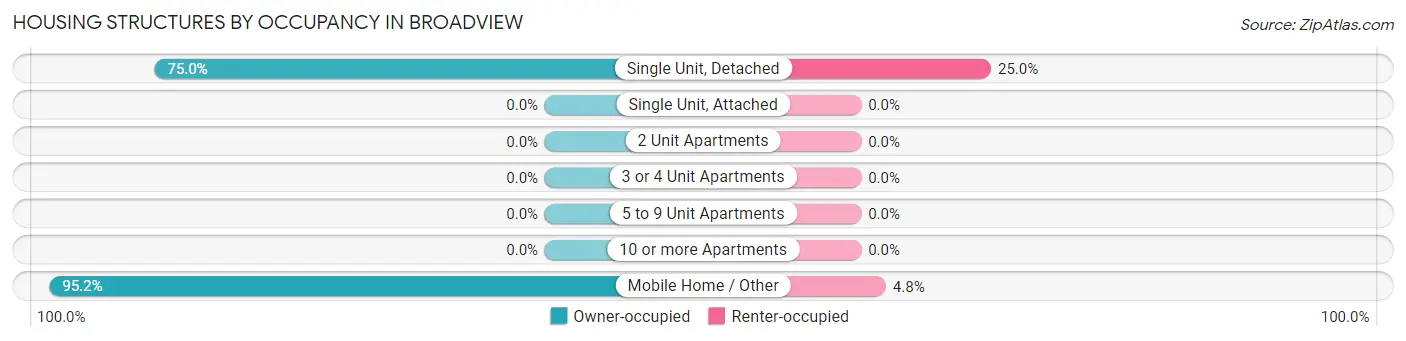
| Structure Type | Owner-occupied | Renter-occupied |
| Single Unit, Detached | 48 (75.0%) | 16 (25.0%) |
| Single Unit, Attached | 0 (0.0%) | 0 (0.0%) |
| 2 Unit Apartments | 0 (0.0%) | 0 (0.0%) |
| 3 or 4 Unit Apartments | 0 (0.0%) | 0 (0.0%) |
| 5 to 9 Unit Apartments | 0 (0.0%) | 0 (0.0%) |
| 10 or more Apartments | 0 (0.0%) | 0 (0.0%) |
| Mobile Home / Other | 20 (95.2%) | 1 (4.8%) |
| Total | 68 (80.0%) | 17 (20.0%) |
Housing Structures by Number of Rooms in Broadview
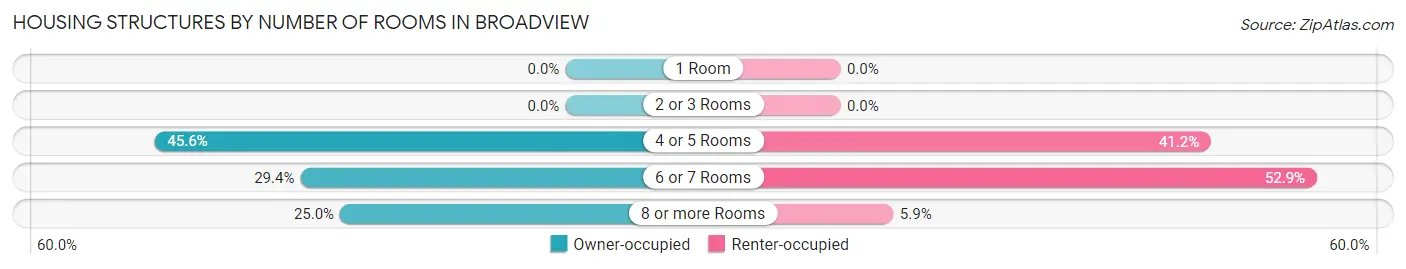
| Number of Rooms | Owner-occupied | Renter-occupied |
| 1 Room | 0 (0.0%) | 0 (0.0%) |
| 2 or 3 Rooms | 0 (0.0%) | 0 (0.0%) |
| 4 or 5 Rooms | 31 (45.6%) | 7 (41.2%) |
| 6 or 7 Rooms | 20 (29.4%) | 9 (52.9%) |
| 8 or more Rooms | 17 (25.0%) | 1 (5.9%) |
| Total | 68 (100.0%) | 17 (100.0%) |
Housing Structure by Heating Type in Broadview
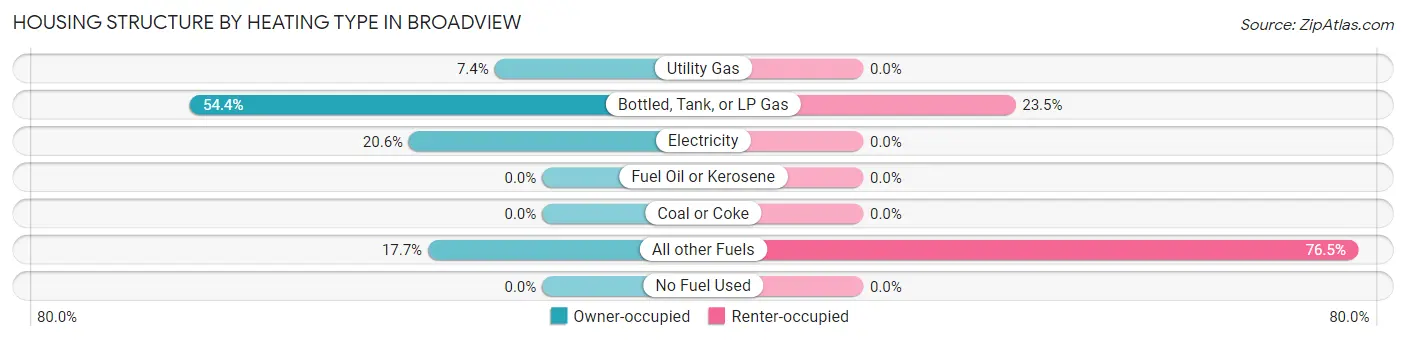
| Heating Type | Owner-occupied | Renter-occupied |
| Utility Gas | 5 (7.3%) | 0 (0.0%) |
| Bottled, Tank, or LP Gas | 37 (54.4%) | 4 (23.5%) |
| Electricity | 14 (20.6%) | 0 (0.0%) |
| Fuel Oil or Kerosene | 0 (0.0%) | 0 (0.0%) |
| Coal or Coke | 0 (0.0%) | 0 (0.0%) |
| All other Fuels | 12 (17.6%) | 13 (76.5%) |
| No Fuel Used | 0 (0.0%) | 0 (0.0%) |
| Total | 68 (100.0%) | 17 (100.0%) |
Household Vehicle Usage in Broadview
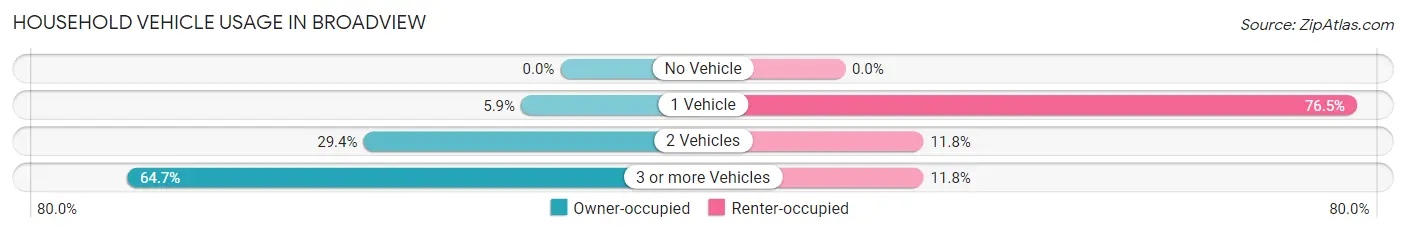
| Vehicles per Household | Owner-occupied | Renter-occupied |
| No Vehicle | 0 (0.0%) | 0 (0.0%) |
| 1 Vehicle | 4 (5.9%) | 13 (76.5%) |
| 2 Vehicles | 20 (29.4%) | 2 (11.8%) |
| 3 or more Vehicles | 44 (64.7%) | 2 (11.8%) |
| Total | 68 (100.0%) | 17 (100.0%) |
Real Estate & Mortgages in Broadview
Real Estate and Mortgage Overview in Broadview
| Characteristic | Without Mortgage | With Mortgage |
| Housing Units | 25 | 43 |
| Median Property Value | - | - |
| Median Household Income | $63,125 | $7 |
| Monthly Housing Costs | $450 | $0 |
| Real Estate Taxes | $750 | $0 |
Property Value by Mortgage Status in Broadview
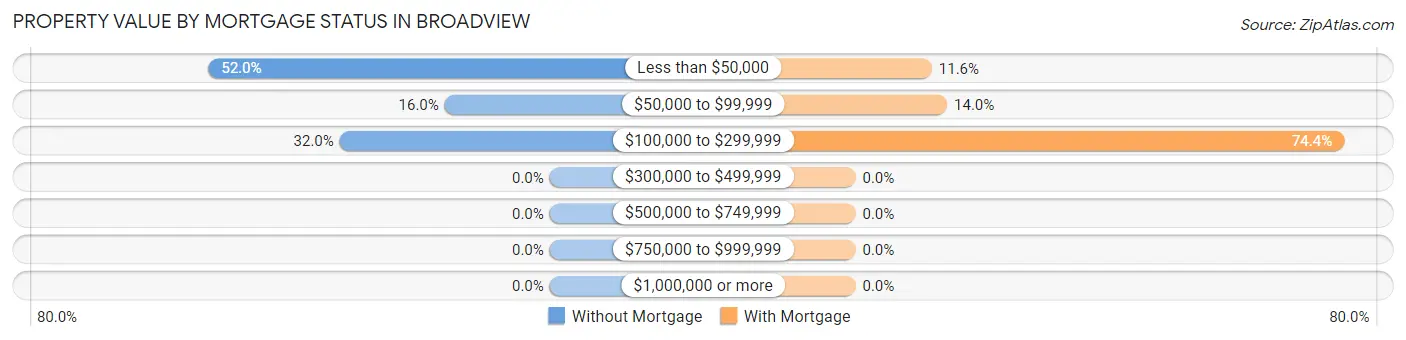
| Property Value | Without Mortgage | With Mortgage |
| Less than $50,000 | 13 (52.0%) | 5 (11.6%) |
| $50,000 to $99,999 | 4 (16.0%) | 6 (14.0%) |
| $100,000 to $299,999 | 8 (32.0%) | 32 (74.4%) |
| $300,000 to $499,999 | 0 (0.0%) | 0 (0.0%) |
| $500,000 to $749,999 | 0 (0.0%) | 0 (0.0%) |
| $750,000 to $999,999 | 0 (0.0%) | 0 (0.0%) |
| $1,000,000 or more | 0 (0.0%) | 0 (0.0%) |
| Total | 25 (100.0%) | 43 (100.0%) |
Household Income by Mortgage Status in Broadview
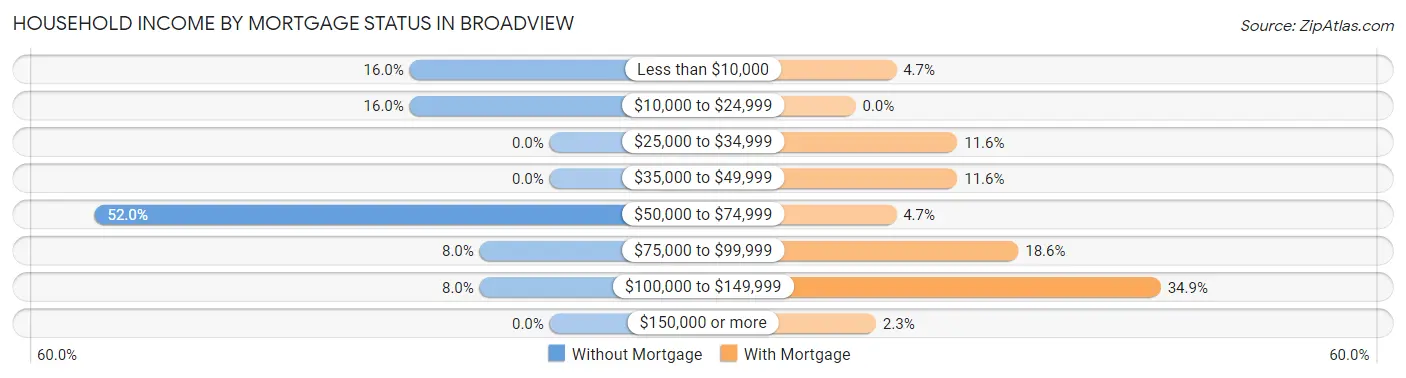
| Household Income | Without Mortgage | With Mortgage |
| Less than $10,000 | 4 (16.0%) | 2 (4.6%) |
| $10,000 to $24,999 | 4 (16.0%) | 0 (0.0%) |
| $25,000 to $34,999 | 0 (0.0%) | 5 (11.6%) |
| $35,000 to $49,999 | 0 (0.0%) | 5 (11.6%) |
| $50,000 to $74,999 | 13 (52.0%) | 2 (4.6%) |
| $75,000 to $99,999 | 2 (8.0%) | 8 (18.6%) |
| $100,000 to $149,999 | 2 (8.0%) | 15 (34.9%) |
| $150,000 or more | 0 (0.0%) | 1 (2.3%) |
| Total | 25 (100.0%) | 43 (100.0%) |
Property Value to Household Income Ratio in Broadview
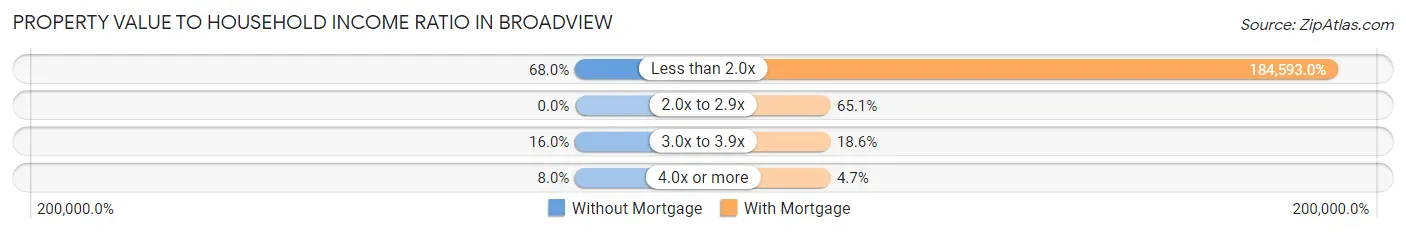
| Value-to-Income Ratio | Without Mortgage | With Mortgage |
| Less than 2.0x | 17 (68.0%) | 79,375 (184,593.0%) |
| 2.0x to 2.9x | 0 (0.0%) | 28 (65.1%) |
| 3.0x to 3.9x | 4 (16.0%) | 8 (18.6%) |
| 4.0x or more | 2 (8.0%) | 2 (4.6%) |
| Total | 25 (100.0%) | 43 (100.0%) |
Real Estate Taxes by Mortgage Status in Broadview
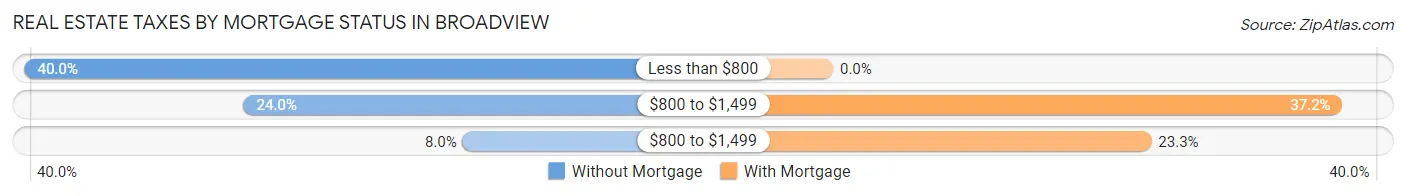
| Property Taxes | Without Mortgage | With Mortgage |
| Less than $800 | 10 (40.0%) | 0 (0.0%) |
| $800 to $1,499 | 6 (24.0%) | 16 (37.2%) |
| $800 to $1,499 | 2 (8.0%) | 10 (23.3%) |
| Total | 25 (100.0%) | 43 (100.0%) |
Health & Disability in Broadview
Health Insurance Coverage by Age in Broadview
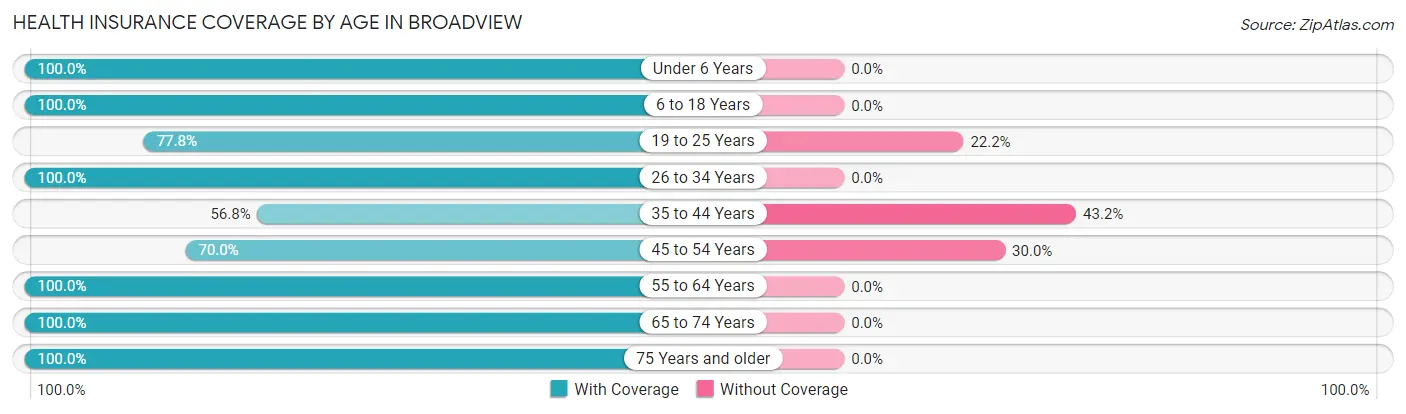
| Age Bracket | With Coverage | Without Coverage |
| Under 6 Years | 4 (100.0%) | 0 (0.0%) |
| 6 to 18 Years | 26 (100.0%) | 0 (0.0%) |
| 19 to 25 Years | 21 (77.8%) | 6 (22.2%) |
| 26 to 34 Years | 1 (100.0%) | 0 (0.0%) |
| 35 to 44 Years | 21 (56.8%) | 16 (43.2%) |
| 45 to 54 Years | 28 (70.0%) | 12 (30.0%) |
| 55 to 64 Years | 33 (100.0%) | 0 (0.0%) |
| 65 to 74 Years | 20 (100.0%) | 0 (0.0%) |
| 75 Years and older | 14 (100.0%) | 0 (0.0%) |
| Total | 168 (83.2%) | 34 (16.8%) |
Health Insurance Coverage by Citizenship Status in Broadview
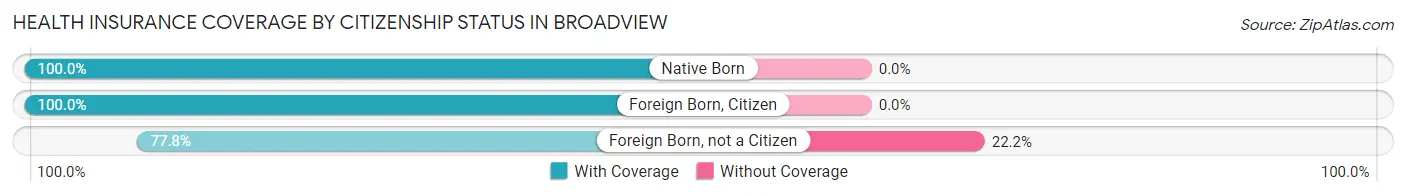
| Citizenship Status | With Coverage | Without Coverage |
| Native Born | 4 (100.0%) | 0 (0.0%) |
| Foreign Born, Citizen | 26 (100.0%) | 0 (0.0%) |
| Foreign Born, not a Citizen | 21 (77.8%) | 6 (22.2%) |
Health Insurance Coverage by Household Income in Broadview
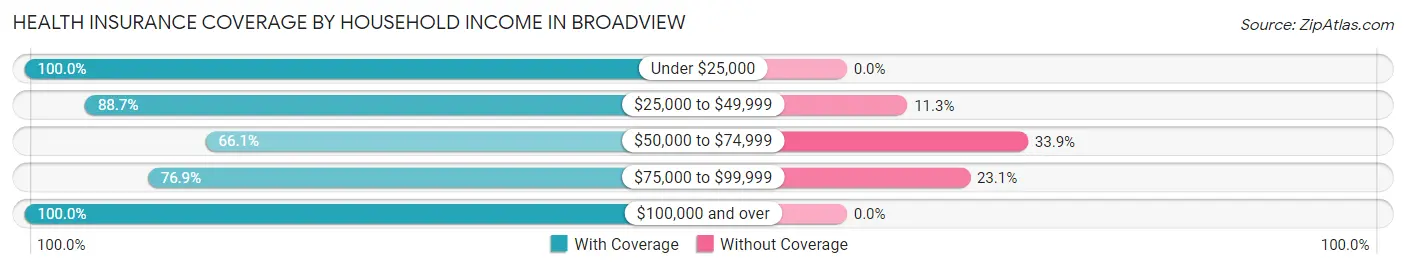
| Household Income | With Coverage | Without Coverage |
| Under $25,000 | 15 (100.0%) | 0 (0.0%) |
| $25,000 to $49,999 | 47 (88.7%) | 6 (11.3%) |
| $50,000 to $74,999 | 37 (66.1%) | 19 (33.9%) |
| $75,000 to $99,999 | 30 (76.9%) | 9 (23.1%) |
| $100,000 and over | 39 (100.0%) | 0 (0.0%) |
Public vs Private Health Insurance Coverage by Age in Broadview
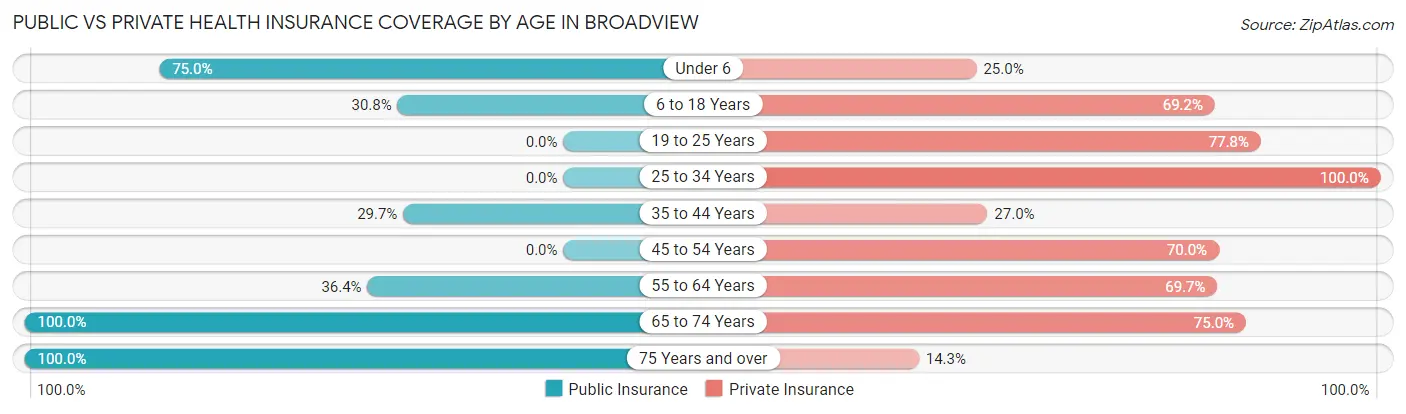
| Age Bracket | Public Insurance | Private Insurance |
| Under 6 | 3 (75.0%) | 1 (25.0%) |
| 6 to 18 Years | 8 (30.8%) | 18 (69.2%) |
| 19 to 25 Years | 0 (0.0%) | 21 (77.8%) |
| 25 to 34 Years | 0 (0.0%) | 1 (100.0%) |
| 35 to 44 Years | 11 (29.7%) | 10 (27.0%) |
| 45 to 54 Years | 0 (0.0%) | 28 (70.0%) |
| 55 to 64 Years | 12 (36.4%) | 23 (69.7%) |
| 65 to 74 Years | 20 (100.0%) | 15 (75.0%) |
| 75 Years and over | 14 (100.0%) | 2 (14.3%) |
| Total | 68 (33.7%) | 119 (58.9%) |
Disability Status by Sex by Age in Broadview
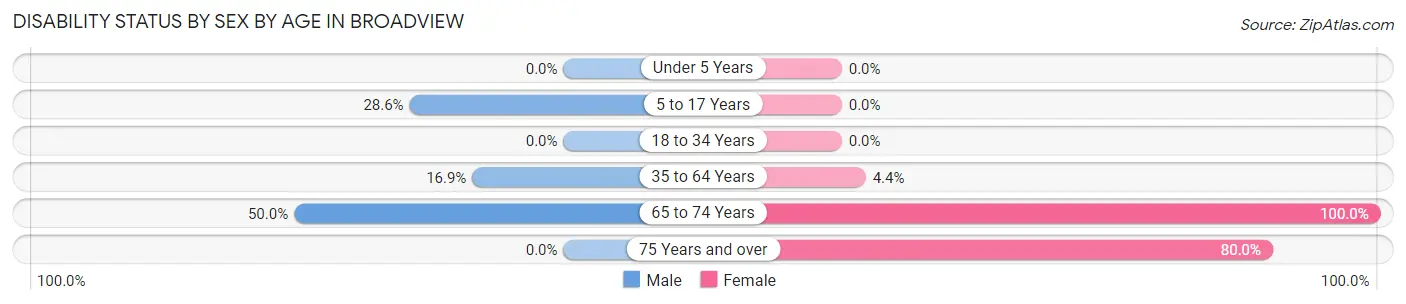
| Age Bracket | Male | Female |
| Under 5 Years | 0 (0.0%) | 0 (0.0%) |
| 5 to 17 Years | 2 (28.6%) | 0 (0.0%) |
| 18 to 34 Years | 0 (0.0%) | 0 (0.0%) |
| 35 to 64 Years | 11 (16.9%) | 2 (4.4%) |
| 65 to 74 Years | 6 (50.0%) | 8 (100.0%) |
| 75 Years and over | 0 (0.0%) | 8 (80.0%) |
Disability Class by Sex by Age in Broadview
Disability Class: Hearing Difficulty
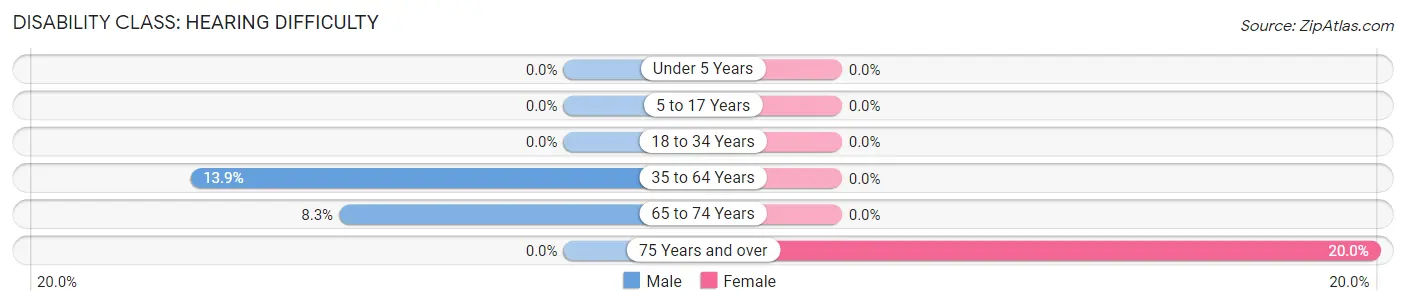
| Age Bracket | Male | Female |
| Under 5 Years | 0 (0.0%) | 0 (0.0%) |
| 5 to 17 Years | 0 (0.0%) | 0 (0.0%) |
| 18 to 34 Years | 0 (0.0%) | 0 (0.0%) |
| 35 to 64 Years | 9 (13.9%) | 0 (0.0%) |
| 65 to 74 Years | 1 (8.3%) | 0 (0.0%) |
| 75 Years and over | 0 (0.0%) | 2 (20.0%) |
Disability Class: Vision Difficulty
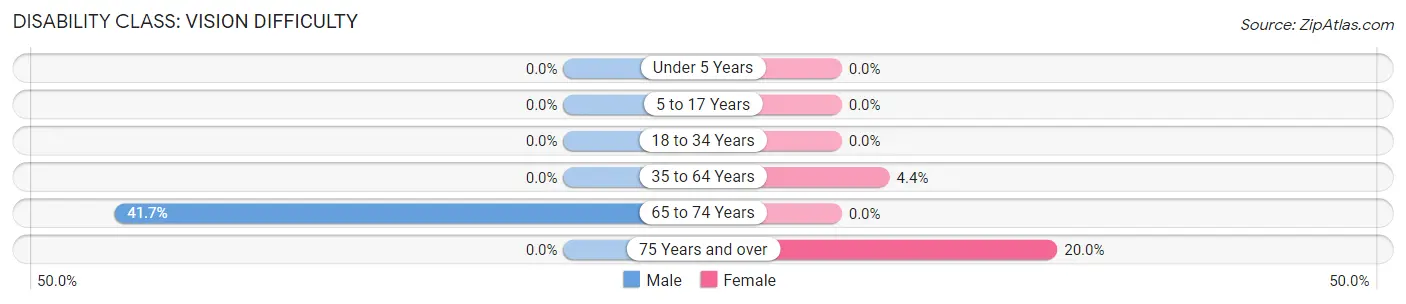
| Age Bracket | Male | Female |
| Under 5 Years | 0 (0.0%) | 0 (0.0%) |
| 5 to 17 Years | 0 (0.0%) | 0 (0.0%) |
| 18 to 34 Years | 0 (0.0%) | 0 (0.0%) |
| 35 to 64 Years | 0 (0.0%) | 2 (4.4%) |
| 65 to 74 Years | 5 (41.7%) | 0 (0.0%) |
| 75 Years and over | 0 (0.0%) | 2 (20.0%) |
Disability Class: Cognitive Difficulty
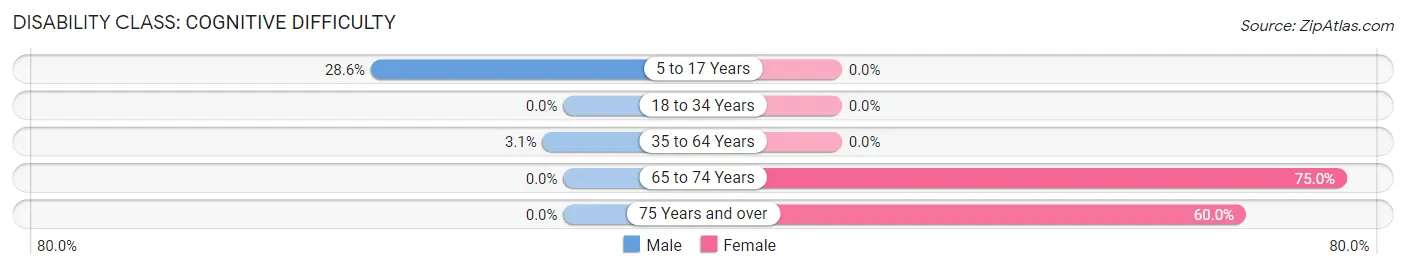
| Age Bracket | Male | Female |
| 5 to 17 Years | 2 (28.6%) | 0 (0.0%) |
| 18 to 34 Years | 0 (0.0%) | 0 (0.0%) |
| 35 to 64 Years | 2 (3.1%) | 0 (0.0%) |
| 65 to 74 Years | 0 (0.0%) | 6 (75.0%) |
| 75 Years and over | 0 (0.0%) | 6 (60.0%) |
Disability Class: Ambulatory Difficulty
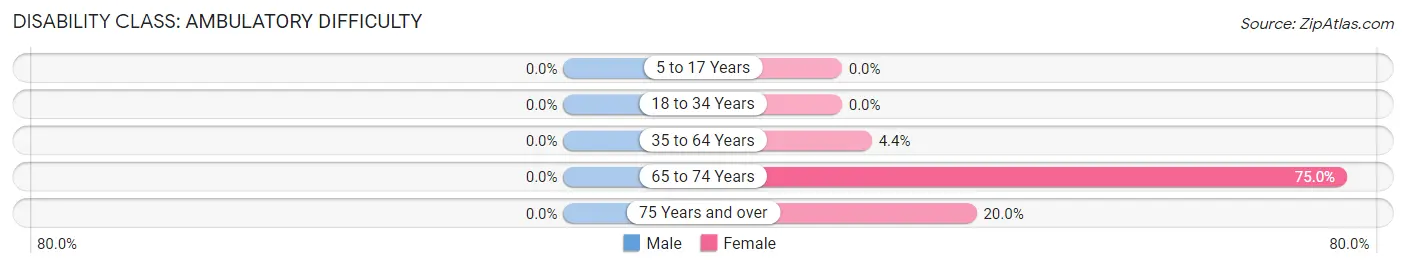
| Age Bracket | Male | Female |
| 5 to 17 Years | 0 (0.0%) | 0 (0.0%) |
| 18 to 34 Years | 0 (0.0%) | 0 (0.0%) |
| 35 to 64 Years | 0 (0.0%) | 2 (4.4%) |
| 65 to 74 Years | 0 (0.0%) | 6 (75.0%) |
| 75 Years and over | 0 (0.0%) | 2 (20.0%) |
Disability Class: Self-Care Difficulty
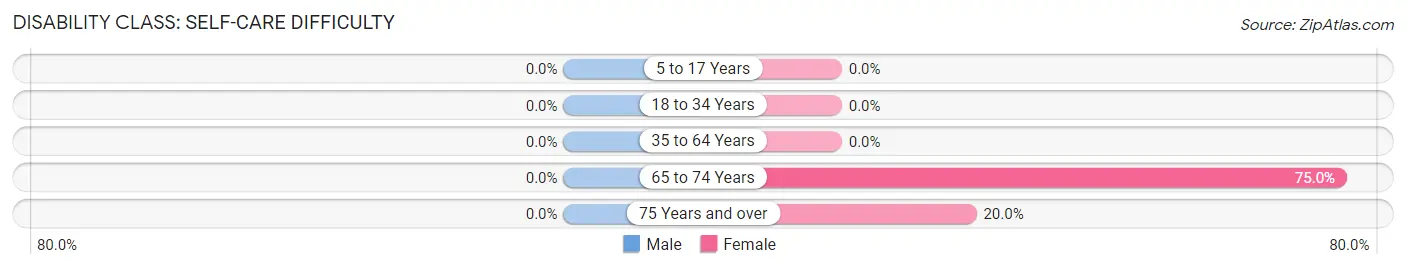
| Age Bracket | Male | Female |
| 5 to 17 Years | 0 (0.0%) | 0 (0.0%) |
| 18 to 34 Years | 0 (0.0%) | 0 (0.0%) |
| 35 to 64 Years | 0 (0.0%) | 0 (0.0%) |
| 65 to 74 Years | 0 (0.0%) | 6 (75.0%) |
| 75 Years and over | 0 (0.0%) | 2 (20.0%) |
Technology Access in Broadview
Computing Device Access in Broadview
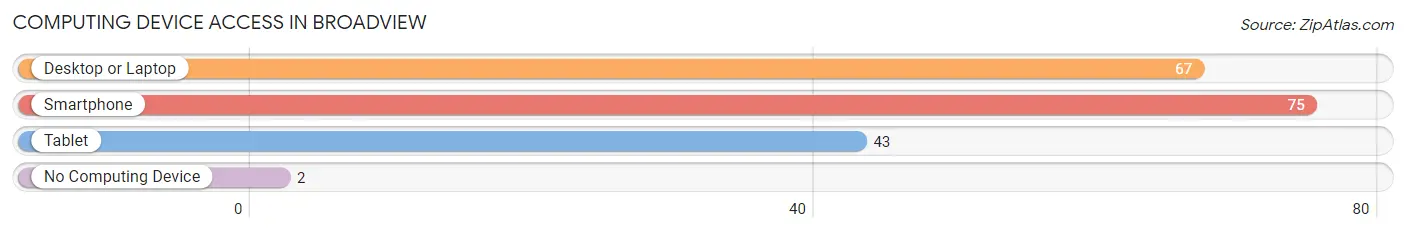
| Device Type | # Households | % Households |
| Desktop or Laptop | 67 | 78.8% |
| Smartphone | 75 | 88.2% |
| Tablet | 43 | 50.6% |
| No Computing Device | 2 | 2.4% |
| Total | 85 | 100.0% |
Internet Access in Broadview
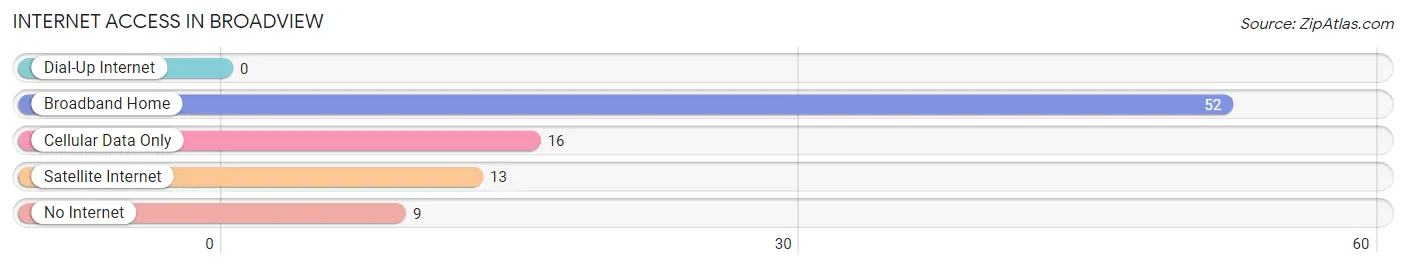
| Internet Type | # Households | % Households |
| Dial-Up Internet | 0 | 0.0% |
| Broadband Home | 52 | 61.2% |
| Cellular Data Only | 16 | 18.8% |
| Satellite Internet | 13 | 15.3% |
| No Internet | 9 | 10.6% |
| Total | 85 | 100.0% |
Broadview Summary
Broadview, Montana is a small town located in the southeastern corner of the state, near the Wyoming border. It is part of the Yellowstone Valley, and is situated in the foothills of the Big Horn Mountains. The town has a population of just over 1,000 people, and is the county seat of Yellowstone County.
History
The area around Broadview was first settled in the late 1800s by ranchers and farmers. The town was officially founded in 1887, and was named after the nearby Broadview Ranch. The town quickly grew, and by the early 1900s, it had become a bustling center of commerce and industry. The town was home to several businesses, including a bank, a hotel, a general store, and a post office.
In the early 1900s, the town was also home to a large number of immigrants, mostly from Europe. These immigrants brought with them their own culture and traditions, which still influence the town today.
Geography
Broadview is located in the Yellowstone Valley, in the foothills of the Big Horn Mountains. The town is situated at an elevation of 4,000 feet, and is surrounded by rolling hills and grasslands. The town is located near the Yellowstone River, and is close to several national parks and monuments, including Yellowstone National Park, Grand Teton National Park, and the Little Bighorn Battlefield National Monument.
The climate in Broadview is semi-arid, with hot summers and cold winters. The average annual temperature is around 50 degrees Fahrenheit, and the average annual precipitation is around 15 inches.
Economy
The economy of Broadview is largely based on agriculture and tourism. The town is home to several farms and ranches, which produce a variety of crops and livestock. The town is also home to several tourist attractions, including the Little Bighorn Battlefield National Monument, the Yellowstone River, and the Big Horn Mountains.
The town is also home to several small businesses, including restaurants, shops, and hotels. The town is also home to a small airport, which serves the surrounding area.
Demographics
As of the 2010 census, the population of Broadview was 1,072. The racial makeup of the town was 95.3% White, 0.7% African American, 0.7% Native American, 0.3% Asian, 0.1% Pacific Islander, and 2.0% from other races. The median household income was $37,500, and the median family income was $45,000.
The town is home to several churches, including the Broadview United Methodist Church, the Broadview Baptist Church, and the Broadview Lutheran Church. The town is also home to several schools, including Broadview Elementary School, Broadview Middle School, and Broadview High School.
Conclusion
Broadview, Montana is a small town located in the southeastern corner of the state, near the Wyoming border. It is part of the Yellowstone Valley, and is situated in the foothills of the Big Horn Mountains. The town has a population of just over 1,000 people, and is the county seat of Yellowstone County. The economy of Broadview is largely based on agriculture and tourism, and the town is home to several small businesses, churches, and schools. The town is also home to several tourist attractions, including the Little Bighorn Battlefield National Monument, the Yellowstone River, and the Big Horn Mountains.
Common Questions
What is Per Capita Income in Broadview?
Per Capita income in Broadview is $29,245.
What is the Median Family Income in Broadview?
Median Family Income in Broadview is $74,821.
What is the Median Household income in Broadview?
Median Household Income in Broadview is $60,313.
What is Inequality or Gini Index in Broadview?
Inequality or Gini Index in Broadview is 0.35.
What is the Total Population of Broadview?
Total Population of Broadview is 202.
What is the Total Male Population of Broadview?
Total Male Population of Broadview is 108.
What is the Total Female Population of Broadview?
Total Female Population of Broadview is 94.
What is the Ratio of Males per 100 Females in Broadview?
There are 114.89 Males per 100 Females in Broadview.
What is the Ratio of Females per 100 Males in Broadview?
There are 87.04 Females per 100 Males in Broadview.
What is the Median Population Age in Broadview?
Median Population Age in Broadview is 45.6 Years.
What is the Average Family Size in Broadview
Average Family Size in Broadview is 3.0 People.
What is the Average Household Size in Broadview
Average Household Size in Broadview is 2.4 People.
How Large is the Labor Force in Broadview?
There are 129 People in the Labor Forcein in Broadview.
What is the Percentage of People in the Labor Force in Broadview?
70.9% of People are in the Labor Force in Broadview.
What is the Unemployment Rate in Broadview?
Unemployment Rate in Broadview is 4.7%.