Starr School, MT Map & Demographics
Starr School Map
Starr School Overview
$7,946
PER CAPITA INCOME
0.42
INEQUALITY / GINI INDEX
229
TOTAL POPULATION
95
MALE POPULATION
134
FEMALE POPULATION
70.90
MALES / 100 FEMALES
141.05
FEMALES / 100 MALES
22.6
MEDIAN AGE
4.0
AVG FAMILY SIZE
3.9
AVG HOUSEHOLD SIZE
42
LABOR FORCE [ PEOPLE ]
31.3%
PERCENT IN LABOR FORCE
Income in Starr School
Income Overview in Starr School
| Characteristic | Number | Measure |
| Per Capita Income | 229 | $7,946 |
| Median Family Income | 51 | $0 |
| Mean Family Income | 51 | $28,567 |
| Median Household Income | 59 | $0 |
| Mean Household Income | 59 | $29,075 |
| Income Deficit | 51 | $0 |
| Wage / Income Gap (%) | 229 | 0.00% |
| Wage / Income Gap ($) | 229 | 100.00¢ per $1 |
| Gini / Inequality Index | 229 | 0.42 |
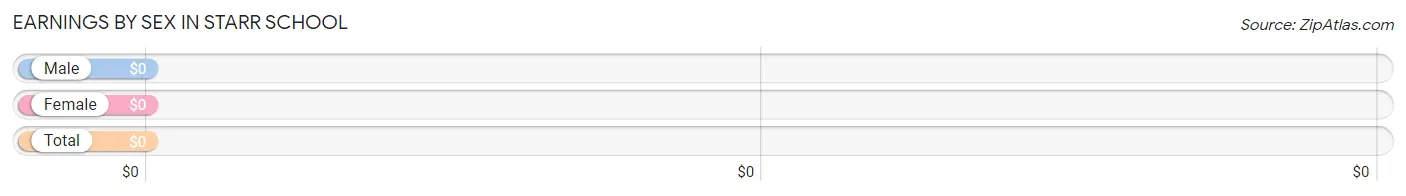
Earnings by Sex in Starr School
| Sex | Number | Average Earnings |
| Male | 27 (39.1%) | $0 |
| Female | 42 (60.9%) | $0 |
| Total | 69 (100.0%) | $0 |
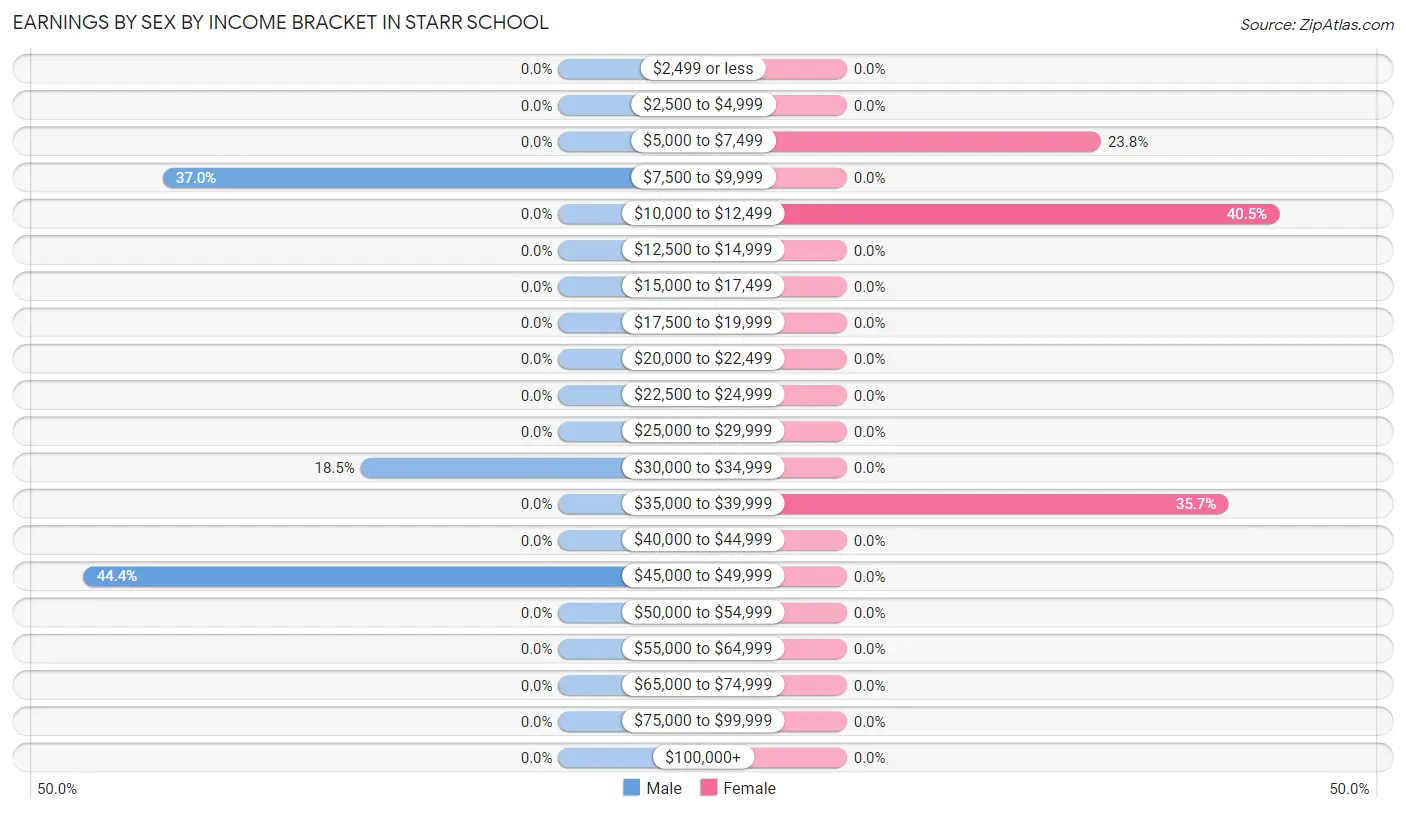
Earnings by Sex by Income Bracket in Starr School
The most common earnings brackets in Starr School are $45,000 to $49,999 for men (12 | 44.4%) and $10,000 to $12,499 for women (17 | 40.5%).
| Income | Male | Female |
| $2,499 or less | 0 (0.0%) | 0 (0.0%) |
| $2,500 to $4,999 | 0 (0.0%) | 0 (0.0%) |
| $5,000 to $7,499 | 0 (0.0%) | 10 (23.8%) |
| $7,500 to $9,999 | 10 (37.0%) | 0 (0.0%) |
| $10,000 to $12,499 | 0 (0.0%) | 17 (40.5%) |
| $12,500 to $14,999 | 0 (0.0%) | 0 (0.0%) |
| $15,000 to $17,499 | 0 (0.0%) | 0 (0.0%) |
| $17,500 to $19,999 | 0 (0.0%) | 0 (0.0%) |
| $20,000 to $22,499 | 0 (0.0%) | 0 (0.0%) |
| $22,500 to $24,999 | 0 (0.0%) | 0 (0.0%) |
| $25,000 to $29,999 | 0 (0.0%) | 0 (0.0%) |
| $30,000 to $34,999 | 5 (18.5%) | 0 (0.0%) |
| $35,000 to $39,999 | 0 (0.0%) | 15 (35.7%) |
| $40,000 to $44,999 | 0 (0.0%) | 0 (0.0%) |
| $45,000 to $49,999 | 12 (44.4%) | 0 (0.0%) |
| $50,000 to $54,999 | 0 (0.0%) | 0 (0.0%) |
| $55,000 to $64,999 | 0 (0.0%) | 0 (0.0%) |
| $65,000 to $74,999 | 0 (0.0%) | 0 (0.0%) |
| $75,000 to $99,999 | 0 (0.0%) | 0 (0.0%) |
| $100,000+ | 0 (0.0%) | 0 (0.0%) |
| Total | 27 (100.0%) | 42 (100.0%) |
Earnings by Sex by Educational Attainment in Starr School
| Educational Attainment | Male Income | Female Income |
| Less than High School | - | - |
| High School Diploma | - | - |
| College or Associate's Degree | - | - |
| Bachelor's Degree | - | - |
| Graduate Degree | - | - |
| Total | - | - |
Family Income in Starr School
Family Income Brackets in Starr School
According to the Starr School family income data, there are 16 families falling into the $15,000 to $24,999 income range, which is the most common income bracket and makes up 31.4% of all families.
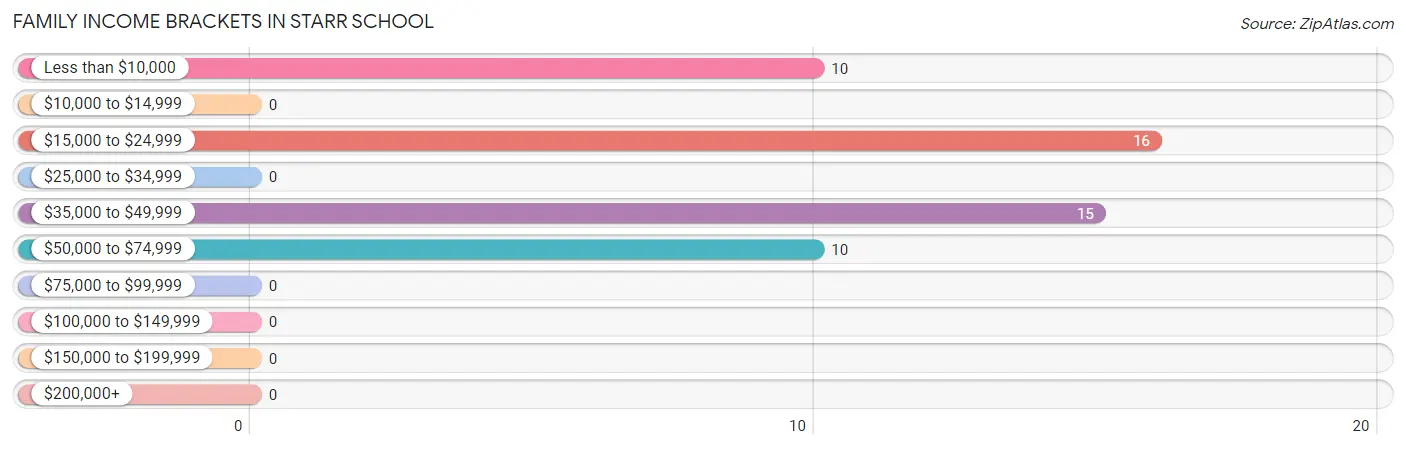
| Income Bracket | # Families | % Families |
| Less than $10,000 | 10 | 19.6% |
| $10,000 to $14,999 | 0 | 0.0% |
| $15,000 to $24,999 | 16 | 31.4% |
| $25,000 to $34,999 | 0 | 0.0% |
| $35,000 to $49,999 | 15 | 29.4% |
| $50,000 to $74,999 | 10 | 19.6% |
| $75,000 to $99,999 | 0 | 0.0% |
| $100,000 to $149,999 | 0 | 0.0% |
| $150,000 to $199,999 | 0 | 0.0% |
| $200,000+ | 0 | 0.0% |
Family Income by Famaliy Size in Starr School
| Income Bracket | # Families | Median Income |
| 2-Person Families | 5 (9.8%) | $0 |
| 3-Person Families | 26 (51.0%) | $0 |
| 4-Person Families | 20 (39.2%) | $0 |
| 5-Person Families | 0 (0.0%) | $0 |
| 6-Person Families | 0 (0.0%) | $0 |
| 7+ Person Families | 0 (0.0%) | $0 |
| Total | 51 (100.0%) | $0 |
Family Income by Number of Earners in Starr School
| Number of Earners | # Families | Median Income |
| No Earners | 10 (19.6%) | $0 |
| 1 Earner | 21 (41.2%) | $0 |
| 2 Earners | 20 (39.2%) | $0 |
| 3+ Earners | 0 (0.0%) | $0 |
| Total | 51 (100.0%) | $0 |
Household Income in Starr School
Household Income Brackets in Starr School
With 16 households falling in the category, the $15,000 to $24,999 income range is the most frequent in Starr School, accounting for 27.1% of all households.
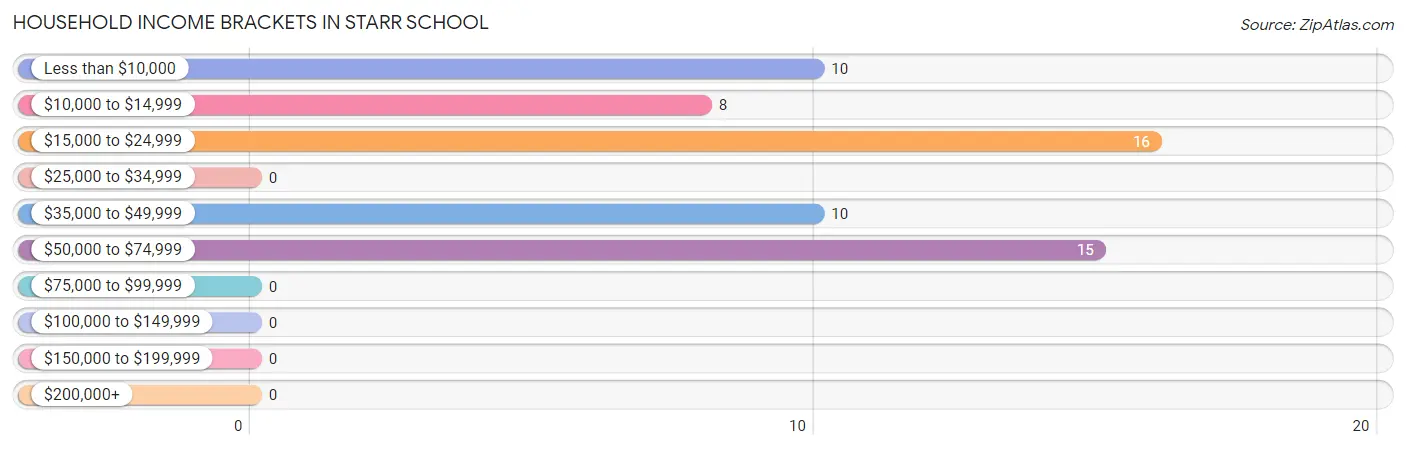
| Income Bracket | # Households | % Households |
| Less than $10,000 | 10 | 16.9% |
| $10,000 to $14,999 | 8 | 13.6% |
| $15,000 to $24,999 | 16 | 27.1% |
| $25,000 to $34,999 | 0 | 0.0% |
| $35,000 to $49,999 | 10 | 16.9% |
| $50,000 to $74,999 | 15 | 25.4% |
| $75,000 to $99,999 | 0 | 0.0% |
| $100,000 to $149,999 | 0 | 0.0% |
| $150,000 to $199,999 | 0 | 0.0% |
| $200,000+ | 0 | 0.0% |
Household Income by Householder Age in Starr School
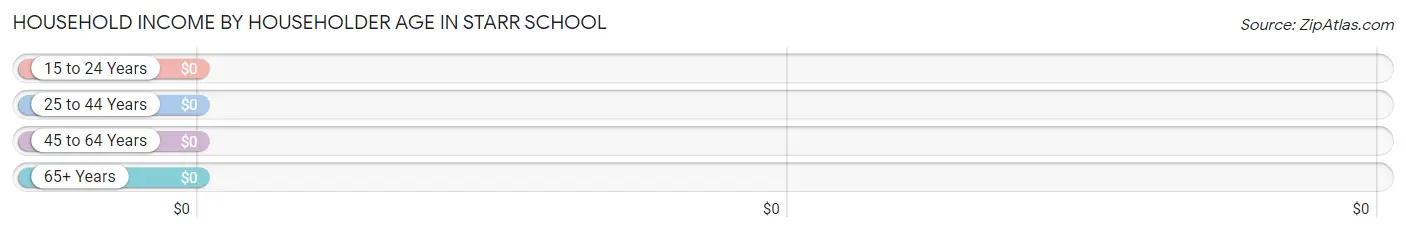
| Income Bracket | # Households | Median Income |
| 15 to 24 Years | 0 (0.0%) | $0 |
| 25 to 44 Years | 31 (52.5%) | $0 |
| 45 to 64 Years | 20 (33.9%) | $0 |
| 65+ Years | 8 (13.6%) | $0 |
| Total | 59 (100.0%) | $0 |
Poverty in Starr School
Income Below Poverty by Sex and Age in Starr School
With 44.1% poverty level for males and 52.2% for females among the residents of Starr School, 55 to 64 year old males and 6 to 11 year old females are the most vulnerable to poverty, with 10 males (100.0%) and 31 females (100.0%) in their respective age groups living below the poverty level.
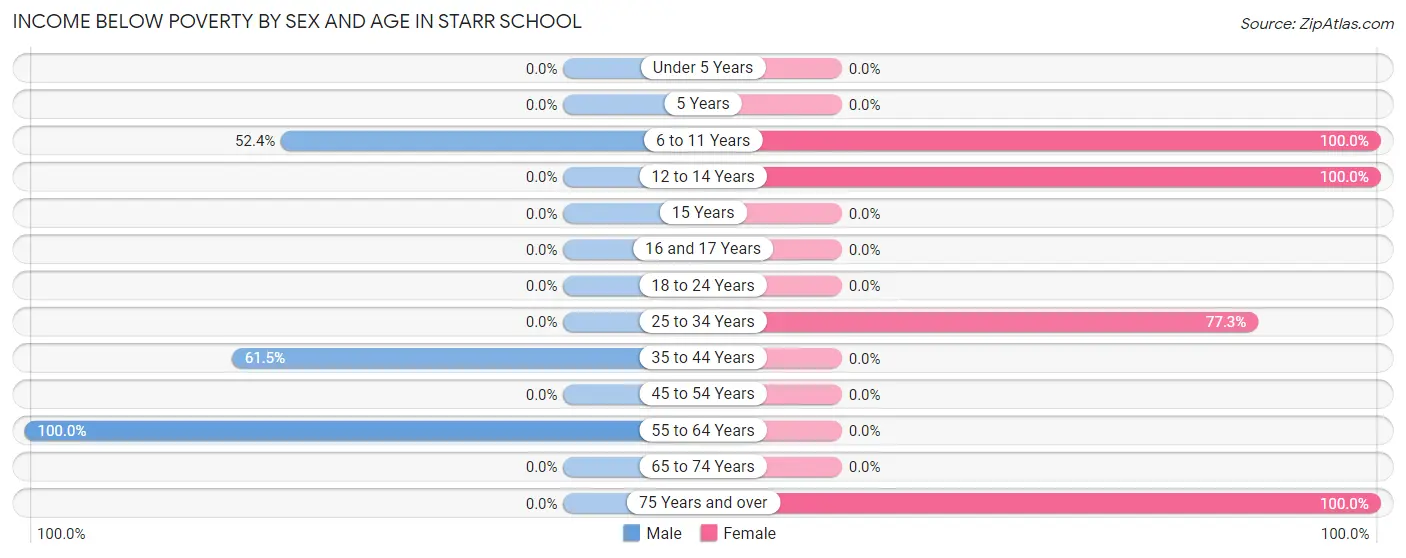
| Age Bracket | Male | Female |
| Under 5 Years | 0 (0.0%) | 0 (0.0%) |
| 5 Years | 0 (0.0%) | 0 (0.0%) |
| 6 to 11 Years | 11 (52.4%) | 31 (100.0%) |
| 12 to 14 Years | 0 (0.0%) | 14 (100.0%) |
| 15 Years | 0 (0.0%) | 0 (0.0%) |
| 16 and 17 Years | 0 (0.0%) | 0 (0.0%) |
| 18 to 24 Years | 0 (0.0%) | 0 (0.0%) |
| 25 to 34 Years | 0 (0.0%) | 17 (77.3%) |
| 35 to 44 Years | 16 (61.5%) | 0 (0.0%) |
| 45 to 54 Years | 0 (0.0%) | 0 (0.0%) |
| 55 to 64 Years | 10 (100.0%) | 0 (0.0%) |
| 65 to 74 Years | 0 (0.0%) | 0 (0.0%) |
| 75 Years and over | 0 (0.0%) | 8 (100.0%) |
| Total | 37 (44.1%) | 70 (52.2%) |
Income Above Poverty by Sex and Age in Starr School
According to the poverty statistics in Starr School, males aged 5 years and females aged under 5 years are the age groups that are most secure financially, with 100.0% of males and 100.0% of females in these age groups living above the poverty line.
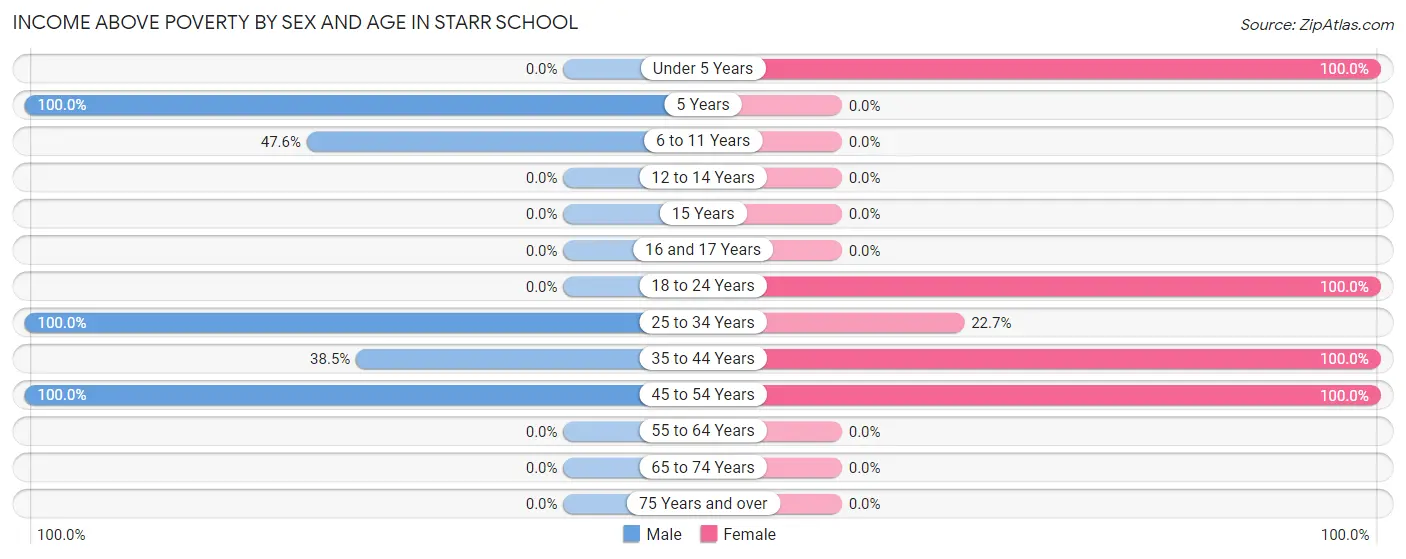
| Age Bracket | Male | Female |
| Under 5 Years | 0 (0.0%) | 8 (100.0%) |
| 5 Years | 10 (100.0%) | 0 (0.0%) |
| 6 to 11 Years | 10 (47.6%) | 0 (0.0%) |
| 12 to 14 Years | 0 (0.0%) | 0 (0.0%) |
| 15 Years | 0 (0.0%) | 0 (0.0%) |
| 16 and 17 Years | 0 (0.0%) | 0 (0.0%) |
| 18 to 24 Years | 0 (0.0%) | 31 (100.0%) |
| 25 to 34 Years | 5 (100.0%) | 5 (22.7%) |
| 35 to 44 Years | 10 (38.5%) | 10 (100.0%) |
| 45 to 54 Years | 12 (100.0%) | 10 (100.0%) |
| 55 to 64 Years | 0 (0.0%) | 0 (0.0%) |
| 65 to 74 Years | 0 (0.0%) | 0 (0.0%) |
| 75 Years and over | 0 (0.0%) | 0 (0.0%) |
| Total | 47 (55.9%) | 64 (47.8%) |
Income Below Poverty Among Married-Couple Families in Starr School
The poverty statistics for married-couple families in Starr School show that 44.4% or 16 of the total 36 families live below the poverty line. Families with 1 or 2 children have the highest poverty rate of 61.5%, comprising of 16 families. On the other hand, families with no children have the lowest poverty rate of 0.0%, which includes 0 families.
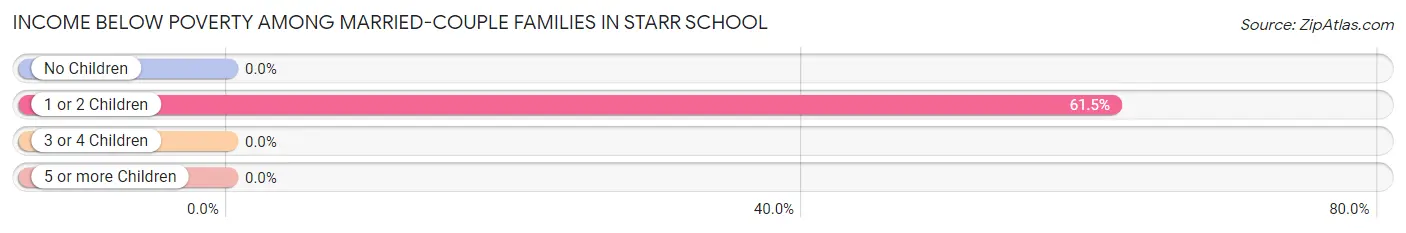
| Children | Above Poverty | Below Poverty |
| No Children | 10 (100.0%) | 0 (0.0%) |
| 1 or 2 Children | 10 (38.5%) | 16 (61.5%) |
| 3 or 4 Children | 0 (0.0%) | 0 (0.0%) |
| 5 or more Children | 0 (0.0%) | 0 (0.0%) |
| Total | 20 (55.6%) | 16 (44.4%) |
Income Below Poverty Among Single-Parent Households in Starr School
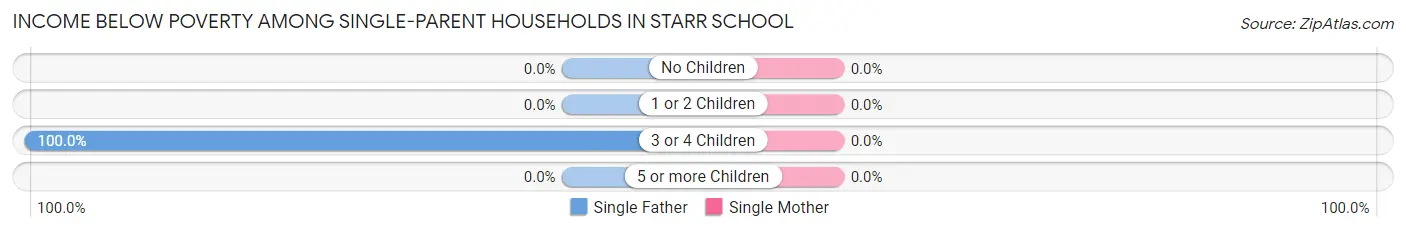
| Children | Single Father | Single Mother |
| No Children | 0 (0.0%) | 0 (0.0%) |
| 1 or 2 Children | 0 (0.0%) | 0 (0.0%) |
| 3 or 4 Children | 10 (100.0%) | 0 (0.0%) |
| 5 or more Children | 0 (0.0%) | 0 (0.0%) |
| Total | 10 (100.0%) | 0 (0.0%) |
Income Below Poverty Among Married-Couple vs Single-Parent Households in Starr School
The poverty data for Starr School shows that 16 of the married-couple family households (44.4%) and 10 of the single-parent households (66.7%) are living below the poverty level. Within the married-couple family households, those with 1 or 2 children have the highest poverty rate, with 16 households (61.5%) falling below the poverty line. Among the single-parent households, those with 3 or 4 children have the highest poverty rate, with 10 household (100.0%) living below poverty.
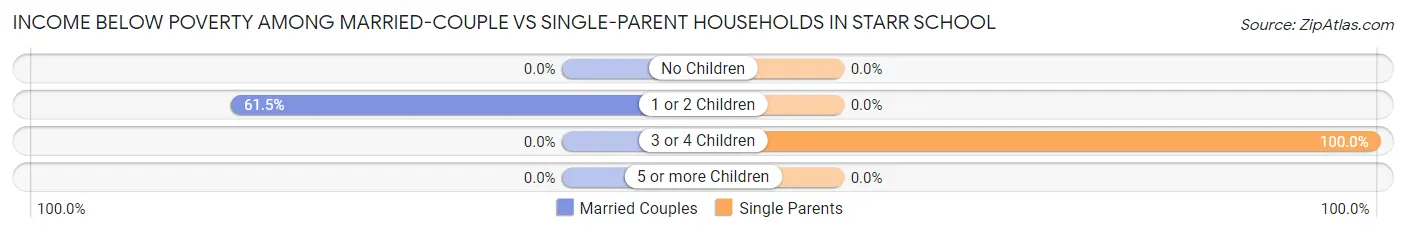
| Children | Married-Couple Families | Single-Parent Households |
| No Children | 0 (0.0%) | 0 (0.0%) |
| 1 or 2 Children | 16 (61.5%) | 0 (0.0%) |
| 3 or 4 Children | 0 (0.0%) | 10 (100.0%) |
| 5 or more Children | 0 (0.0%) | 0 (0.0%) |
| Total | 16 (44.4%) | 10 (66.7%) |
Race in Starr School
The most populous races in Starr School are , and Native / Alaskan (229 | 100.0%).
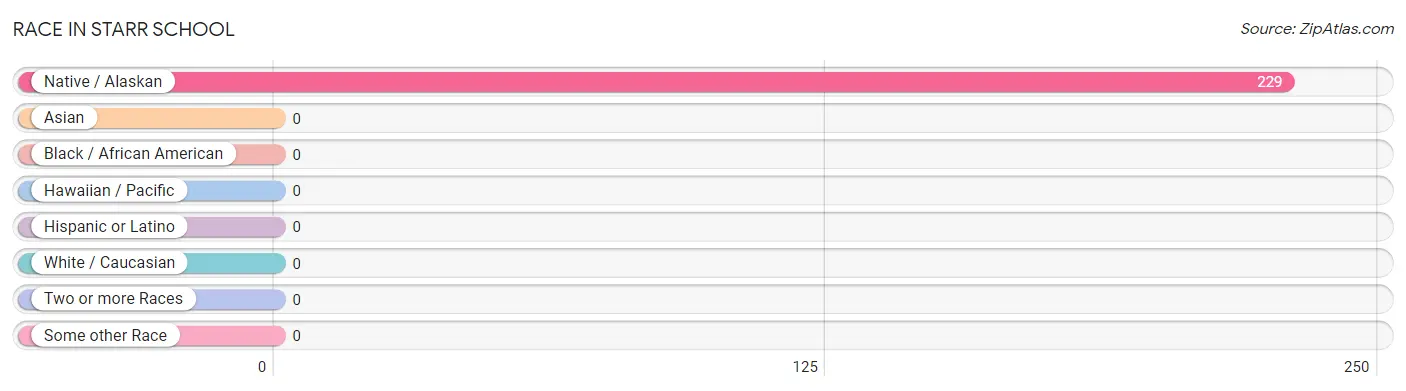
| Race | # Population | % Population |
| Asian | 0 | 0.0% |
| Black / African American | 0 | 0.0% |
| Hawaiian / Pacific | 0 | 0.0% |
| Hispanic or Latino | 0 | 0.0% |
| Native / Alaskan | 229 | 100.0% |
| White / Caucasian | 0 | 0.0% |
| Two or more Races | 0 | 0.0% |
| Some other Race | 0 | 0.0% |
| Total | 229 | 100.0% |
Ancestry in Starr School
The most populous ancestries reported in Starr School are Blackfeet (206 | 90.0%), and Iroquois (12 | 5.2%), together accounting for 95.2% of all Starr School residents.
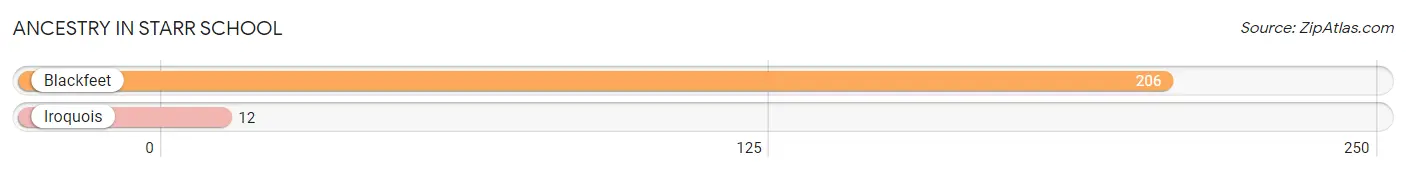
| Ancestry | # Population | % Population |
| Blackfeet | 206 | 90.0% |
| Iroquois | 12 | 5.2% | View All 2 Rows |
Immigrants in Starr School

| Immigration Origin | # Population | % Population | View All 0 Rows |
Sex and Age in Starr School
Sex and Age in Starr School
The most populous age groups in Starr School are 5 to 9 Years (31 | 32.6%) for men and 5 to 9 Years (31 | 23.1%) for women.
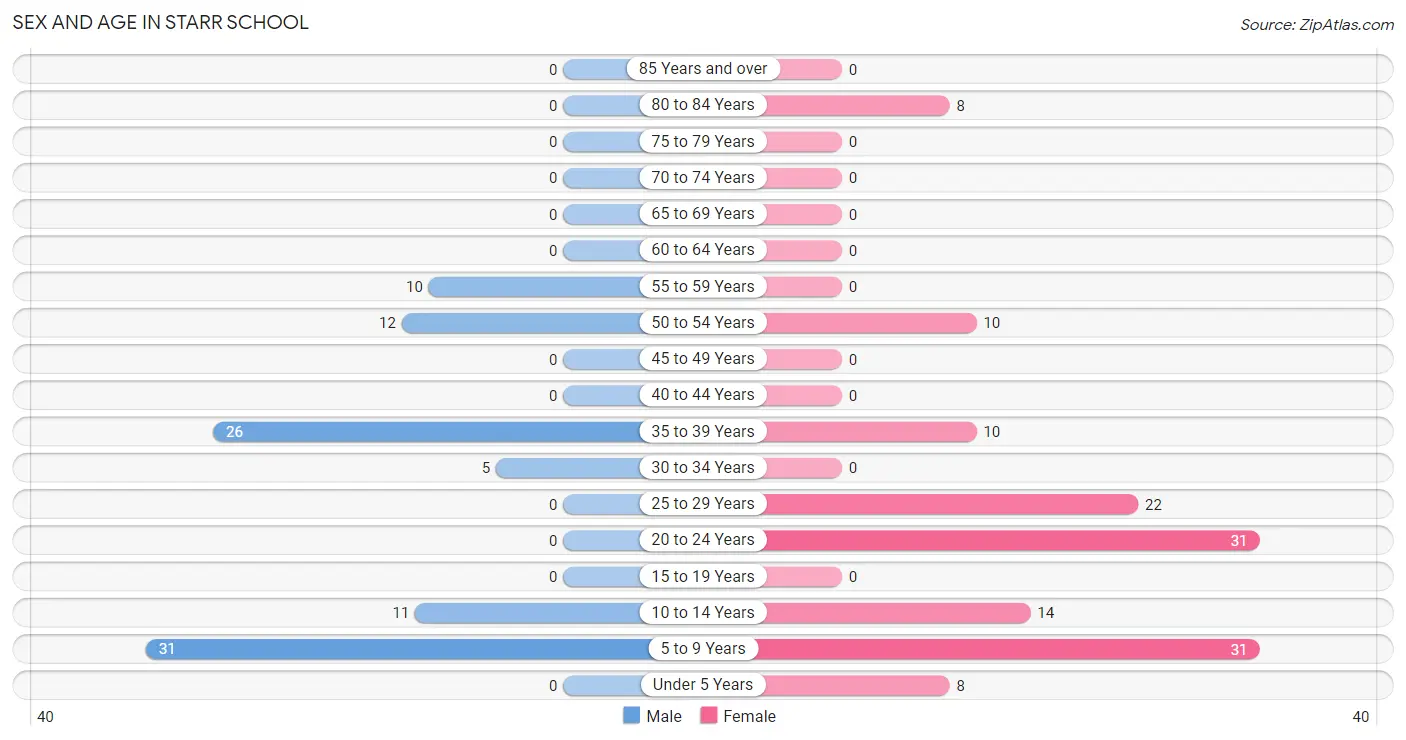
| Age Bracket | Male | Female |
| Under 5 Years | 0 (0.0%) | 8 (6.0%) |
| 5 to 9 Years | 31 (32.6%) | 31 (23.1%) |
| 10 to 14 Years | 11 (11.6%) | 14 (10.4%) |
| 15 to 19 Years | 0 (0.0%) | 0 (0.0%) |
| 20 to 24 Years | 0 (0.0%) | 31 (23.1%) |
| 25 to 29 Years | 0 (0.0%) | 22 (16.4%) |
| 30 to 34 Years | 5 (5.3%) | 0 (0.0%) |
| 35 to 39 Years | 26 (27.4%) | 10 (7.5%) |
| 40 to 44 Years | 0 (0.0%) | 0 (0.0%) |
| 45 to 49 Years | 0 (0.0%) | 0 (0.0%) |
| 50 to 54 Years | 12 (12.6%) | 10 (7.5%) |
| 55 to 59 Years | 10 (10.5%) | 0 (0.0%) |
| 60 to 64 Years | 0 (0.0%) | 0 (0.0%) |
| 65 to 69 Years | 0 (0.0%) | 0 (0.0%) |
| 70 to 74 Years | 0 (0.0%) | 0 (0.0%) |
| 75 to 79 Years | 0 (0.0%) | 0 (0.0%) |
| 80 to 84 Years | 0 (0.0%) | 8 (6.0%) |
| 85 Years and over | 0 (0.0%) | 0 (0.0%) |
| Total | 95 (100.0%) | 134 (100.0%) |
Families and Households in Starr School
Median Family Size in Starr School
The median family size in Starr School is 4.02 persons per family, with single male/father families (10 | 19.6%) accounting for the largest median family size of 4.8 persons per family. On the other hand, single female/mother families (5 | 9.8%) represent the smallest median family size with 2.60 persons per family.
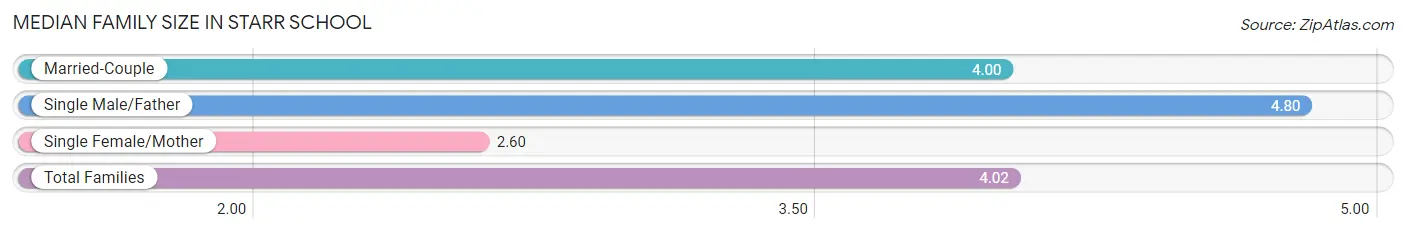
| Family Type | # Families | Family Size |
| Married-Couple | 36 (70.6%) | 4.00 |
| Single Male/Father | 10 (19.6%) | 4.80 |
| Single Female/Mother | 5 (9.8%) | 2.60 |
| Total Families | 51 (100.0%) | 4.02 |
Median Household Size in Starr School
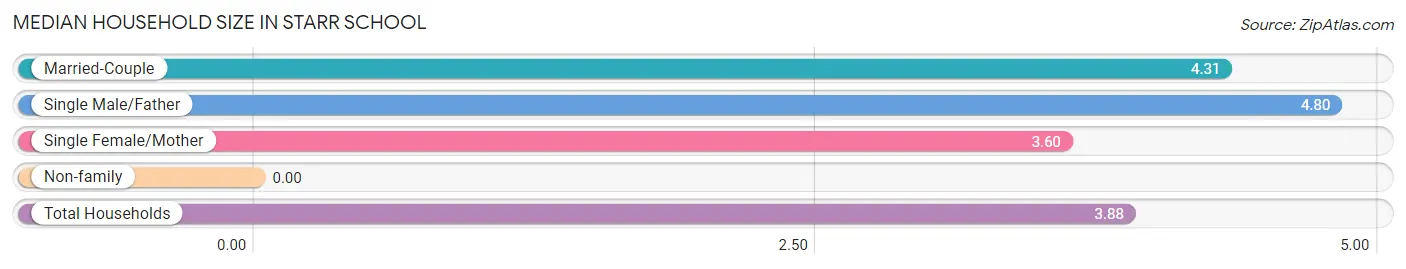
| Household Type | # Households | Household Size |
| Married-Couple | 36 (61.0%) | 4.31 |
| Single Male/Father | 10 (17.0%) | 4.80 |
| Single Female/Mother | 5 (8.5%) | 3.60 |
| Non-family | 8 (13.6%) | - |
| Total Households | 59 (100.0%) | 3.88 |
Household Size by Marriage Status in Starr School
Out of a total of 59 households in Starr School, 51 (86.4%) are family households, while 8 (13.6%) are nonfamily households. The most numerous type of family households are 4-person households, comprising 30, and the most common type of nonfamily households are 1-person households, comprising 8.
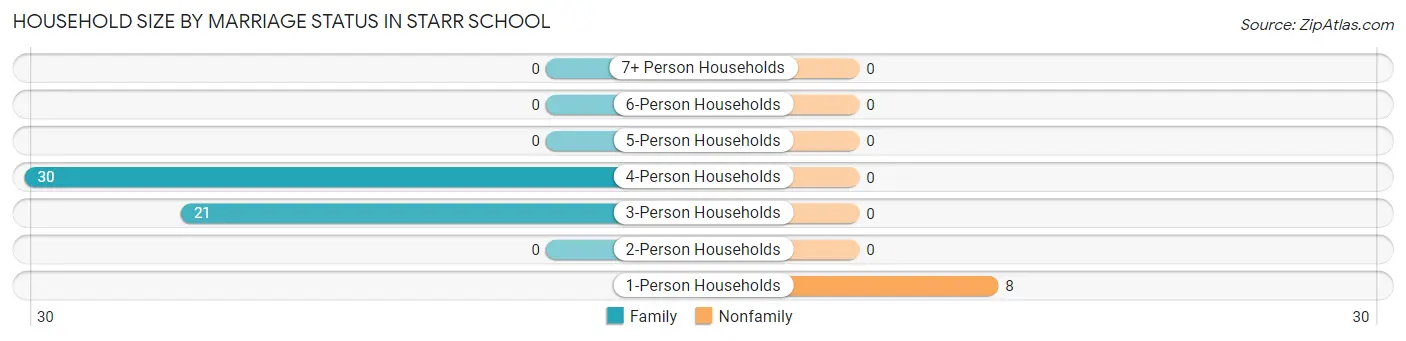
| Household Size | Family Households | Nonfamily Households |
| 1-Person Households | - | 8 (13.6%) |
| 2-Person Households | 0 (0.0%) | 0 (0.0%) |
| 3-Person Households | 21 (35.6%) | 0 (0.0%) |
| 4-Person Households | 30 (50.8%) | 0 (0.0%) |
| 5-Person Households | 0 (0.0%) | 0 (0.0%) |
| 6-Person Households | 0 (0.0%) | 0 (0.0%) |
| 7+ Person Households | 0 (0.0%) | 0 (0.0%) |
| Total | 51 (86.4%) | 8 (13.6%) |
Female Fertility in Starr School
Fertility by Age in Starr School
| Age Bracket | Women with Births | Births / 1,000 Women |
| 15 to 19 years | 0 (0.0%) | 0.0 |
| 20 to 34 years | 0 (0.0%) | 0.0 |
| 35 to 50 years | 0 (0.0%) | 0.0 |
| Total | 0 (0.0%) | 0.0 |
Fertility by Age by Marriage Status in Starr School
| Age Bracket | Married | Unmarried |
| 15 to 19 years | 0 (0.0%) | 0 (0.0%) |
| 20 to 34 years | 0 (0.0%) | 0 (0.0%) |
| 35 to 50 years | 0 (0.0%) | 0 (0.0%) |
| Total | 0 (0.0%) | 0 (0.0%) |
Fertility by Education in Starr School
| Educational Attainment | Women with Births | Births / 1,000 Women |
| Less than High School | 0 (0.0%) | 0.0 |
| High School Diploma | 0 (0.0%) | 0.0 |
| College or Associate's Degree | 0 (0.0%) | 0.0 |
| Bachelor's Degree | 0 (0.0%) | 0.0 |
| Graduate Degree | 0 (0.0%) | 0.0 |
| Total | 0 (0.0%) | 0.0 |
Fertility by Education by Marriage Status in Starr School
| Educational Attainment | Married | Unmarried |
| Less than High School | 0 (0.0%) | 0 (0.0%) |
| High School Diploma | 0 (0.0%) | 0 (0.0%) |
| College or Associate's Degree | 0 (0.0%) | 0 (0.0%) |
| Bachelor's Degree | 0 (0.0%) | 0 (0.0%) |
| Graduate Degree | 0 (0.0%) | 0 (0.0%) |
| Total | 0 (0.0%) | 0 (0.0%) |
Employment Characteristics in Starr School
Employment by Class of Employer in Starr School
Among the 42 employed individuals in Starr School, local government employees (22 | 52.4%), private company employees (10 | 23.8%), and federal government employees (10 | 23.8%) make up the most common classes of employment.
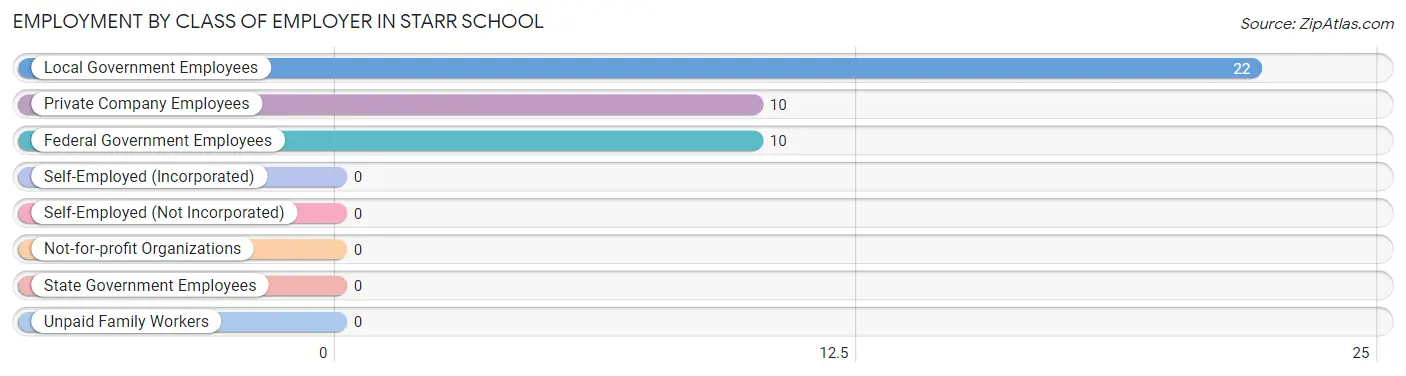
| Employer Class | # Employees | % Employees |
| Private Company Employees | 10 | 23.8% |
| Self-Employed (Incorporated) | 0 | 0.0% |
| Self-Employed (Not Incorporated) | 0 | 0.0% |
| Not-for-profit Organizations | 0 | 0.0% |
| Local Government Employees | 22 | 52.4% |
| State Government Employees | 0 | 0.0% |
| Federal Government Employees | 10 | 23.8% |
| Unpaid Family Workers | 0 | 0.0% |
| Total | 42 | 100.0% |
Employment Status by Age in Starr School
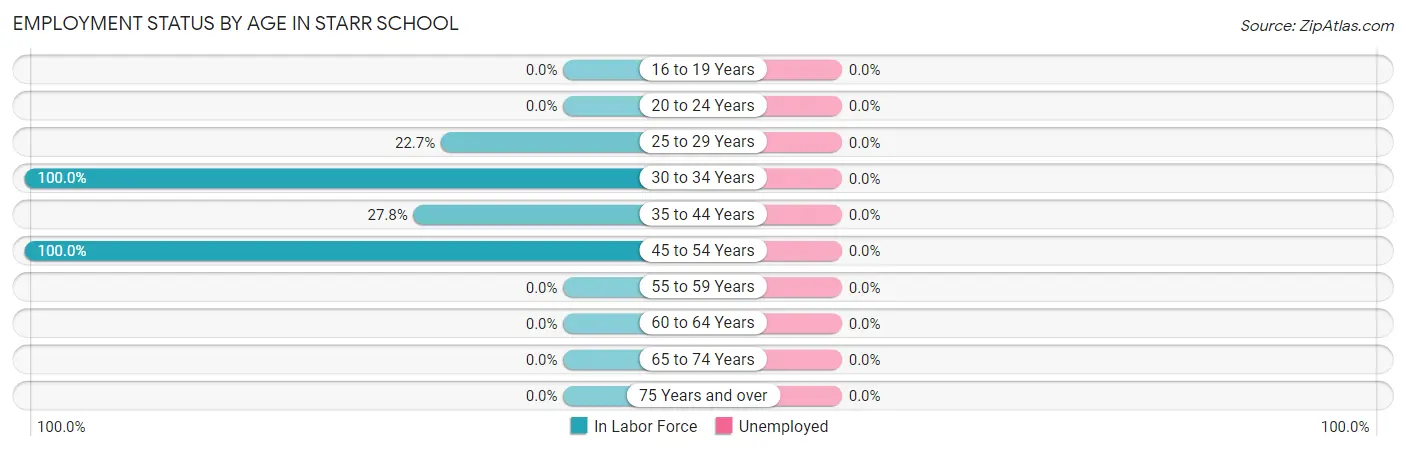
| Age Bracket | In Labor Force | Unemployed |
| 16 to 19 Years | 0 (0.0%) | 0 (0.0%) |
| 20 to 24 Years | 0 (0.0%) | 0 (0.0%) |
| 25 to 29 Years | 5 (22.7%) | 0 (0.0%) |
| 30 to 34 Years | 5 (100.0%) | 0 (0.0%) |
| 35 to 44 Years | 10 (27.8%) | 0 (0.0%) |
| 45 to 54 Years | 22 (100.0%) | 0 (0.0%) |
| 55 to 59 Years | 0 (0.0%) | 0 (0.0%) |
| 60 to 64 Years | 0 (0.0%) | 0 (0.0%) |
| 65 to 74 Years | 0 (0.0%) | 0 (0.0%) |
| 75 Years and over | 0 (0.0%) | 0 (0.0%) |
| Total | 42 (31.3%) | 0 (0.0%) |
Employment Status by Educational Attainment in Starr School
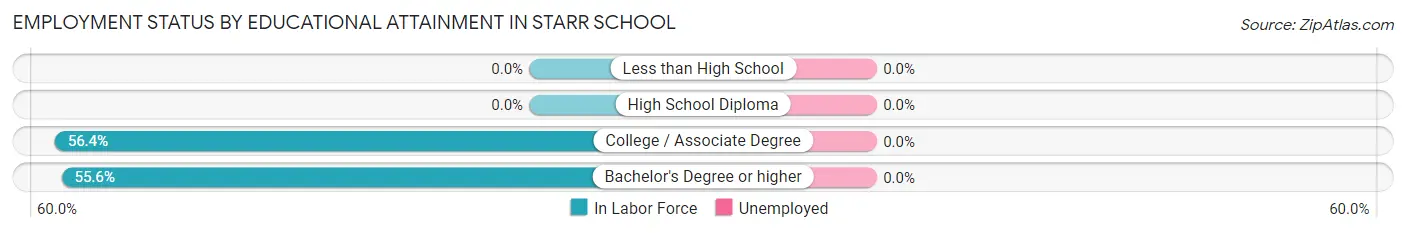
| Educational Attainment | In Labor Force | Unemployed |
| Less than High School | 0 (0.0%) | 0 (0.0%) |
| High School Diploma | 0 (0.0%) | 0 (0.0%) |
| College / Associate Degree | 22 (56.4%) | 0 (0.0%) |
| Bachelor's Degree or higher | 20 (55.6%) | 0 (0.0%) |
| Total | 42 (44.2%) | 0 (0.0%) |
Employment Occupations by Sex in Starr School
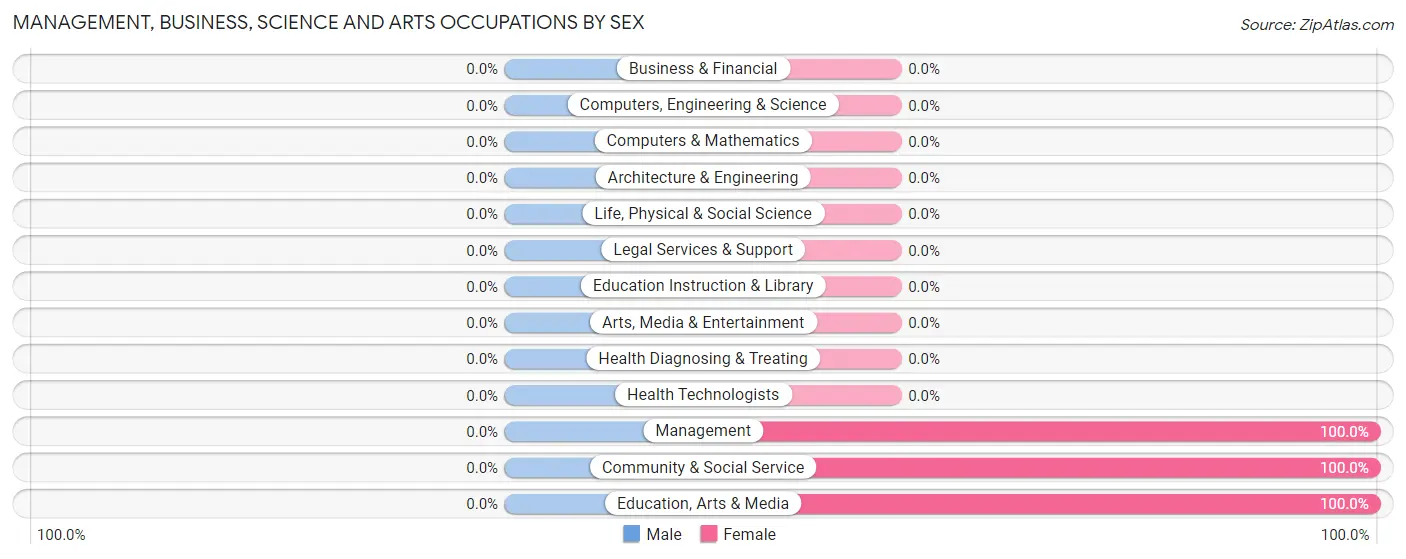
Management, Business, Science and Arts Occupations
The most common Management, Business, Science and Arts occupations in Starr School are Management (10 | 23.8%), Community & Social Service (10 | 23.8%), and Education, Arts & Media (10 | 23.8%).
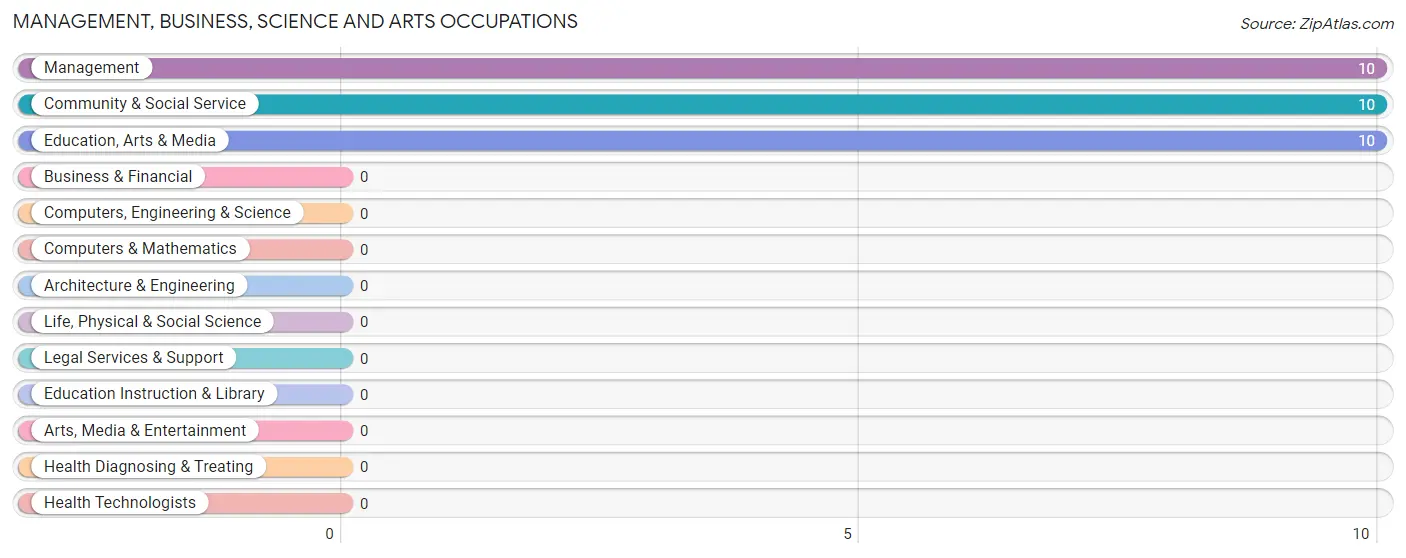
Management, Business, Science and Arts Occupations by Sex
| Occupation | Male | Female |
| Management | 0 (0.0%) | 10 (100.0%) |
| Business & Financial | 0 (0.0%) | 0 (0.0%) |
| Computers, Engineering & Science | 0 (0.0%) | 0 (0.0%) |
| Computers & Mathematics | 0 (0.0%) | 0 (0.0%) |
| Architecture & Engineering | 0 (0.0%) | 0 (0.0%) |
| Life, Physical & Social Science | 0 (0.0%) | 0 (0.0%) |
| Community & Social Service | 0 (0.0%) | 10 (100.0%) |
| Education, Arts & Media | 0 (0.0%) | 10 (100.0%) |
| Legal Services & Support | 0 (0.0%) | 0 (0.0%) |
| Education Instruction & Library | 0 (0.0%) | 0 (0.0%) |
| Arts, Media & Entertainment | 0 (0.0%) | 0 (0.0%) |
| Health Diagnosing & Treating | 0 (0.0%) | 0 (0.0%) |
| Health Technologists | 0 (0.0%) | 0 (0.0%) |
| Total (Category) | 0 (0.0%) | 20 (100.0%) |
| Total (Overall) | 17 (40.5%) | 25 (59.5%) |
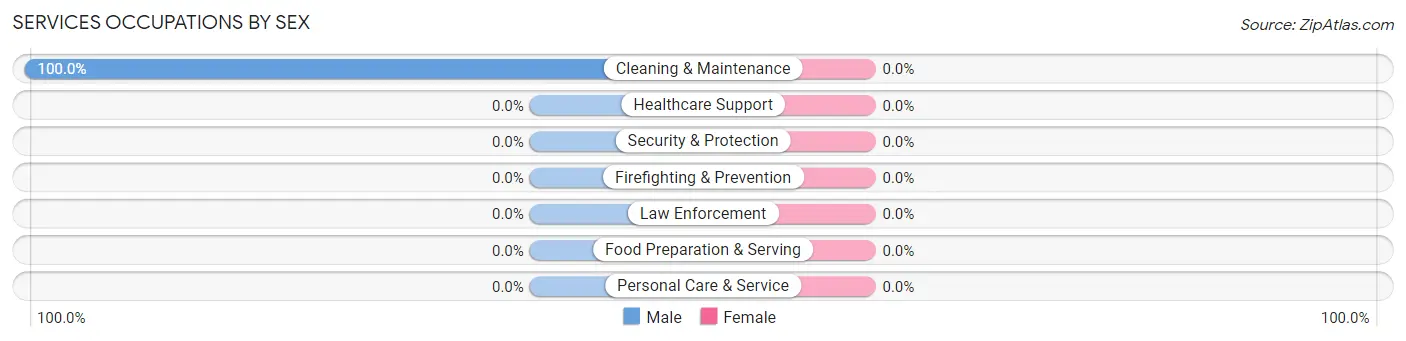
Services Occupations
The most common Services occupations in Starr School are , and Cleaning & Maintenance (12 | 28.6%).
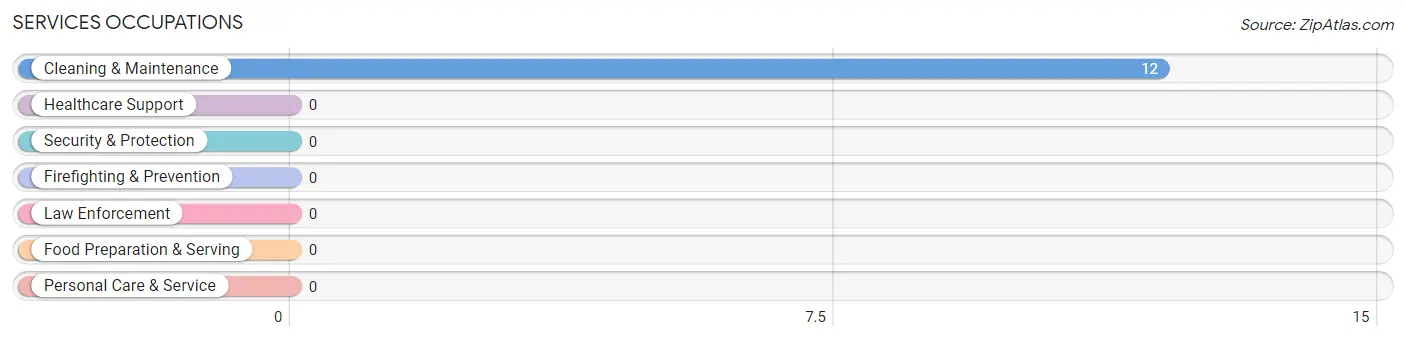
Services Occupations by Sex
| Occupation | Male | Female |
| Healthcare Support | 0 (0.0%) | 0 (0.0%) |
| Security & Protection | 0 (0.0%) | 0 (0.0%) |
| Firefighting & Prevention | 0 (0.0%) | 0 (0.0%) |
| Law Enforcement | 0 (0.0%) | 0 (0.0%) |
| Food Preparation & Serving | 0 (0.0%) | 0 (0.0%) |
| Cleaning & Maintenance | 12 (100.0%) | 0 (0.0%) |
| Personal Care & Service | 0 (0.0%) | 0 (0.0%) |
| Total (Category) | 12 (100.0%) | 0 (0.0%) |
| Total (Overall) | 17 (40.5%) | 25 (59.5%) |
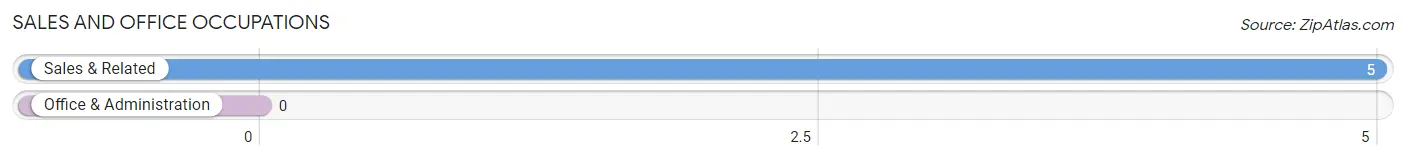
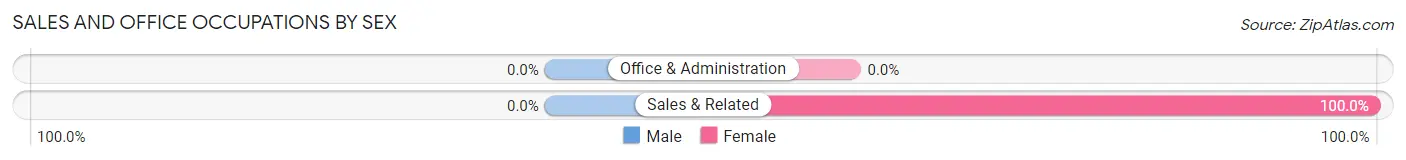
Sales and Office Occupations
The most common Sales and Office occupations in Starr School are , and Sales & Related (5 | 11.9%).
Sales and Office Occupations by Sex
| Occupation | Male | Female |
| Sales & Related | 0 (0.0%) | 5 (100.0%) |
| Office & Administration | 0 (0.0%) | 0 (0.0%) |
| Total (Category) | 0 (0.0%) | 5 (100.0%) |
| Total (Overall) | 17 (40.5%) | 25 (59.5%) |
Natural Resources, Construction and Maintenance Occupations
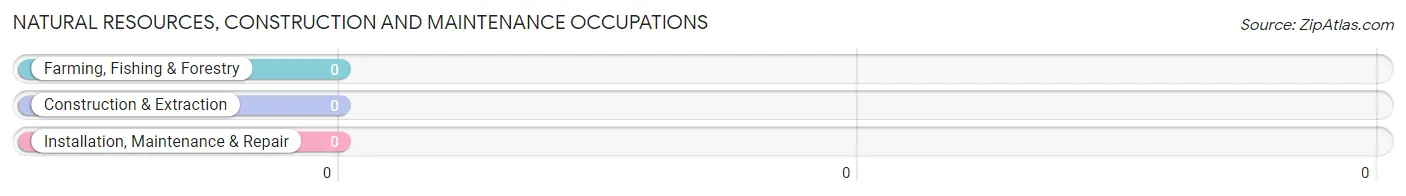
Natural Resources, Construction and Maintenance Occupations by Sex
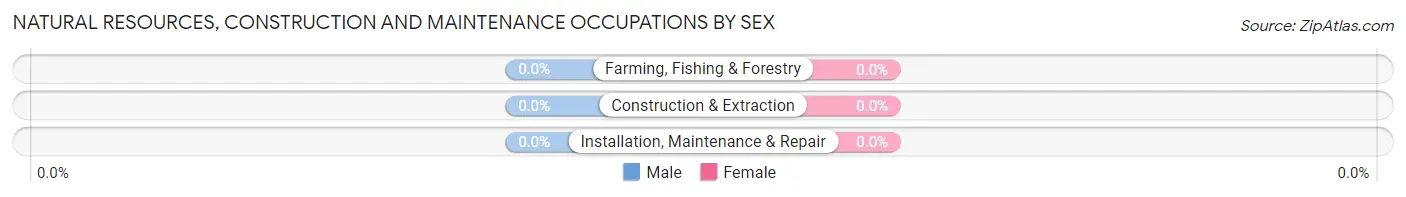
| Occupation | Male | Female |
| Farming, Fishing & Forestry | 0 (0.0%) | 0 (0.0%) |
| Construction & Extraction | 0 (0.0%) | 0 (0.0%) |
| Installation, Maintenance & Repair | 0 (0.0%) | 0 (0.0%) |
| Total (Category) | 0 (0.0%) | 0 (0.0%) |
| Total (Overall) | 17 (40.5%) | 25 (59.5%) |
Production, Transportation and Moving Occupations
The most common Production, Transportation and Moving occupations in Starr School are , and Production (5 | 11.9%).
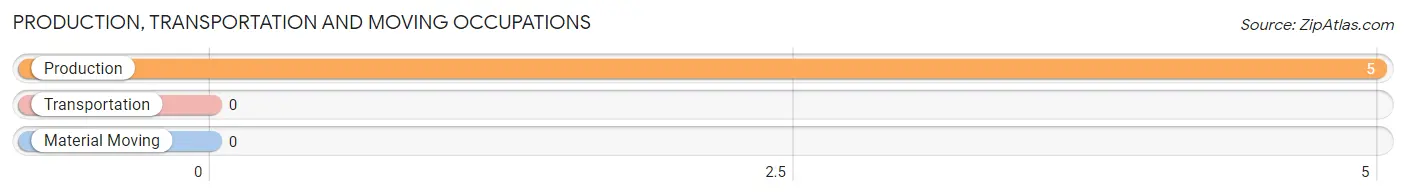
Production, Transportation and Moving Occupations by Sex
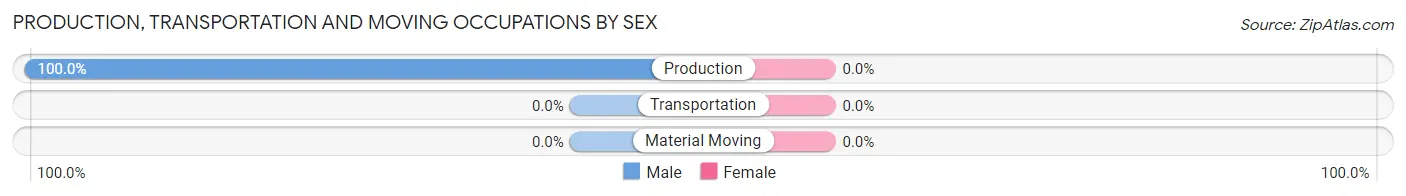
| Occupation | Male | Female |
| Production | 5 (100.0%) | 0 (0.0%) |
| Transportation | 0 (0.0%) | 0 (0.0%) |
| Material Moving | 0 (0.0%) | 0 (0.0%) |
| Total (Category) | 5 (100.0%) | 0 (0.0%) |
| Total (Overall) | 17 (40.5%) | 25 (59.5%) |
Employment Industries by Sex in Starr School
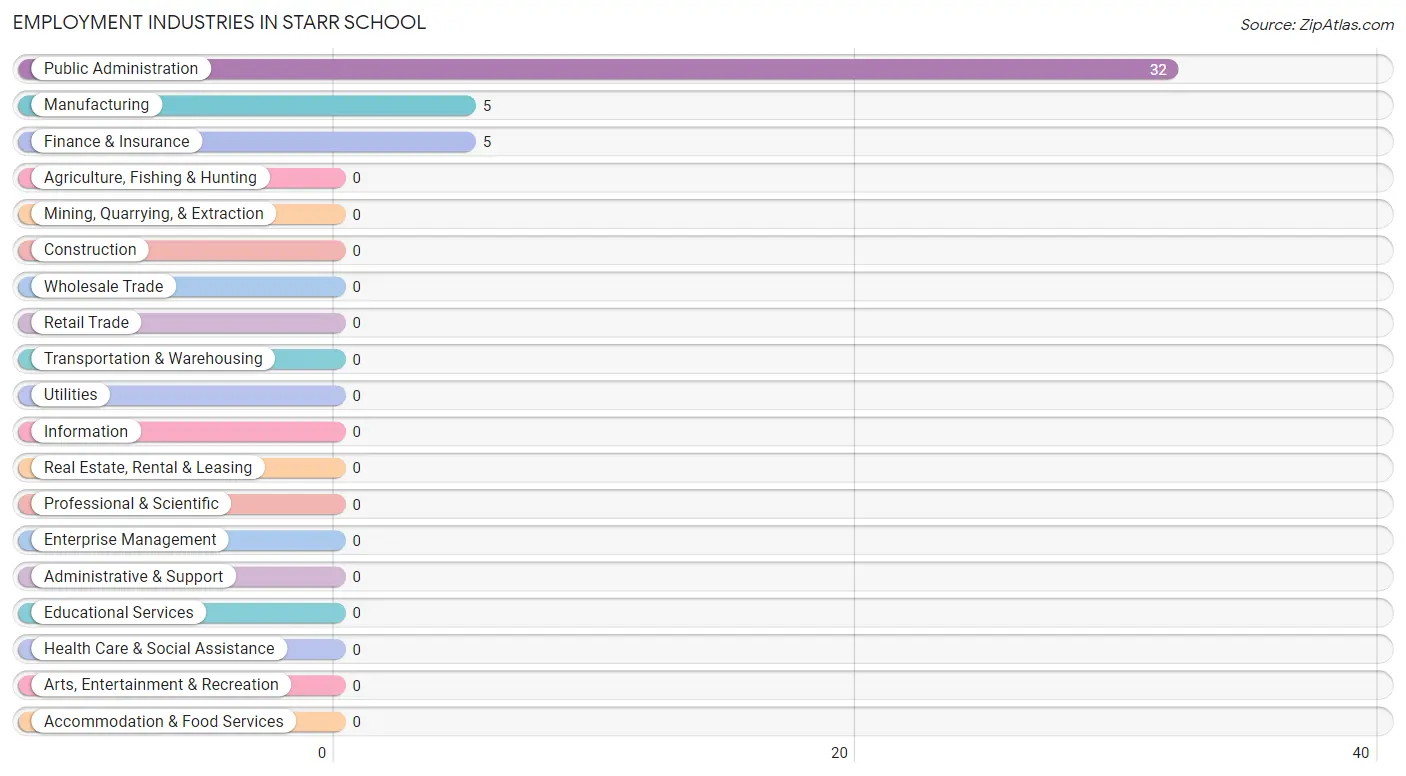
Employment Industries in Starr School
The major employment industries in Starr School include Public Administration (32 | 76.2%), Manufacturing (5 | 11.9%), and Finance & Insurance (5 | 11.9%).
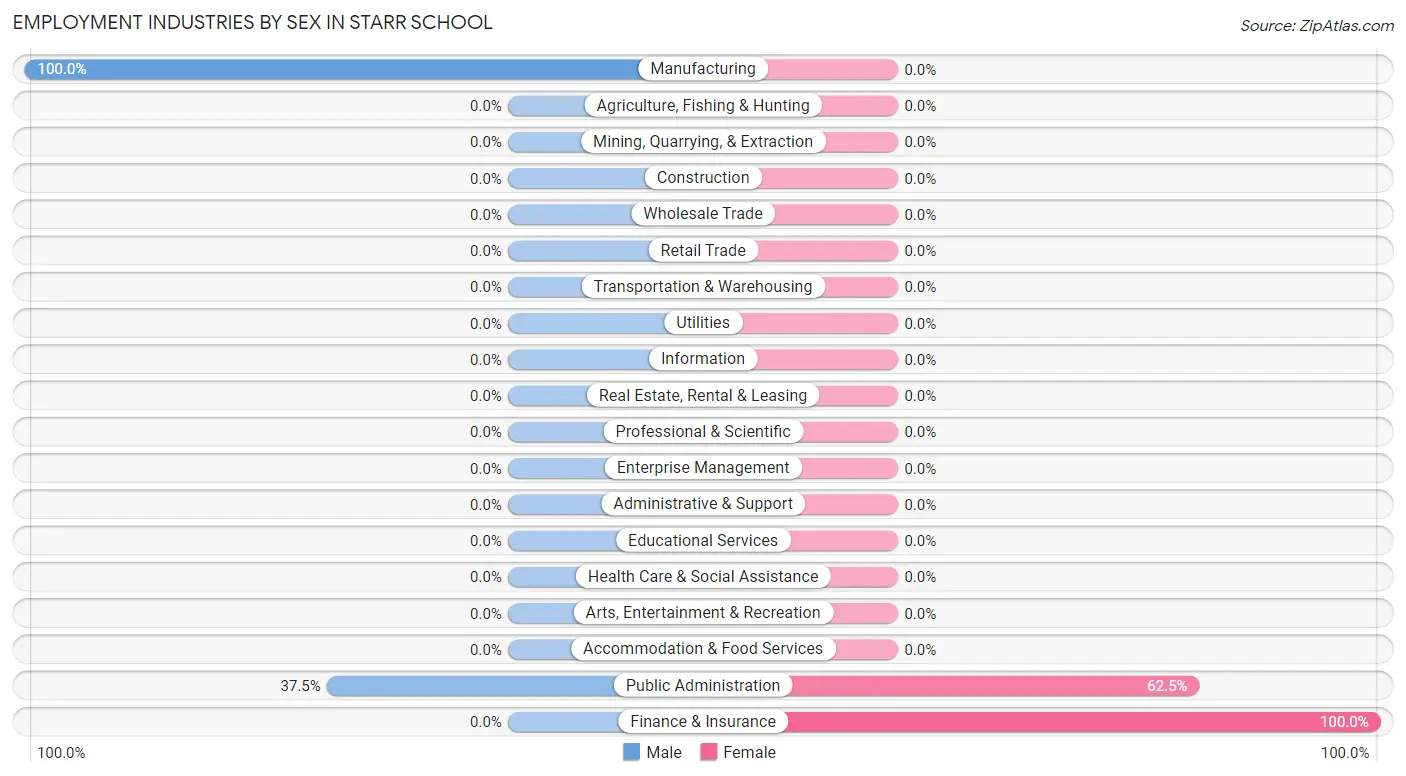
Employment Industries by Sex in Starr School
The Starr School industries that see more men than women are Manufacturing (100.0%), and Public Administration (37.5%), whereas the industries that tend to have a higher number of women are Finance & Insurance (100.0%), and Public Administration (62.5%).
| Industry | Male | Female |
| Agriculture, Fishing & Hunting | 0 (0.0%) | 0 (0.0%) |
| Mining, Quarrying, & Extraction | 0 (0.0%) | 0 (0.0%) |
| Construction | 0 (0.0%) | 0 (0.0%) |
| Manufacturing | 5 (100.0%) | 0 (0.0%) |
| Wholesale Trade | 0 (0.0%) | 0 (0.0%) |
| Retail Trade | 0 (0.0%) | 0 (0.0%) |
| Transportation & Warehousing | 0 (0.0%) | 0 (0.0%) |
| Utilities | 0 (0.0%) | 0 (0.0%) |
| Information | 0 (0.0%) | 0 (0.0%) |
| Finance & Insurance | 0 (0.0%) | 5 (100.0%) |
| Real Estate, Rental & Leasing | 0 (0.0%) | 0 (0.0%) |
| Professional & Scientific | 0 (0.0%) | 0 (0.0%) |
| Enterprise Management | 0 (0.0%) | 0 (0.0%) |
| Administrative & Support | 0 (0.0%) | 0 (0.0%) |
| Educational Services | 0 (0.0%) | 0 (0.0%) |
| Health Care & Social Assistance | 0 (0.0%) | 0 (0.0%) |
| Arts, Entertainment & Recreation | 0 (0.0%) | 0 (0.0%) |
| Accommodation & Food Services | 0 (0.0%) | 0 (0.0%) |
| Public Administration | 12 (37.5%) | 20 (62.5%) |
| Total | 17 (40.5%) | 25 (59.5%) |
Education in Starr School
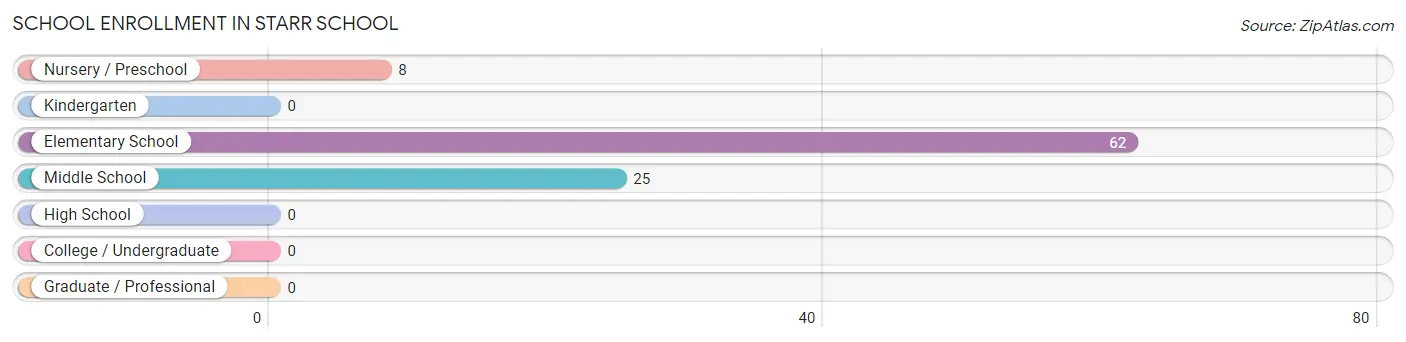
School Enrollment in Starr School
The most common levels of schooling among the 95 students in Starr School are elementary school (62 | 65.3%), middle school (25 | 26.3%), and nursery / preschool (8 | 8.4%).
| School Level | # Students | % Students |
| Nursery / Preschool | 8 | 8.4% |
| Kindergarten | 0 | 0.0% |
| Elementary School | 62 | 65.3% |
| Middle School | 25 | 26.3% |
| High School | 0 | 0.0% |
| College / Undergraduate | 0 | 0.0% |
| Graduate / Professional | 0 | 0.0% |
| Total | 95 | 100.0% |
School Enrollment by Age by Funding Source in Starr School
Out of a total of 95 students who are enrolled in schools in Starr School, 18 (18.9%) attend a private institution, while the remaining 77 (81.1%) are enrolled in public schools. The age group of 5 to 9 year old has the highest likelihood of being enrolled in private schools, with 18 (29.0% in the age bracket) enrolled. Conversely, the age group of 3 to 4 year olds has the lowest likelihood of being enrolled in a private school, with 8 (100.0% in the age bracket) attending a public institution.
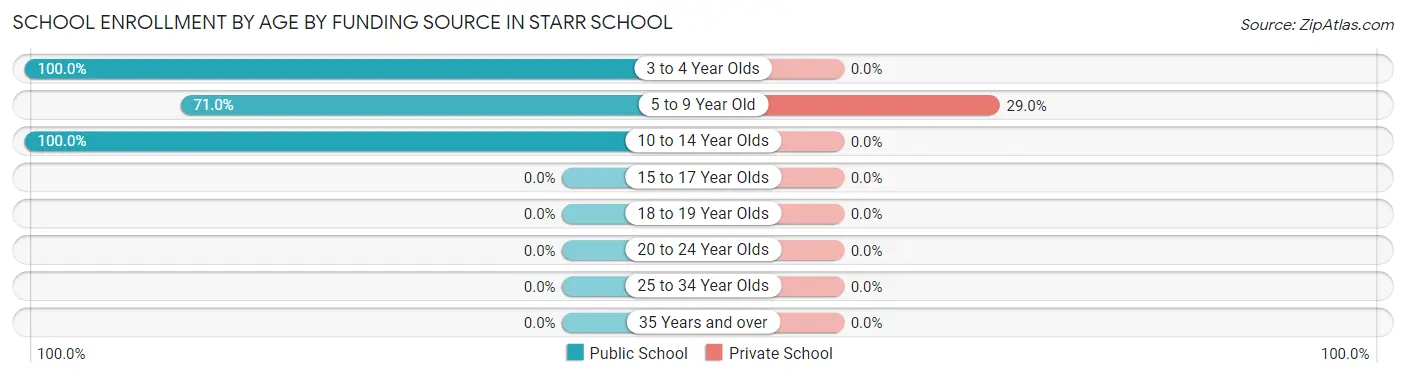
| Age Bracket | Public School | Private School |
| 3 to 4 Year Olds | 8 (100.0%) | 0 (0.0%) |
| 5 to 9 Year Old | 44 (71.0%) | 18 (29.0%) |
| 10 to 14 Year Olds | 25 (100.0%) | 0 (0.0%) |
| 15 to 17 Year Olds | 0 (0.0%) | 0 (0.0%) |
| 18 to 19 Year Olds | 0 (0.0%) | 0 (0.0%) |
| 20 to 24 Year Olds | 0 (0.0%) | 0 (0.0%) |
| 25 to 34 Year Olds | 0 (0.0%) | 0 (0.0%) |
| 35 Years and over | 0 (0.0%) | 0 (0.0%) |
| Total | 77 (81.1%) | 18 (18.9%) |
Educational Attainment by Field of Study in Starr School
Business (16 | 36.4%), computers & mathematics (10 | 22.7%), education (10 | 22.7%), and multidisciplinary studies (8 | 18.2%) are the most common fields of study among 44 individuals in Starr School who have obtained a bachelor's degree or higher.
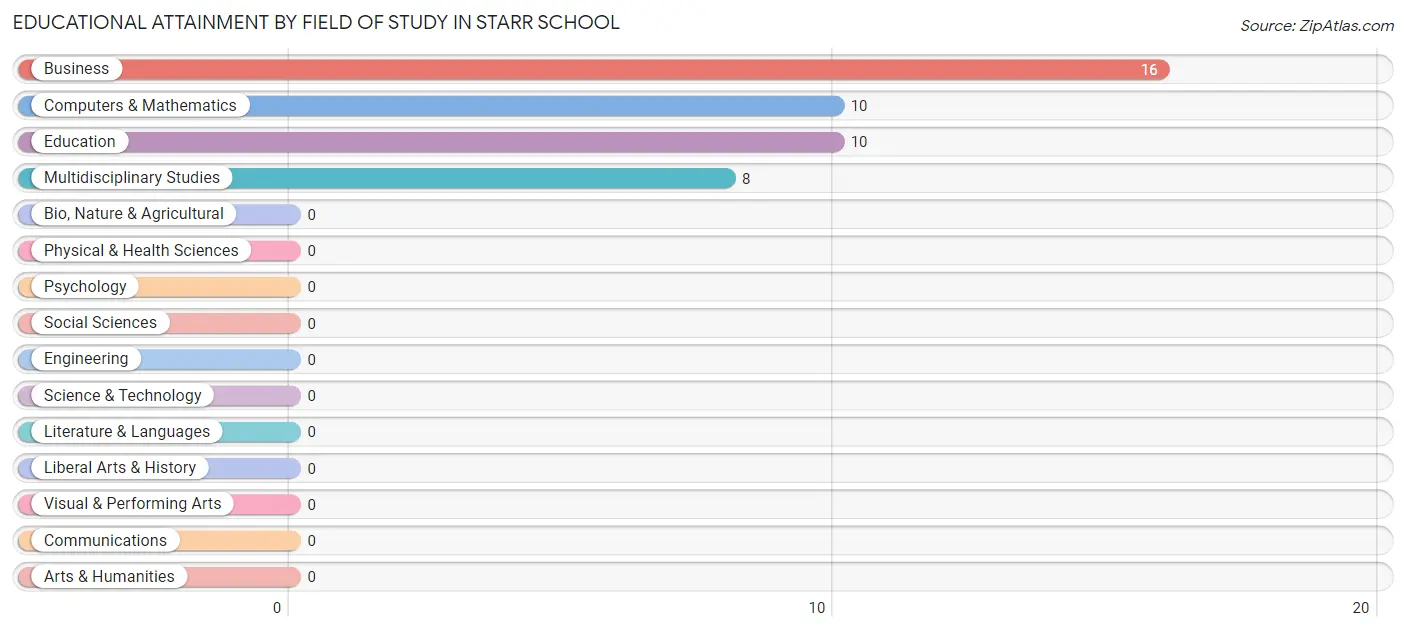
| Field of Study | # Graduates | % Graduates |
| Computers & Mathematics | 10 | 22.7% |
| Bio, Nature & Agricultural | 0 | 0.0% |
| Physical & Health Sciences | 0 | 0.0% |
| Psychology | 0 | 0.0% |
| Social Sciences | 0 | 0.0% |
| Engineering | 0 | 0.0% |
| Multidisciplinary Studies | 8 | 18.2% |
| Science & Technology | 0 | 0.0% |
| Business | 16 | 36.4% |
| Education | 10 | 22.7% |
| Literature & Languages | 0 | 0.0% |
| Liberal Arts & History | 0 | 0.0% |
| Visual & Performing Arts | 0 | 0.0% |
| Communications | 0 | 0.0% |
| Arts & Humanities | 0 | 0.0% |
| Total | 44 | 100.0% |
Transportation & Commute in Starr School
Vehicle Availability by Sex in Starr School
The most prevalent vehicle ownership categories in Starr School are males with 1 vehicle (12, accounting for 70.6%) and females with 1 vehicle (20, making up 48.0%).
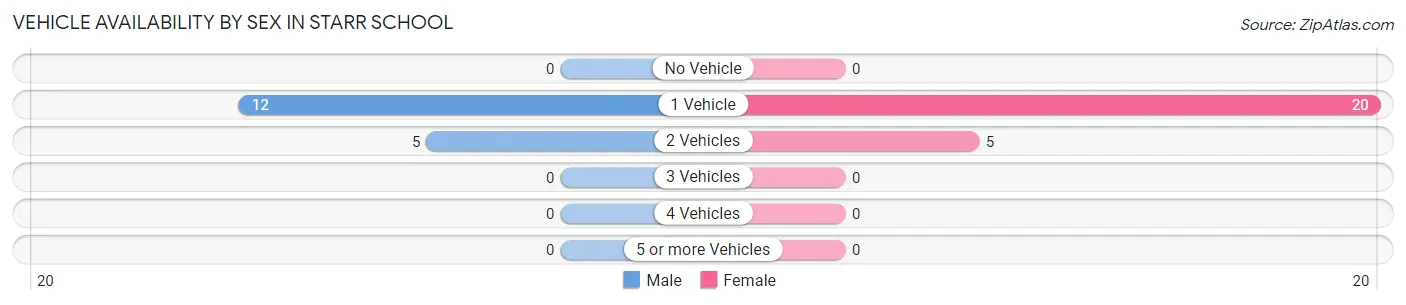
| Vehicles Available | Male | Female |
| No Vehicle | 0 (0.0%) | 0 (0.0%) |
| 1 Vehicle | 12 (70.6%) | 20 (80.0%) |
| 2 Vehicles | 5 (29.4%) | 5 (20.0%) |
| 3 Vehicles | 0 (0.0%) | 0 (0.0%) |
| 4 Vehicles | 0 (0.0%) | 0 (0.0%) |
| 5 or more Vehicles | 0 (0.0%) | 0 (0.0%) |
| Total | 17 (100.0%) | 25 (100.0%) |
Commute Time in Starr School
The most frequently occuring commute durations in Starr School are 30 to 34 minutes (32 commuters, 86.5%), less than 5 minutes (5 commuters, 13.5%), and 5 to 9 minutes (0 commuters, 0.0%).
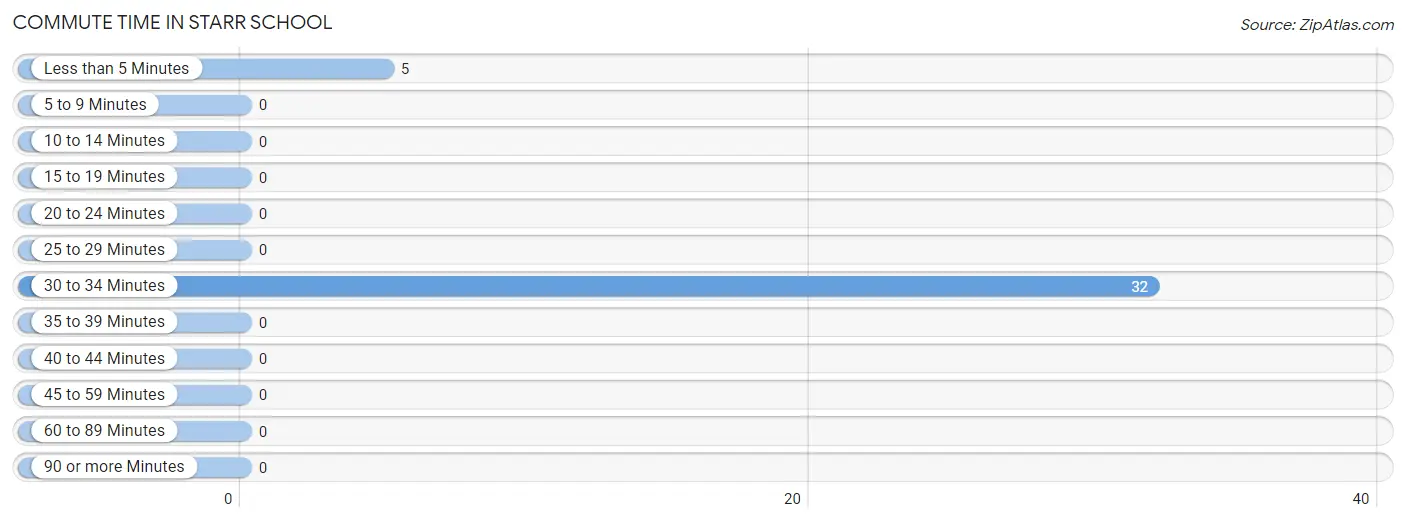
| Commute Time | # Commuters | % Commuters |
| Less than 5 Minutes | 5 | 13.5% |
| 5 to 9 Minutes | 0 | 0.0% |
| 10 to 14 Minutes | 0 | 0.0% |
| 15 to 19 Minutes | 0 | 0.0% |
| 20 to 24 Minutes | 0 | 0.0% |
| 25 to 29 Minutes | 0 | 0.0% |
| 30 to 34 Minutes | 32 | 86.5% |
| 35 to 39 Minutes | 0 | 0.0% |
| 40 to 44 Minutes | 0 | 0.0% |
| 45 to 59 Minutes | 0 | 0.0% |
| 60 to 89 Minutes | 0 | 0.0% |
| 90 or more Minutes | 0 | 0.0% |
Commute Time by Sex in Starr School
The most common commute times in Starr School are 30 to 34 minutes (12 commuters, 100.0%) for males and 30 to 34 minutes (20 commuters, 80.0%) for females.
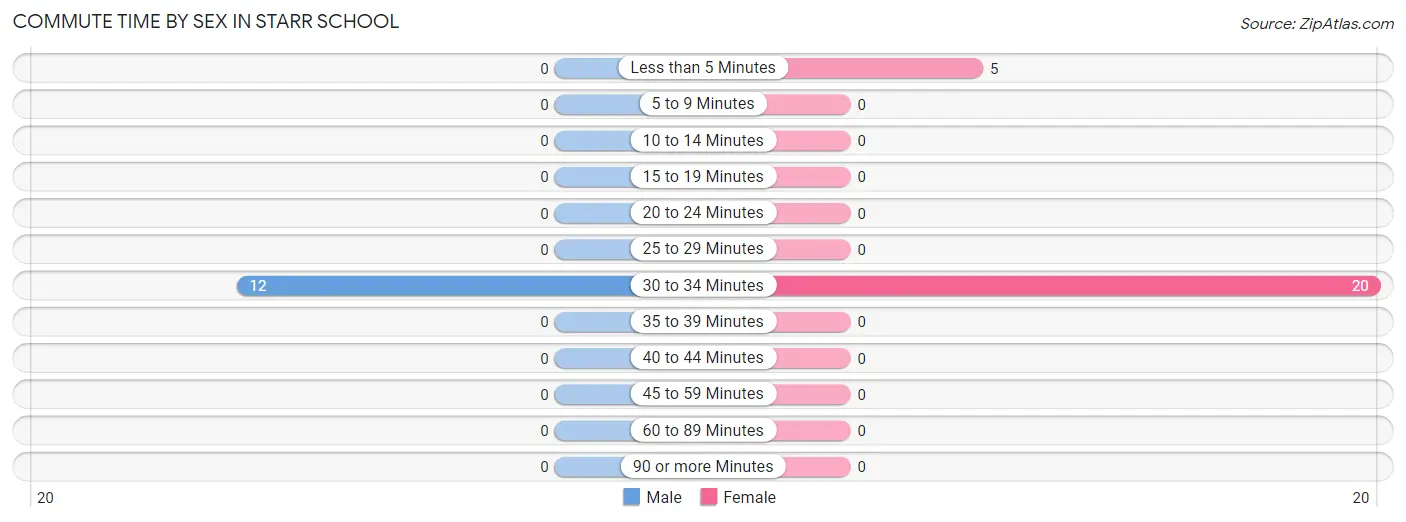
| Commute Time | Male | Female |
| Less than 5 Minutes | 0 (0.0%) | 5 (20.0%) |
| 5 to 9 Minutes | 0 (0.0%) | 0 (0.0%) |
| 10 to 14 Minutes | 0 (0.0%) | 0 (0.0%) |
| 15 to 19 Minutes | 0 (0.0%) | 0 (0.0%) |
| 20 to 24 Minutes | 0 (0.0%) | 0 (0.0%) |
| 25 to 29 Minutes | 0 (0.0%) | 0 (0.0%) |
| 30 to 34 Minutes | 12 (100.0%) | 20 (80.0%) |
| 35 to 39 Minutes | 0 (0.0%) | 0 (0.0%) |
| 40 to 44 Minutes | 0 (0.0%) | 0 (0.0%) |
| 45 to 59 Minutes | 0 (0.0%) | 0 (0.0%) |
| 60 to 89 Minutes | 0 (0.0%) | 0 (0.0%) |
| 90 or more Minutes | 0 (0.0%) | 0 (0.0%) |
Time of Departure to Work by Sex in Starr School
The most frequent times of departure to work in Starr School are 7:30 AM to 7:59 AM (12, 100.0%) for males and 7:30 AM to 7:59 AM (25, 100.0%) for females.
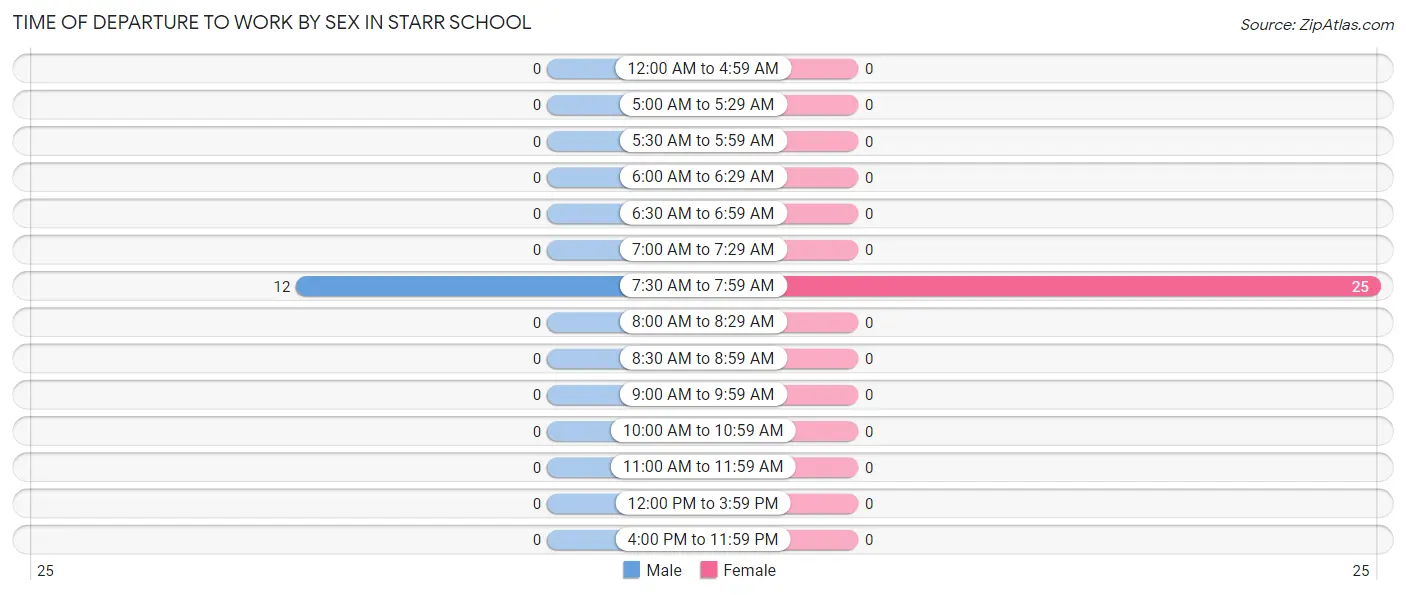
| Time of Departure | Male | Female |
| 12:00 AM to 4:59 AM | 0 (0.0%) | 0 (0.0%) |
| 5:00 AM to 5:29 AM | 0 (0.0%) | 0 (0.0%) |
| 5:30 AM to 5:59 AM | 0 (0.0%) | 0 (0.0%) |
| 6:00 AM to 6:29 AM | 0 (0.0%) | 0 (0.0%) |
| 6:30 AM to 6:59 AM | 0 (0.0%) | 0 (0.0%) |
| 7:00 AM to 7:29 AM | 0 (0.0%) | 0 (0.0%) |
| 7:30 AM to 7:59 AM | 12 (100.0%) | 25 (100.0%) |
| 8:00 AM to 8:29 AM | 0 (0.0%) | 0 (0.0%) |
| 8:30 AM to 8:59 AM | 0 (0.0%) | 0 (0.0%) |
| 9:00 AM to 9:59 AM | 0 (0.0%) | 0 (0.0%) |
| 10:00 AM to 10:59 AM | 0 (0.0%) | 0 (0.0%) |
| 11:00 AM to 11:59 AM | 0 (0.0%) | 0 (0.0%) |
| 12:00 PM to 3:59 PM | 0 (0.0%) | 0 (0.0%) |
| 4:00 PM to 11:59 PM | 0 (0.0%) | 0 (0.0%) |
| Total | 12 (100.0%) | 25 (100.0%) |
Housing Occupancy in Starr School
Occupancy by Ownership in Starr School
Of the total 59 dwellings in Starr School, owner-occupied units account for 59 (100.0%), while renter-occupied units make up 0 (0.0%).
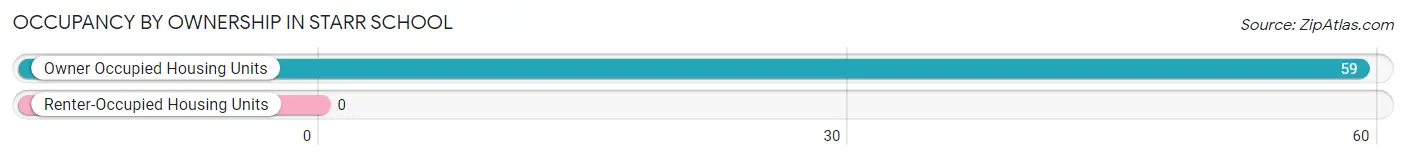
| Occupancy | # Housing Units | % Housing Units |
| Owner Occupied Housing Units | 59 | 100.0% |
| Renter-Occupied Housing Units | 0 | 0.0% |
| Total Occupied Housing Units | 59 | 100.0% |
Occupancy by Household Size in Starr School
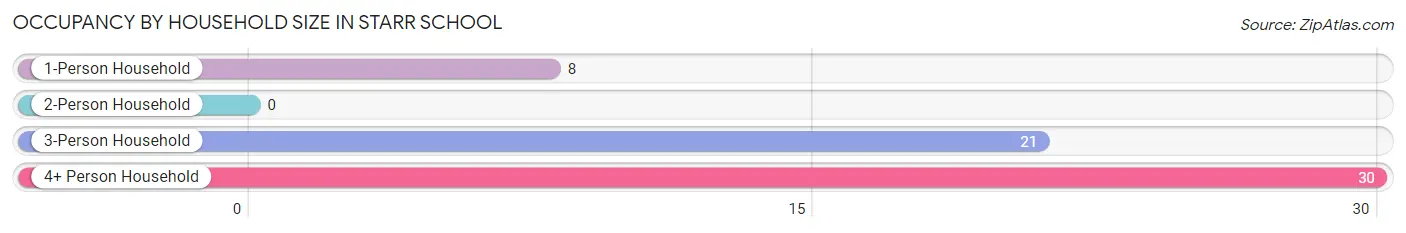
| Household Size | # Housing Units | % Housing Units |
| 1-Person Household | 8 | 13.6% |
| 2-Person Household | 0 | 0.0% |
| 3-Person Household | 21 | 35.6% |
| 4+ Person Household | 30 | 50.8% |
| Total Housing Units | 59 | 100.0% |
Occupancy by Ownership by Household Size in Starr School
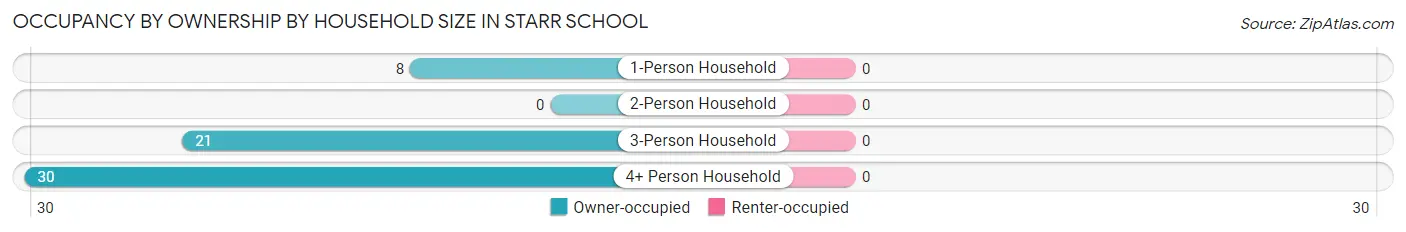
| Household Size | Owner-occupied | Renter-occupied |
| 1-Person Household | 8 (100.0%) | 0 (0.0%) |
| 2-Person Household | 0 (0.0%) | 0 (0.0%) |
| 3-Person Household | 21 (100.0%) | 0 (0.0%) |
| 4+ Person Household | 30 (100.0%) | 0 (0.0%) |
| Total Housing Units | 59 (100.0%) | 0 (0.0%) |
Occupancy by Educational Attainment in Starr School
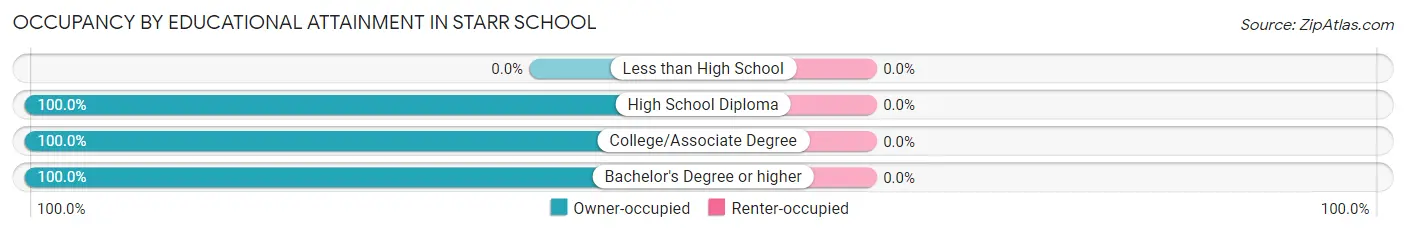
| Household Size | Owner-occupied | Renter-occupied |
| Less than High School | 0 (0.0%) | 0 (0.0%) |
| High School Diploma | 20 (100.0%) | 0 (0.0%) |
| College/Associate Degree | 5 (100.0%) | 0 (0.0%) |
| Bachelor's Degree or higher | 34 (100.0%) | 0 (0.0%) |
Occupancy by Age of Householder in Starr School
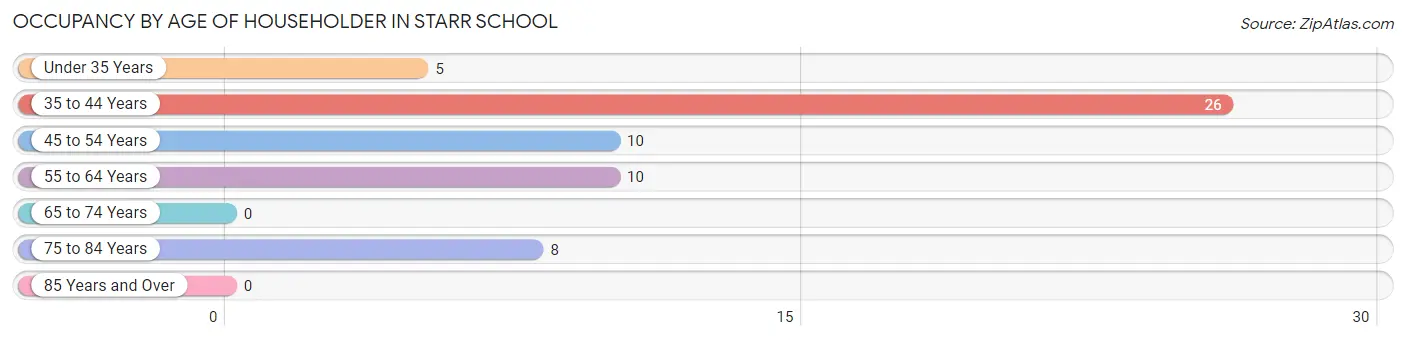
| Age Bracket | # Households | % Households |
| Under 35 Years | 5 | 8.5% |
| 35 to 44 Years | 26 | 44.1% |
| 45 to 54 Years | 10 | 17.0% |
| 55 to 64 Years | 10 | 17.0% |
| 65 to 74 Years | 0 | 0.0% |
| 75 to 84 Years | 8 | 13.6% |
| 85 Years and Over | 0 | 0.0% |
| Total | 59 | 100.0% |
Housing Finances in Starr School
Median Income by Occupancy in Starr School
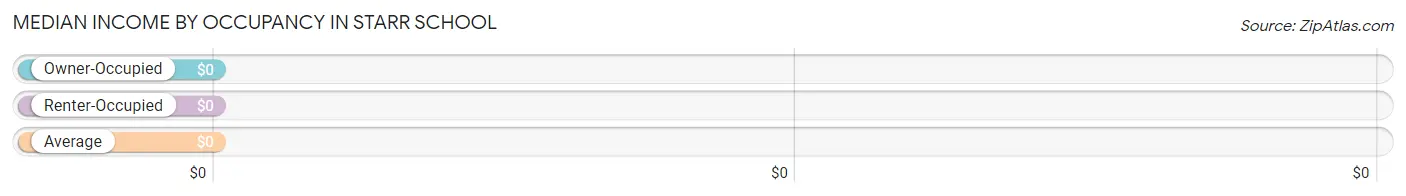
| Occupancy Type | # Households | Median Income |
| Owner-Occupied | 59 (100.0%) | $0 |
| Renter-Occupied | 0 (0.0%) | $0 |
| Average | 59 (100.0%) | $0 |
Occupancy by Householder Income Bracket in Starr School
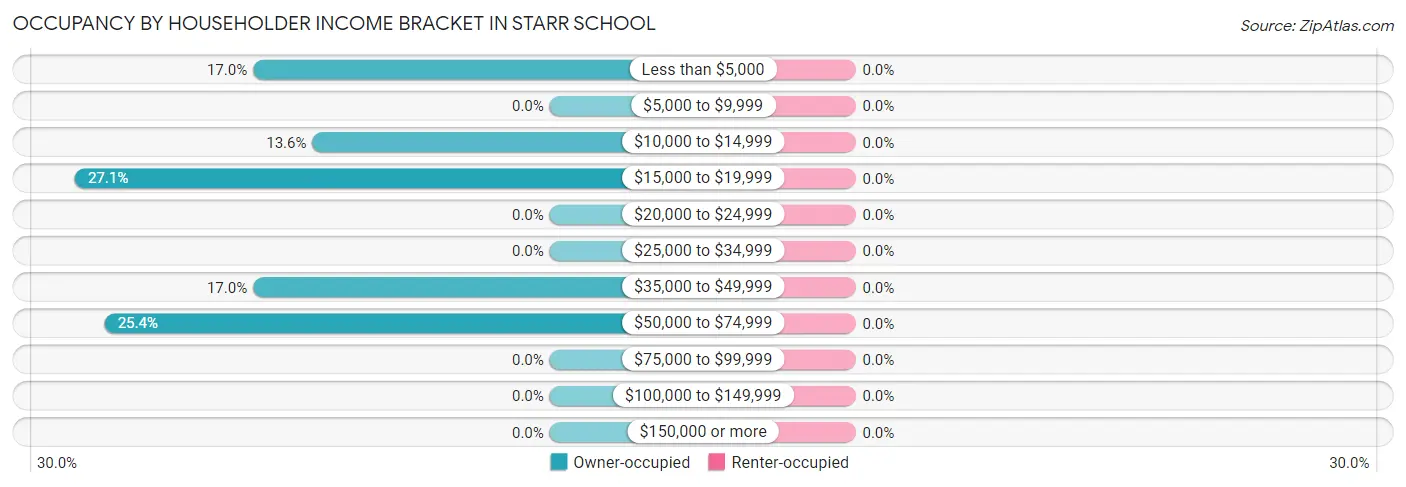
| Income Bracket | Owner-occupied | Renter-occupied |
| Less than $5,000 | 10 (17.0%) | 0 (0.0%) |
| $5,000 to $9,999 | 0 (0.0%) | 0 (0.0%) |
| $10,000 to $14,999 | 8 (13.6%) | 0 (0.0%) |
| $15,000 to $19,999 | 16 (27.1%) | 0 (0.0%) |
| $20,000 to $24,999 | 0 (0.0%) | 0 (0.0%) |
| $25,000 to $34,999 | 0 (0.0%) | 0 (0.0%) |
| $35,000 to $49,999 | 10 (17.0%) | 0 (0.0%) |
| $50,000 to $74,999 | 15 (25.4%) | 0 (0.0%) |
| $75,000 to $99,999 | 0 (0.0%) | 0 (0.0%) |
| $100,000 to $149,999 | 0 (0.0%) | 0 (0.0%) |
| $150,000 or more | 0 (0.0%) | 0 (0.0%) |
| Total | 59 (100.0%) | 0 (0.0%) |
Monthly Housing Cost Tiers in Starr School
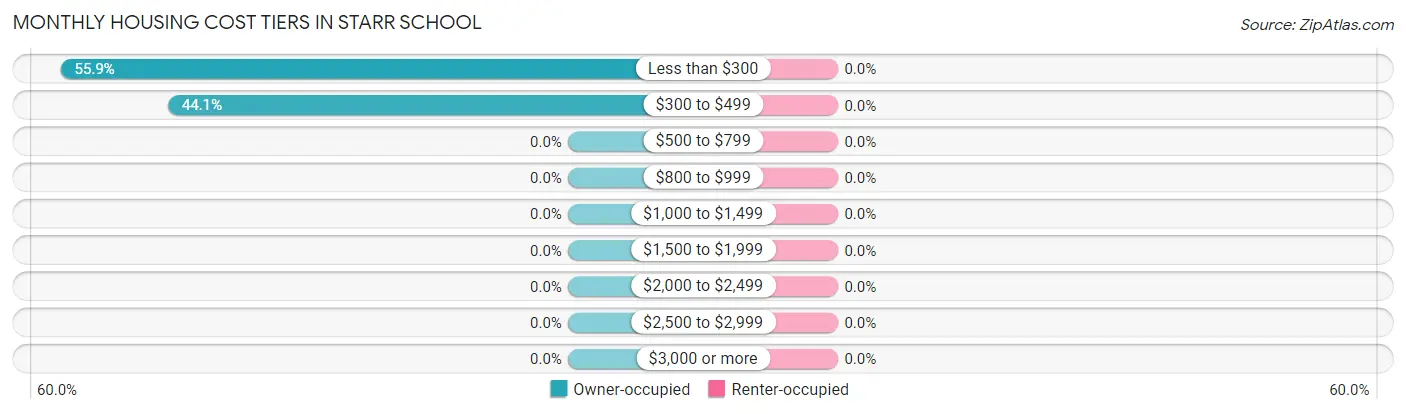
| Monthly Cost | Owner-occupied | Renter-occupied |
| Less than $300 | 33 (55.9%) | 0 (0.0%) |
| $300 to $499 | 26 (44.1%) | 0 (0.0%) |
| $500 to $799 | 0 (0.0%) | 0 (0.0%) |
| $800 to $999 | 0 (0.0%) | 0 (0.0%) |
| $1,000 to $1,499 | 0 (0.0%) | 0 (0.0%) |
| $1,500 to $1,999 | 0 (0.0%) | 0 (0.0%) |
| $2,000 to $2,499 | 0 (0.0%) | 0 (0.0%) |
| $2,500 to $2,999 | 0 (0.0%) | 0 (0.0%) |
| $3,000 or more | 0 (0.0%) | 0 (0.0%) |
| Total | 59 (100.0%) | 0 (0.0%) |
Physical Housing Characteristics in Starr School
Housing Structures in Starr School
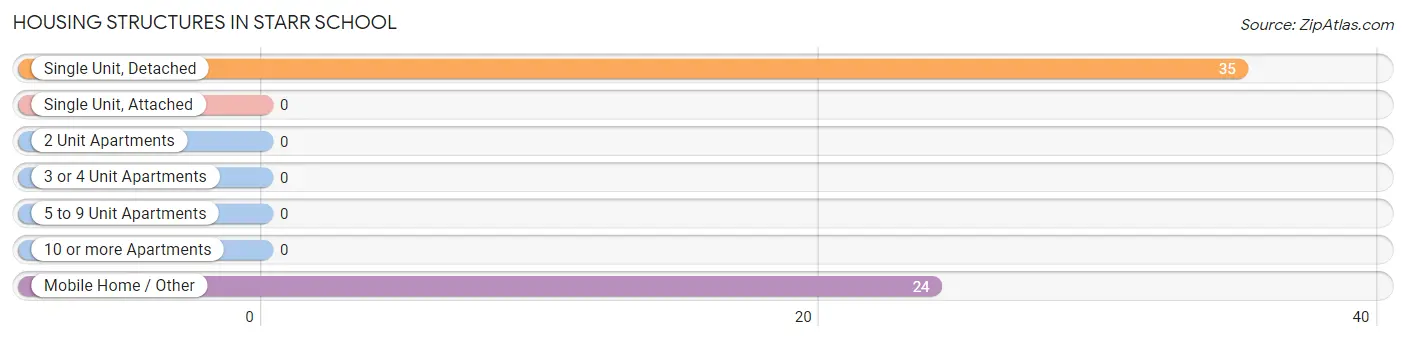
| Structure Type | # Housing Units | % Housing Units |
| Single Unit, Detached | 35 | 59.3% |
| Single Unit, Attached | 0 | 0.0% |
| 2 Unit Apartments | 0 | 0.0% |
| 3 or 4 Unit Apartments | 0 | 0.0% |
| 5 to 9 Unit Apartments | 0 | 0.0% |
| 10 or more Apartments | 0 | 0.0% |
| Mobile Home / Other | 24 | 40.7% |
| Total | 59 | 100.0% |
Housing Structures by Occupancy in Starr School
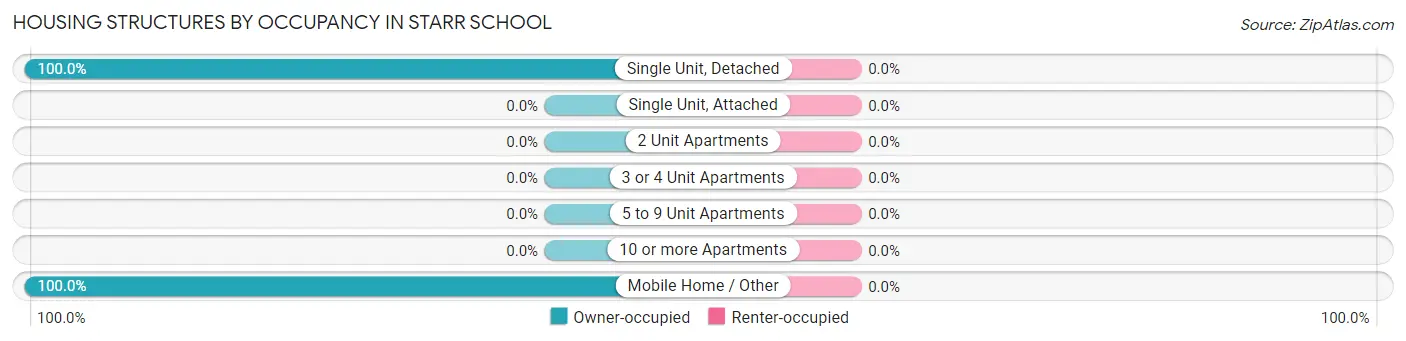
| Structure Type | Owner-occupied | Renter-occupied |
| Single Unit, Detached | 35 (100.0%) | 0 (0.0%) |
| Single Unit, Attached | 0 (0.0%) | 0 (0.0%) |
| 2 Unit Apartments | 0 (0.0%) | 0 (0.0%) |
| 3 or 4 Unit Apartments | 0 (0.0%) | 0 (0.0%) |
| 5 to 9 Unit Apartments | 0 (0.0%) | 0 (0.0%) |
| 10 or more Apartments | 0 (0.0%) | 0 (0.0%) |
| Mobile Home / Other | 24 (100.0%) | 0 (0.0%) |
| Total | 59 (100.0%) | 0 (0.0%) |
Housing Structures by Number of Rooms in Starr School
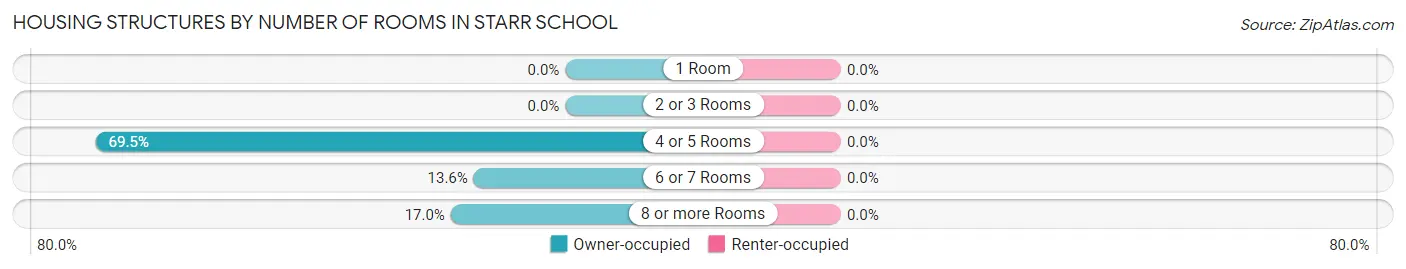
| Number of Rooms | Owner-occupied | Renter-occupied |
| 1 Room | 0 (0.0%) | 0 (0.0%) |
| 2 or 3 Rooms | 0 (0.0%) | 0 (0.0%) |
| 4 or 5 Rooms | 41 (69.5%) | 0 (0.0%) |
| 6 or 7 Rooms | 8 (13.6%) | 0 (0.0%) |
| 8 or more Rooms | 10 (17.0%) | 0 (0.0%) |
| Total | 59 (100.0%) | 0 (0.0%) |
Housing Structure by Heating Type in Starr School
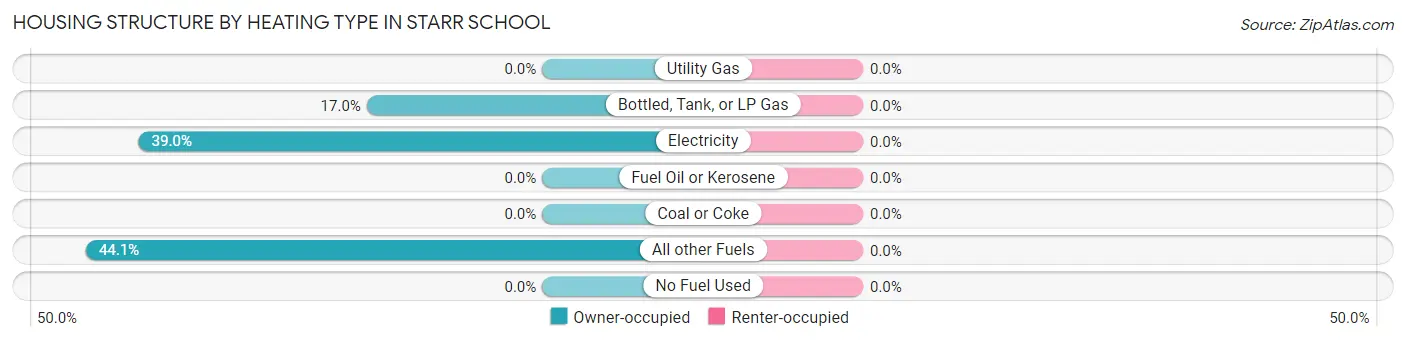
| Heating Type | Owner-occupied | Renter-occupied |
| Utility Gas | 0 (0.0%) | 0 (0.0%) |
| Bottled, Tank, or LP Gas | 10 (17.0%) | 0 (0.0%) |
| Electricity | 23 (39.0%) | 0 (0.0%) |
| Fuel Oil or Kerosene | 0 (0.0%) | 0 (0.0%) |
| Coal or Coke | 0 (0.0%) | 0 (0.0%) |
| All other Fuels | 26 (44.1%) | 0 (0.0%) |
| No Fuel Used | 0 (0.0%) | 0 (0.0%) |
| Total | 59 (100.0%) | 0 (0.0%) |
Household Vehicle Usage in Starr School
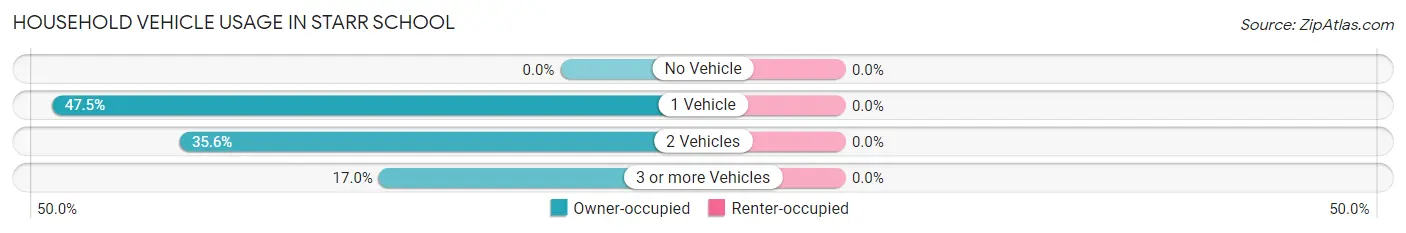
| Vehicles per Household | Owner-occupied | Renter-occupied |
| No Vehicle | 0 (0.0%) | 0 (0.0%) |
| 1 Vehicle | 28 (47.5%) | 0 (0.0%) |
| 2 Vehicles | 21 (35.6%) | 0 (0.0%) |
| 3 or more Vehicles | 10 (17.0%) | 0 (0.0%) |
| Total | 59 (100.0%) | 0 (0.0%) |
Real Estate & Mortgages in Starr School
Real Estate and Mortgage Overview in Starr School
| Characteristic | Without Mortgage | With Mortgage |
| Housing Units | 59 | 0 |
| Median Property Value | - | - |
| Median Household Income | - | - |
| Monthly Housing Costs | - | - |
| Real Estate Taxes | $199 | $0 |
Property Value by Mortgage Status in Starr School
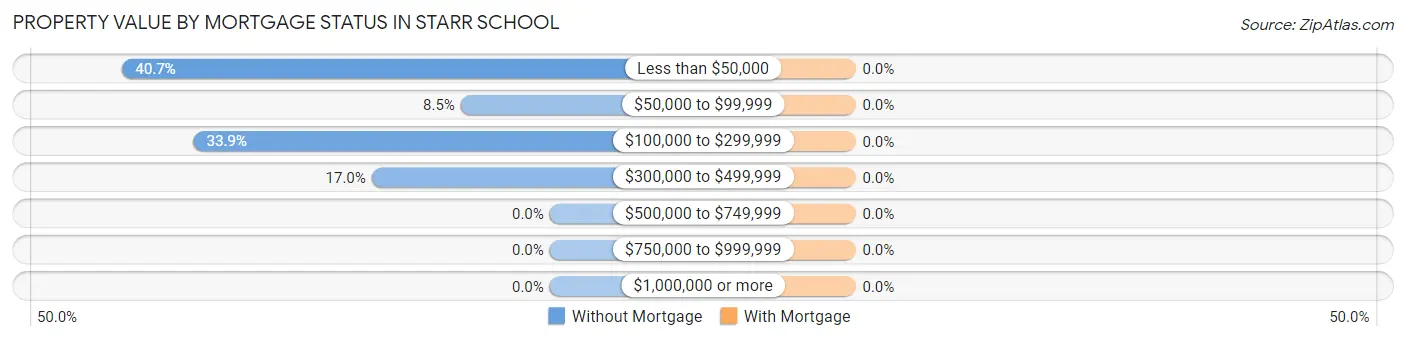
| Property Value | Without Mortgage | With Mortgage |
| Less than $50,000 | 24 (40.7%) | 0 (0.0%) |
| $50,000 to $99,999 | 5 (8.5%) | 0 (0.0%) |
| $100,000 to $299,999 | 20 (33.9%) | 0 (0.0%) |
| $300,000 to $499,999 | 10 (17.0%) | 0 (0.0%) |
| $500,000 to $749,999 | 0 (0.0%) | 0 (0.0%) |
| $750,000 to $999,999 | 0 (0.0%) | 0 (0.0%) |
| $1,000,000 or more | 0 (0.0%) | 0 (0.0%) |
| Total | 59 (100.0%) | 0 (0.0%) |
Household Income by Mortgage Status in Starr School
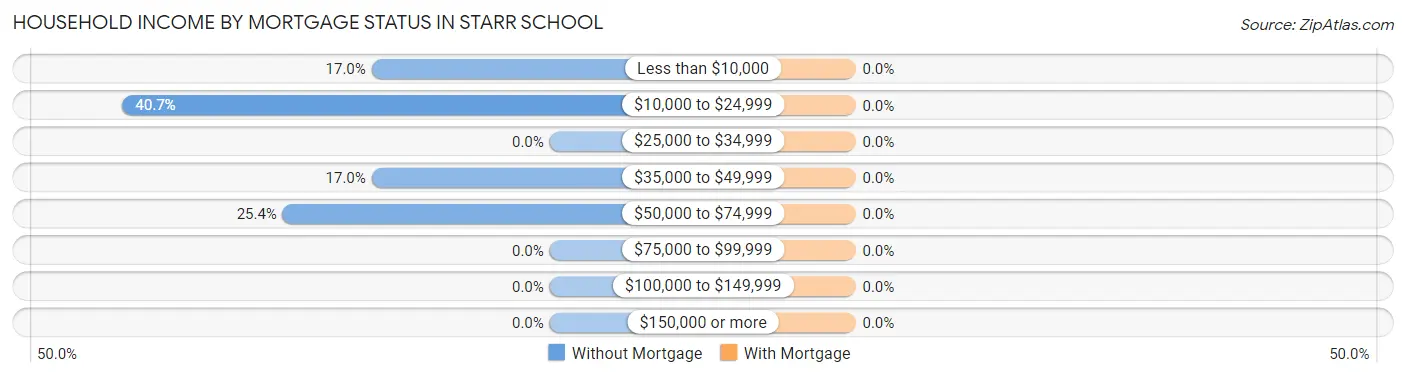
| Household Income | Without Mortgage | With Mortgage |
| Less than $10,000 | 10 (17.0%) | 0 (0.0%) |
| $10,000 to $24,999 | 24 (40.7%) | 0 (0.0%) |
| $25,000 to $34,999 | 0 (0.0%) | 0 (0.0%) |
| $35,000 to $49,999 | 10 (17.0%) | 0 (0.0%) |
| $50,000 to $74,999 | 15 (25.4%) | 0 (0.0%) |
| $75,000 to $99,999 | 0 (0.0%) | 0 (0.0%) |
| $100,000 to $149,999 | 0 (0.0%) | 0 (0.0%) |
| $150,000 or more | 0 (0.0%) | 0 (0.0%) |
| Total | 59 (100.0%) | 0 (0.0%) |
Property Value to Household Income Ratio in Starr School
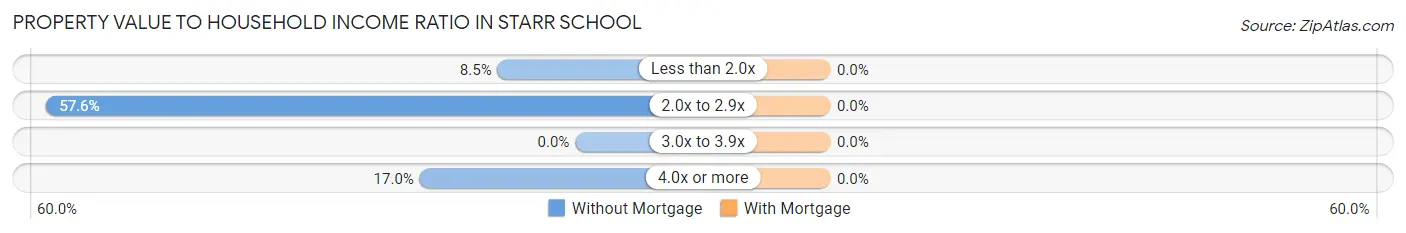
| Value-to-Income Ratio | Without Mortgage | With Mortgage |
| Less than 2.0x | 5 (8.5%) | 0 (0.0%) |
| 2.0x to 2.9x | 34 (57.6%) | 0 (0.0%) |
| 3.0x to 3.9x | 0 (0.0%) | 0 (0.0%) |
| 4.0x or more | 10 (17.0%) | 0 (0.0%) |
| Total | 59 (100.0%) | 0 (0.0%) |
Real Estate Taxes by Mortgage Status in Starr School
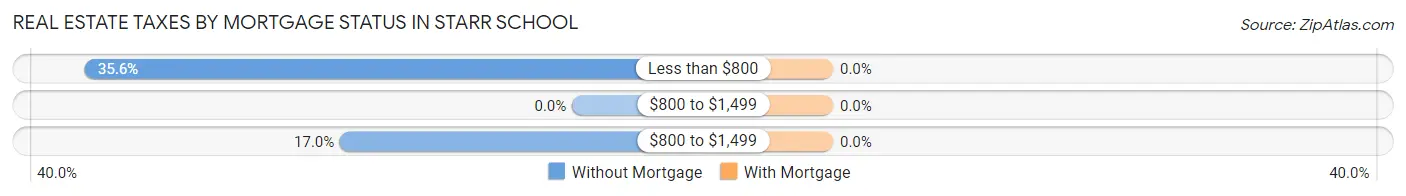
| Property Taxes | Without Mortgage | With Mortgage |
| Less than $800 | 21 (35.6%) | 0 (0.0%) |
| $800 to $1,499 | 0 (0.0%) | 0 (0.0%) |
| $800 to $1,499 | 10 (17.0%) | 0 (0.0%) |
| Total | 59 (100.0%) | 0 (0.0%) |
Health & Disability in Starr School
Health Insurance Coverage by Age in Starr School
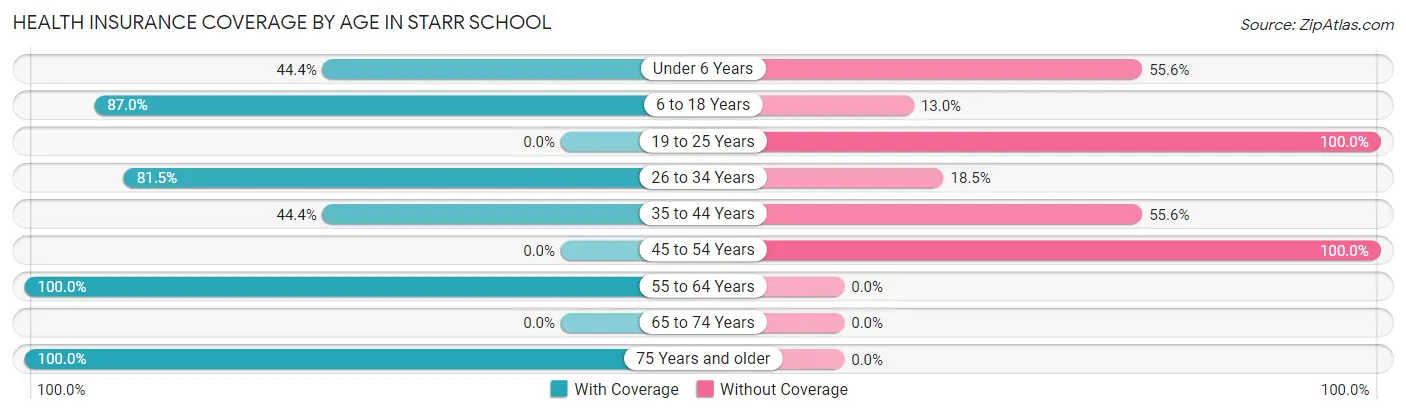
| Age Bracket | With Coverage | Without Coverage |
| Under 6 Years | 8 (44.4%) | 10 (55.6%) |
| 6 to 18 Years | 67 (87.0%) | 10 (13.0%) |
| 19 to 25 Years | 0 (0.0%) | 31 (100.0%) |
| 26 to 34 Years | 22 (81.5%) | 5 (18.5%) |
| 35 to 44 Years | 16 (44.4%) | 20 (55.6%) |
| 45 to 54 Years | 0 (0.0%) | 22 (100.0%) |
| 55 to 64 Years | 10 (100.0%) | 0 (0.0%) |
| 65 to 74 Years | 0 (0.0%) | 0 (0.0%) |
| 75 Years and older | 8 (100.0%) | 0 (0.0%) |
| Total | 131 (57.2%) | 98 (42.8%) |
Health Insurance Coverage by Citizenship Status in Starr School
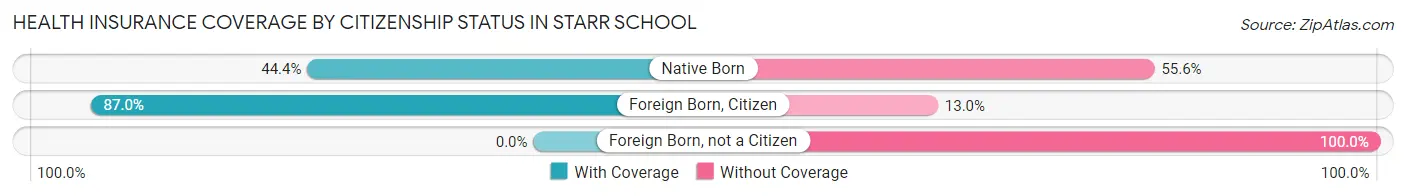
| Citizenship Status | With Coverage | Without Coverage |
| Native Born | 8 (44.4%) | 10 (55.6%) |
| Foreign Born, Citizen | 67 (87.0%) | 10 (13.0%) |
| Foreign Born, not a Citizen | 0 (0.0%) | 31 (100.0%) |
Health Insurance Coverage by Household Income in Starr School
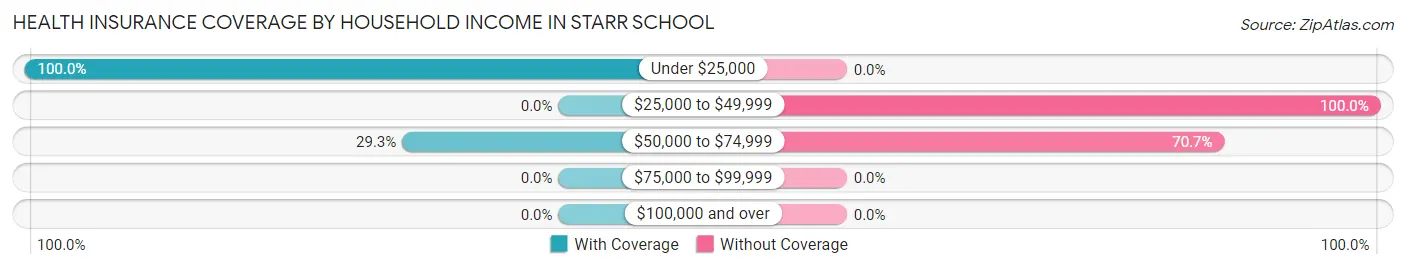
| Household Income | With Coverage | Without Coverage |
| Under $25,000 | 107 (100.0%) | 0 (0.0%) |
| $25,000 to $49,999 | 0 (0.0%) | 40 (100.0%) |
| $50,000 to $74,999 | 24 (29.3%) | 58 (70.7%) |
| $75,000 to $99,999 | 0 (0.0%) | 0 (0.0%) |
| $100,000 and over | 0 (0.0%) | 0 (0.0%) |
Public vs Private Health Insurance Coverage by Age in Starr School
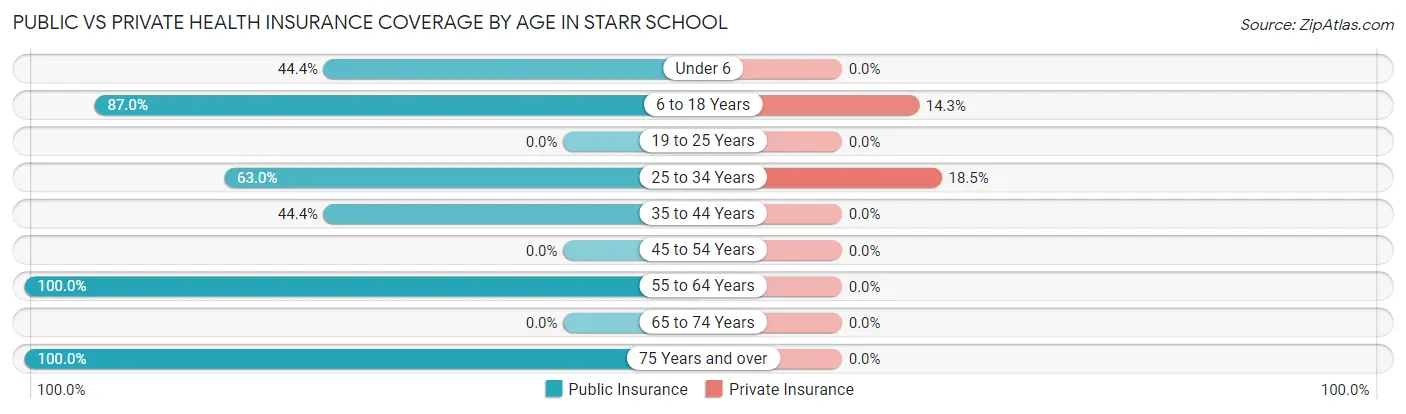
| Age Bracket | Public Insurance | Private Insurance |
| Under 6 | 8 (44.4%) | 0 (0.0%) |
| 6 to 18 Years | 67 (87.0%) | 11 (14.3%) |
| 19 to 25 Years | 0 (0.0%) | 0 (0.0%) |
| 25 to 34 Years | 17 (63.0%) | 5 (18.5%) |
| 35 to 44 Years | 16 (44.4%) | 0 (0.0%) |
| 45 to 54 Years | 0 (0.0%) | 0 (0.0%) |
| 55 to 64 Years | 10 (100.0%) | 0 (0.0%) |
| 65 to 74 Years | 0 (0.0%) | 0 (0.0%) |
| 75 Years and over | 8 (100.0%) | 0 (0.0%) |
| Total | 126 (55.0%) | 16 (7.0%) |
Disability Status by Sex by Age in Starr School
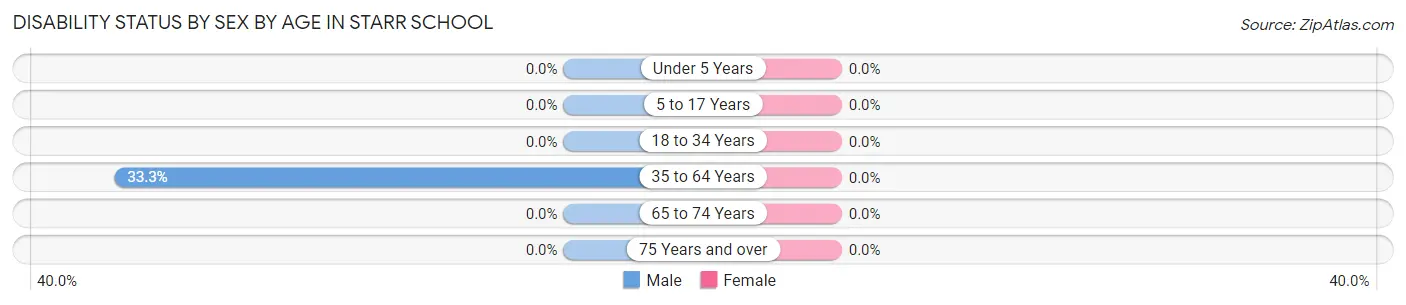
| Age Bracket | Male | Female |
| Under 5 Years | 0 (0.0%) | 0 (0.0%) |
| 5 to 17 Years | 0 (0.0%) | 0 (0.0%) |
| 18 to 34 Years | 0 (0.0%) | 0 (0.0%) |
| 35 to 64 Years | 16 (33.3%) | 0 (0.0%) |
| 65 to 74 Years | 0 (0.0%) | 0 (0.0%) |
| 75 Years and over | 0 (0.0%) | 0 (0.0%) |
Disability Class by Sex by Age in Starr School
Disability Class: Hearing Difficulty
| Age Bracket | Male | Female |
| Under 5 Years | 0 (0.0%) | 0 (0.0%) |
| 5 to 17 Years | 0 (0.0%) | 0 (0.0%) |
| 18 to 34 Years | 0 (0.0%) | 0 (0.0%) |
| 35 to 64 Years | 0 (0.0%) | 0 (0.0%) |
| 65 to 74 Years | 0 (0.0%) | 0 (0.0%) |
| 75 Years and over | 0 (0.0%) | 0 (0.0%) |
Disability Class: Vision Difficulty
| Age Bracket | Male | Female |
| Under 5 Years | 0 (0.0%) | 0 (0.0%) |
| 5 to 17 Years | 0 (0.0%) | 0 (0.0%) |
| 18 to 34 Years | 0 (0.0%) | 0 (0.0%) |
| 35 to 64 Years | 0 (0.0%) | 0 (0.0%) |
| 65 to 74 Years | 0 (0.0%) | 0 (0.0%) |
| 75 Years and over | 0 (0.0%) | 0 (0.0%) |
Disability Class: Cognitive Difficulty
| Age Bracket | Male | Female |
| 5 to 17 Years | 0 (0.0%) | 0 (0.0%) |
| 18 to 34 Years | 0 (0.0%) | 0 (0.0%) |
| 35 to 64 Years | 0 (0.0%) | 0 (0.0%) |
| 65 to 74 Years | 0 (0.0%) | 0 (0.0%) |
| 75 Years and over | 0 (0.0%) | 0 (0.0%) |
Disability Class: Ambulatory Difficulty
| Age Bracket | Male | Female |
| 5 to 17 Years | 0 (0.0%) | 0 (0.0%) |
| 18 to 34 Years | 0 (0.0%) | 0 (0.0%) |
| 35 to 64 Years | 16 (33.3%) | 0 (0.0%) |
| 65 to 74 Years | 0 (0.0%) | 0 (0.0%) |
| 75 Years and over | 0 (0.0%) | 0 (0.0%) |
Disability Class: Self-Care Difficulty
| Age Bracket | Male | Female |
| 5 to 17 Years | 0 (0.0%) | 0 (0.0%) |
| 18 to 34 Years | 0 (0.0%) | 0 (0.0%) |
| 35 to 64 Years | 0 (0.0%) | 0 (0.0%) |
| 65 to 74 Years | 0 (0.0%) | 0 (0.0%) |
| 75 Years and over | 0 (0.0%) | 0 (0.0%) |
Technology Access in Starr School
Computing Device Access in Starr School
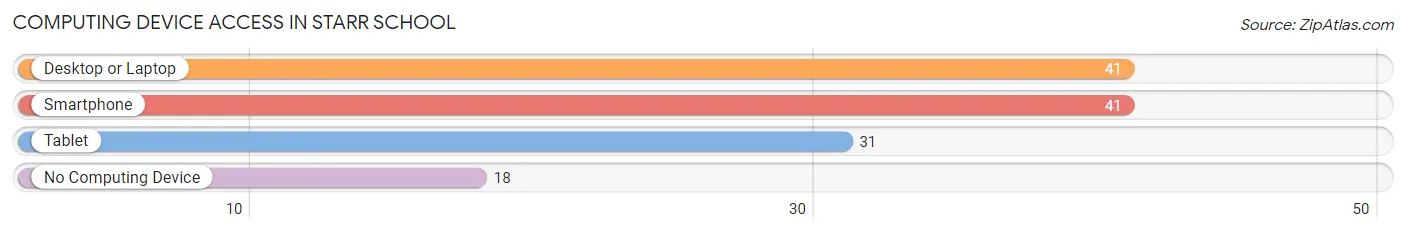
| Device Type | # Households | % Households |
| Desktop or Laptop | 41 | 69.5% |
| Smartphone | 41 | 69.5% |
| Tablet | 31 | 52.5% |
| No Computing Device | 18 | 30.5% |
| Total | 59 | 100.0% |
Internet Access in Starr School
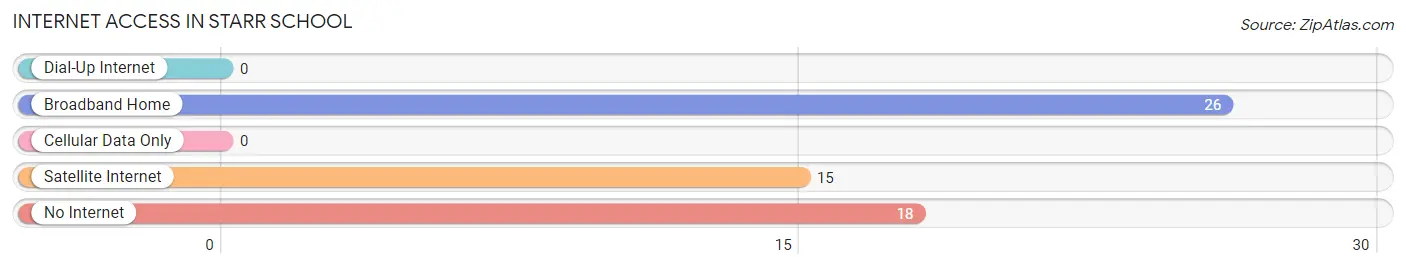
| Internet Type | # Households | % Households |
| Dial-Up Internet | 0 | 0.0% |
| Broadband Home | 26 | 44.1% |
| Cellular Data Only | 0 | 0.0% |
| Satellite Internet | 15 | 25.4% |
| No Internet | 18 | 30.5% |
| Total | 59 | 100.0% |
Starr School Summary
Starr School is a small, rural community located in the western part of Montana, near the Idaho border. It is situated in the Bitterroot Valley, a region known for its beautiful scenery and outdoor recreation opportunities. The town is home to approximately 500 people, most of whom are employed in the local timber industry.
History
Starr School was founded in 1883 by a group of settlers from the Midwest. The town was named after the Starr family, who were among the first settlers in the area. The town was originally a small farming community, but it soon grew to include a sawmill, a general store, and a post office.
In the early 1900s, the timber industry began to take off in the area, and Starr School became a hub for the industry. The town was home to several sawmills, and the local economy was heavily reliant on the timber industry.
Geography
Starr School is located in the western part of Montana, near the Idaho border. It is situated in the Bitterroot Valley, a region known for its beautiful scenery and outdoor recreation opportunities. The town is surrounded by mountains, forests, and rivers, making it a popular destination for outdoor enthusiasts.
The town is located at an elevation of 4,000 feet, and the climate is generally mild and dry. Summers are warm and sunny, while winters are cold and snowy.
Economy
The economy of Starr School is heavily reliant on the timber industry. The town is home to several sawmills, and the local economy is heavily reliant on the timber industry. The town is also home to a few small businesses, such as a general store and a post office.
Demographics
As of the 2010 census, the population of Starr School was 498. The town is predominantly white, with a small minority population. The median household income is $37,000, and the median age is 44.
Conclusion
Starr School is a small, rural community located in the western part of Montana, near the Idaho border. It is situated in the Bitterroot Valley, a region known for its beautiful scenery and outdoor recreation opportunities. The town is home to approximately 500 people, most of whom are employed in the local timber industry. The economy of Starr School is heavily reliant on the timber industry, and the town is also home to a few small businesses. The population of Starr School is predominantly white, with a small minority population.
Common Questions
What is Per Capita Income in Starr School?
Per Capita income in Starr School is $7,946.
What is Inequality or Gini Index in Starr School?
Inequality or Gini Index in Starr School is 0.42.
What is the Total Population of Starr School?
Total Population of Starr School is 229.
What is the Total Male Population of Starr School?
Total Male Population of Starr School is 95.
What is the Total Female Population of Starr School?
Total Female Population of Starr School is 134.
What is the Ratio of Males per 100 Females in Starr School?
There are 70.90 Males per 100 Females in Starr School.
What is the Ratio of Females per 100 Males in Starr School?
There are 141.05 Females per 100 Males in Starr School.
What is the Median Population Age in Starr School?
Median Population Age in Starr School is 22.6 Years.
What is the Average Family Size in Starr School
Average Family Size in Starr School is 4.0 People.
What is the Average Household Size in Starr School
Average Household Size in Starr School is 3.9 People.
How Large is the Labor Force in Starr School?
There are 42 People in the Labor Forcein in Starr School.
What is the Percentage of People in the Labor Force in Starr School?
31.3% of People are in the Labor Force in Starr School.