Ravalli, MT Map & Demographics
Ravalli Map
Ravalli Overview
$42,786
PER CAPITA INCOME
$74,013
AVG HOUSEHOLD INCOME
0.23
INEQUALITY / GINI INDEX
173
TOTAL POPULATION
132
MALE POPULATION
41
FEMALE POPULATION
321.95
MALES / 100 FEMALES
31.06
FEMALES / 100 MALES
37.6
MEDIAN AGE
2.8
AVG FAMILY SIZE
1.9
AVG HOUSEHOLD SIZE
138
LABOR FORCE [ PEOPLE ]
79.8%
PERCENT IN LABOR FORCE
7.2%
UNEMPLOYMENT RATE
Ravalli Zip Codes
Ravalli Area Codes
Income in Ravalli
Income Overview in Ravalli
| Characteristic | Number | Measure |
| Per Capita Income | 173 | $42,786 |
| Median Family Income | 15 | $0 |
| Mean Family Income | 15 | $0 |
| Median Household Income | 89 | $74,013 |
| Mean Household Income | 89 | $82,457 |
| Income Deficit | 15 | $0 |
| Wage / Income Gap (%) | 173 | 0.00% |
| Wage / Income Gap ($) | 173 | 100.00¢ per $1 |
| Gini / Inequality Index | 173 | 0.23 |
Earnings by Sex in Ravalli
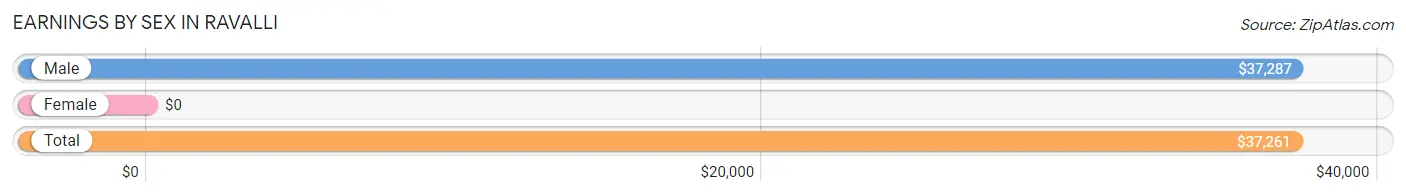
| Sex | Number | Average Earnings |
| Male | 122 (87.8%) | $37,287 |
| Female | 17 (12.2%) | $0 |
| Total | 139 (100.0%) | $37,261 |
Earnings by Sex by Income Bracket in Ravalli
The most common earnings brackets in Ravalli are $35,000 to $39,999 for men (104 | 85.3%) and $2,500 to $4,999 for women (9 | 52.9%).

| Income | Male | Female |
| $2,499 or less | 0 (0.0%) | 0 (0.0%) |
| $2,500 to $4,999 | 0 (0.0%) | 9 (52.9%) |
| $5,000 to $7,499 | 0 (0.0%) | 0 (0.0%) |
| $7,500 to $9,999 | 0 (0.0%) | 0 (0.0%) |
| $10,000 to $12,499 | 0 (0.0%) | 0 (0.0%) |
| $12,500 to $14,999 | 0 (0.0%) | 0 (0.0%) |
| $15,000 to $17,499 | 0 (0.0%) | 0 (0.0%) |
| $17,500 to $19,999 | 0 (0.0%) | 0 (0.0%) |
| $20,000 to $22,499 | 7 (5.7%) | 0 (0.0%) |
| $22,500 to $24,999 | 0 (0.0%) | 0 (0.0%) |
| $25,000 to $29,999 | 11 (9.0%) | 0 (0.0%) |
| $30,000 to $34,999 | 0 (0.0%) | 0 (0.0%) |
| $35,000 to $39,999 | 104 (85.3%) | 0 (0.0%) |
| $40,000 to $44,999 | 0 (0.0%) | 0 (0.0%) |
| $45,000 to $49,999 | 0 (0.0%) | 0 (0.0%) |
| $50,000 to $54,999 | 0 (0.0%) | 0 (0.0%) |
| $55,000 to $64,999 | 0 (0.0%) | 0 (0.0%) |
| $65,000 to $74,999 | 0 (0.0%) | 0 (0.0%) |
| $75,000 to $99,999 | 0 (0.0%) | 8 (47.1%) |
| $100,000+ | 0 (0.0%) | 0 (0.0%) |
| Total | 122 (100.0%) | 17 (100.0%) |
Earnings by Sex by Educational Attainment in Ravalli
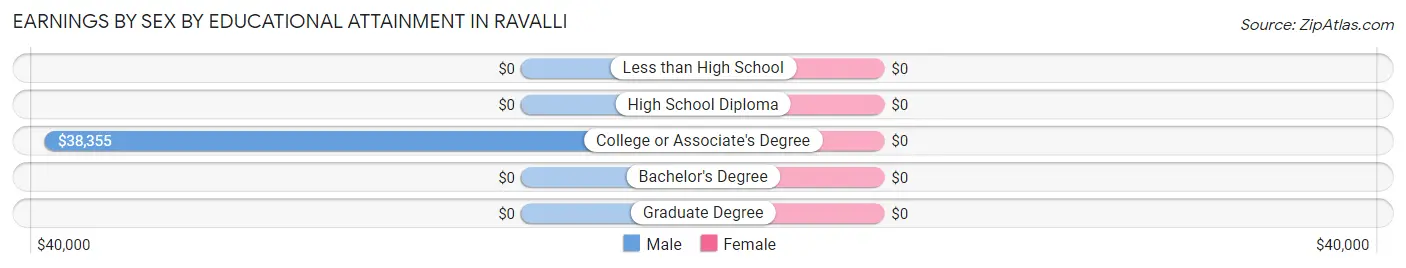
| Educational Attainment | Male Income | Female Income |
| Less than High School | - | - |
| High School Diploma | - | - |
| College or Associate's Degree | $38,355 | $0 |
| Bachelor's Degree | - | - |
| Graduate Degree | - | - |
| Total | $37,287 | $0 |
Family Income in Ravalli
Family Income Brackets in Ravalli
According to the Ravalli family income data, there are 15 families falling into the $100,000 to $149,999 income range, which is the most common income bracket and makes up 100.0% of all families.
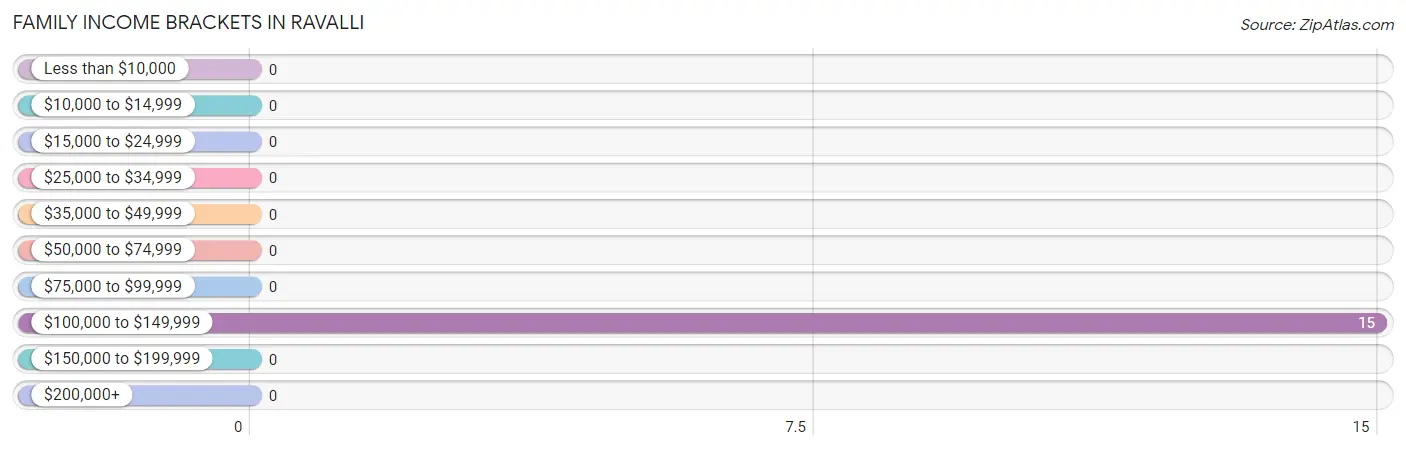
| Income Bracket | # Families | % Families |
| Less than $10,000 | 0 | 0.0% |
| $10,000 to $14,999 | 0 | 0.0% |
| $15,000 to $24,999 | 0 | 0.0% |
| $25,000 to $34,999 | 0 | 0.0% |
| $35,000 to $49,999 | 0 | 0.0% |
| $50,000 to $74,999 | 0 | 0.0% |
| $75,000 to $99,999 | 0 | 0.0% |
| $100,000 to $149,999 | 15 | 100.0% |
| $150,000 to $199,999 | 0 | 0.0% |
| $200,000+ | 0 | 0.0% |
Family Income by Famaliy Size in Ravalli
| Income Bracket | # Families | Median Income |
| 2-Person Families | 8 (53.3%) | $0 |
| 3-Person Families | 7 (46.7%) | $0 |
| 4-Person Families | 0 (0.0%) | $0 |
| 5-Person Families | 0 (0.0%) | $0 |
| 6-Person Families | 0 (0.0%) | $0 |
| 7+ Person Families | 0 (0.0%) | $0 |
| Total | 15 (100.0%) | $0 |
Family Income by Number of Earners in Ravalli
| Number of Earners | # Families | Median Income |
| No Earners | 0 (0.0%) | $0 |
| 1 Earner | 0 (0.0%) | $0 |
| 2 Earners | 15 (100.0%) | $0 |
| 3+ Earners | 0 (0.0%) | $0 |
| Total | 15 (100.0%) | $0 |
Household Income in Ravalli
Household Income Brackets in Ravalli
With 57 households falling in the category, the $50,000 to $74,999 income range is the most frequent in Ravalli, accounting for 64.0% of all households.
| Income Bracket | # Households | % Households |
| Less than $10,000 | 0 | 0.0% |
| $10,000 to $14,999 | 0 | 0.0% |
| $15,000 to $24,999 | 10 | 11.2% |
| $25,000 to $34,999 | 0 | 0.0% |
| $35,000 to $49,999 | 0 | 0.0% |
| $50,000 to $74,999 | 57 | 64.0% |
| $75,000 to $99,999 | 7 | 7.9% |
| $100,000 to $149,999 | 8 | 9.0% |
| $150,000 to $199,999 | 0 | 0.0% |
| $200,000+ | 7 | 7.9% |
Household Income by Householder Age in Ravalli
| Income Bracket | # Households | Median Income |
| 15 to 24 Years | 0 (0.0%) | $0 |
| 25 to 44 Years | 57 (64.0%) | $0 |
| 45 to 64 Years | 18 (20.2%) | $0 |
| 65+ Years | 14 (15.7%) | $0 |
| Total | 89 (100.0%) | $74,013 |
Poverty in Ravalli
Income Below Poverty by Sex and Age in Ravalli
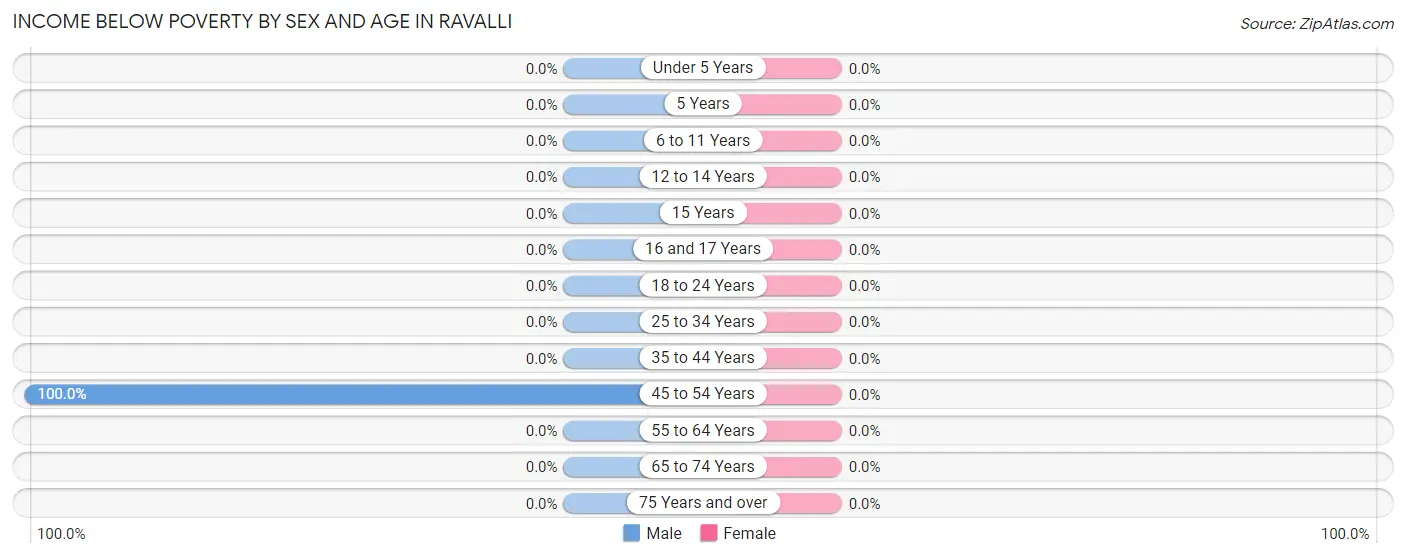
| Age Bracket | Male | Female |
| Under 5 Years | 0 (0.0%) | 0 (0.0%) |
| 5 Years | 0 (0.0%) | 0 (0.0%) |
| 6 to 11 Years | 0 (0.0%) | 0 (0.0%) |
| 12 to 14 Years | 0 (0.0%) | 0 (0.0%) |
| 15 Years | 0 (0.0%) | 0 (0.0%) |
| 16 and 17 Years | 0 (0.0%) | 0 (0.0%) |
| 18 to 24 Years | 0 (0.0%) | 0 (0.0%) |
| 25 to 34 Years | 0 (0.0%) | 0 (0.0%) |
| 35 to 44 Years | 0 (0.0%) | 0 (0.0%) |
| 45 to 54 Years | 10 (100.0%) | 0 (0.0%) |
| 55 to 64 Years | 0 (0.0%) | 0 (0.0%) |
| 65 to 74 Years | 0 (0.0%) | 0 (0.0%) |
| 75 Years and over | 0 (0.0%) | 0 (0.0%) |
| Total | 10 (7.6%) | 0 (0.0%) |
Income Above Poverty by Sex and Age in Ravalli
According to the poverty statistics in Ravalli, males aged 25 to 34 years and females aged 55 to 64 years are the age groups that are most secure financially, with 100.0% of males and 100.0% of females in these age groups living above the poverty line.
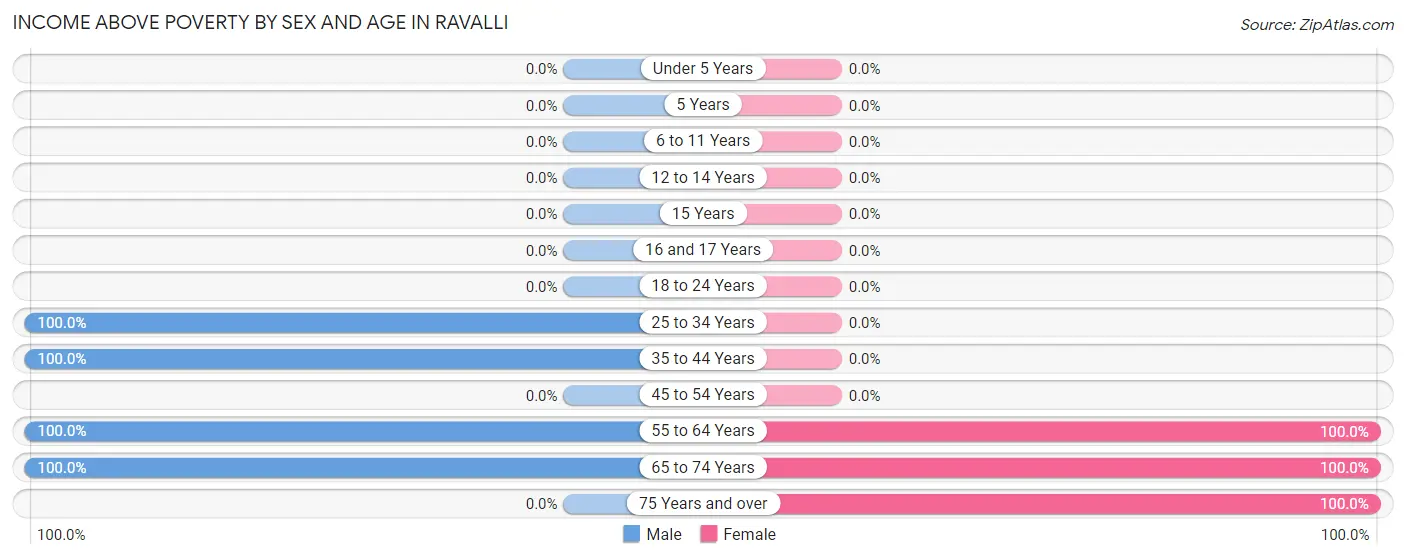
| Age Bracket | Male | Female |
| Under 5 Years | 0 (0.0%) | 0 (0.0%) |
| 5 Years | 0 (0.0%) | 0 (0.0%) |
| 6 to 11 Years | 0 (0.0%) | 0 (0.0%) |
| 12 to 14 Years | 0 (0.0%) | 0 (0.0%) |
| 15 Years | 0 (0.0%) | 0 (0.0%) |
| 16 and 17 Years | 0 (0.0%) | 0 (0.0%) |
| 18 to 24 Years | 0 (0.0%) | 0 (0.0%) |
| 25 to 34 Years | 57 (100.0%) | 0 (0.0%) |
| 35 to 44 Years | 47 (100.0%) | 0 (0.0%) |
| 45 to 54 Years | 0 (0.0%) | 0 (0.0%) |
| 55 to 64 Years | 11 (100.0%) | 8 (100.0%) |
| 65 to 74 Years | 7 (100.0%) | 26 (100.0%) |
| 75 Years and over | 0 (0.0%) | 7 (100.0%) |
| Total | 122 (92.4%) | 41 (100.0%) |
Income Below Poverty Among Married-Couple Families in Ravalli
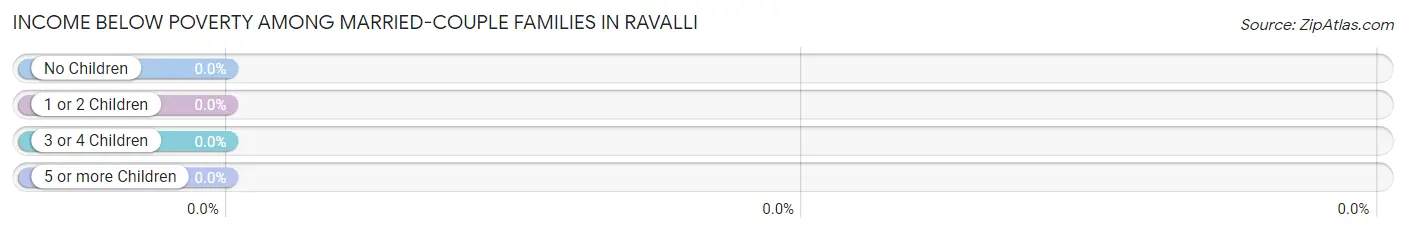
| Children | Above Poverty | Below Poverty |
| No Children | 15 (100.0%) | 0 (0.0%) |
| 1 or 2 Children | 0 (0.0%) | 0 (0.0%) |
| 3 or 4 Children | 0 (0.0%) | 0 (0.0%) |
| 5 or more Children | 0 (0.0%) | 0 (0.0%) |
| Total | 15 (100.0%) | 0 (0.0%) |
Income Below Poverty Among Single-Parent Households in Ravalli
| Children | Single Father | Single Mother |
| No Children | 0 (0.0%) | 0 (0.0%) |
| 1 or 2 Children | 0 (0.0%) | 0 (0.0%) |
| 3 or 4 Children | 0 (0.0%) | 0 (0.0%) |
| 5 or more Children | 0 (0.0%) | 0 (0.0%) |
| Total | 0 (0.0%) | 0 (0.0%) |
Income Below Poverty Among Married-Couple vs Single-Parent Households in Ravalli
| Children | Married-Couple Families | Single-Parent Households |
| No Children | 0 (0.0%) | 0 (0.0%) |
| 1 or 2 Children | 0 (0.0%) | 0 (0.0%) |
| 3 or 4 Children | 0 (0.0%) | 0 (0.0%) |
| 5 or more Children | 0 (0.0%) | 0 (0.0%) |
| Total | 0 (0.0%) | 0 (0.0%) |
Race in Ravalli
The most populous races in Ravalli are White / Caucasian (152 | 87.9%), Native / Alaskan (11 | 6.4%), and Two or more Races (10 | 5.8%).
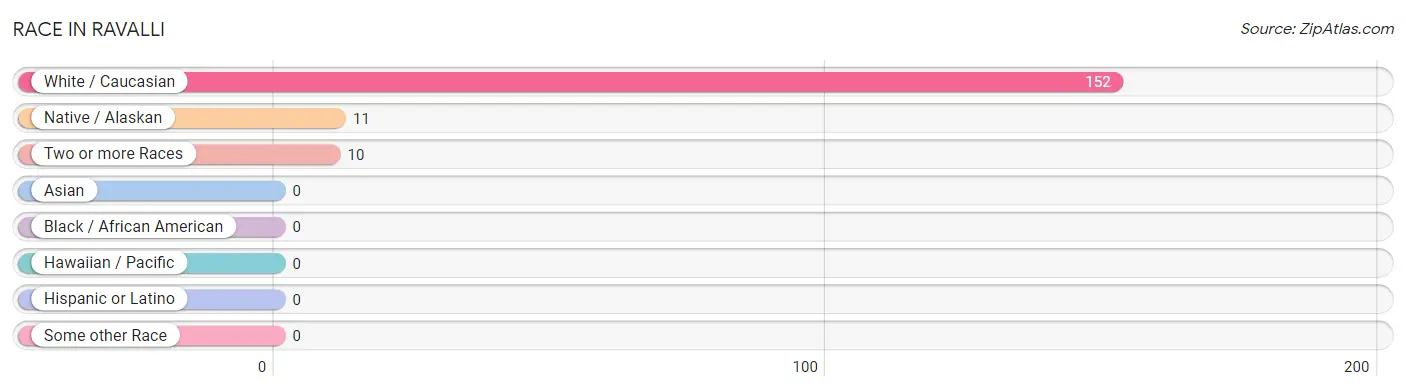
| Race | # Population | % Population |
| Asian | 0 | 0.0% |
| Black / African American | 0 | 0.0% |
| Hawaiian / Pacific | 0 | 0.0% |
| Hispanic or Latino | 0 | 0.0% |
| Native / Alaskan | 11 | 6.4% |
| White / Caucasian | 152 | 87.9% |
| Two or more Races | 10 | 5.8% |
| Some other Race | 0 | 0.0% |
| Total | 173 | 100.0% |
Ancestry in Ravalli
The most populous ancestries reported in Ravalli are German (17 | 9.8%), Norwegian (16 | 9.2%), British (10 | 5.8%), Italian (10 | 5.8%), and English (7 | 4.1%), together accounting for 34.7% of all Ravalli residents.
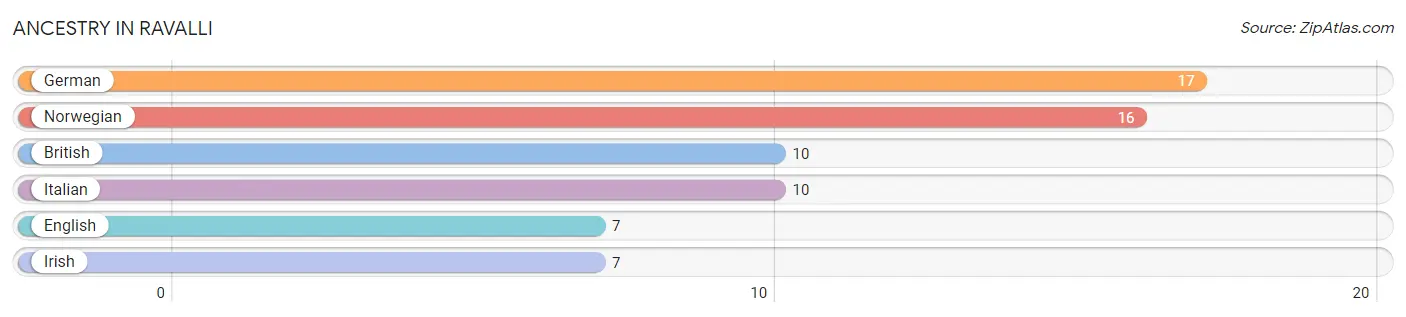
| Ancestry | # Population | % Population |
| British | 10 | 5.8% |
| English | 7 | 4.1% |
| German | 17 | 9.8% |
| Irish | 7 | 4.1% |
| Italian | 10 | 5.8% |
| Norwegian | 16 | 9.2% | View All 6 Rows |
Immigrants in Ravalli

| Immigration Origin | # Population | % Population | View All 0 Rows |
Sex and Age in Ravalli
Sex and Age in Ravalli
The most populous age groups in Ravalli are 25 to 29 Years (57 | 43.2%) for men and 65 to 69 Years (16 | 39.0%) for women.
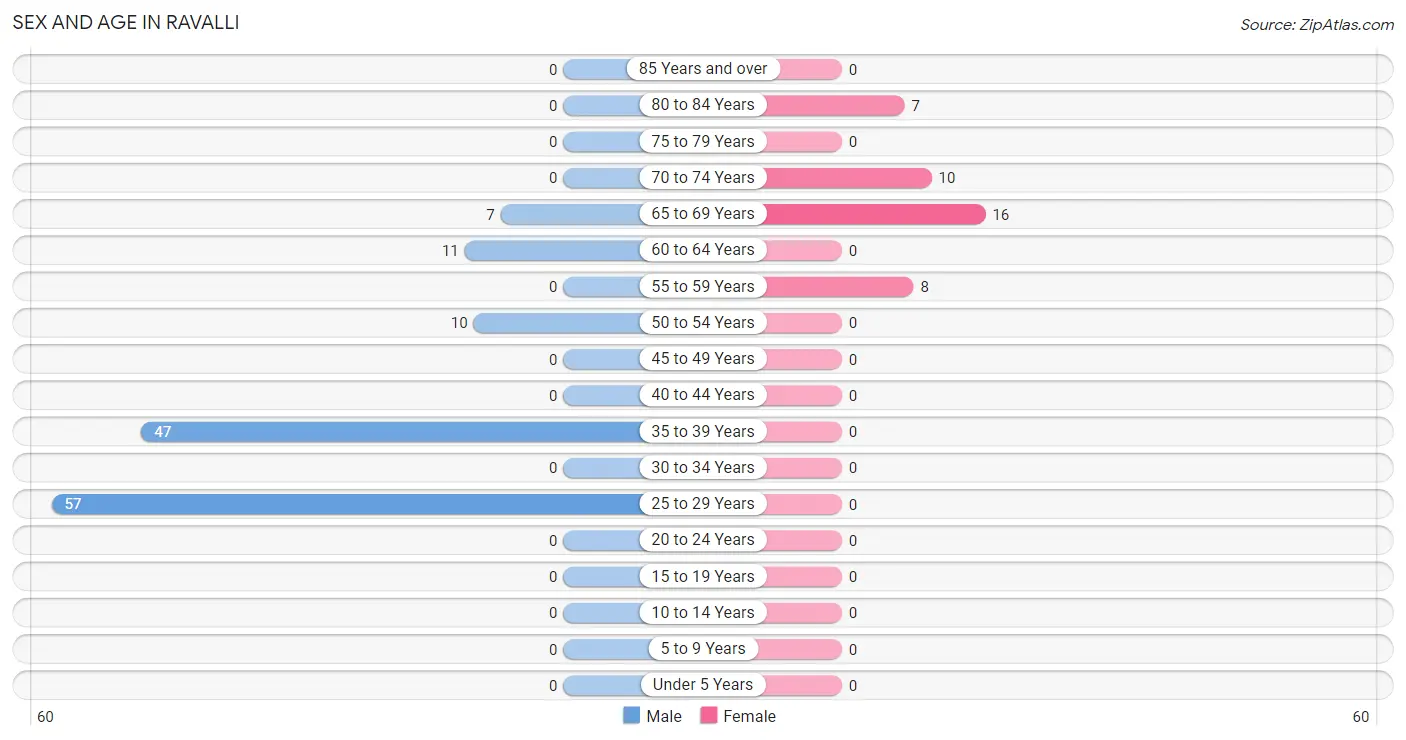
| Age Bracket | Male | Female |
| Under 5 Years | 0 (0.0%) | 0 (0.0%) |
| 5 to 9 Years | 0 (0.0%) | 0 (0.0%) |
| 10 to 14 Years | 0 (0.0%) | 0 (0.0%) |
| 15 to 19 Years | 0 (0.0%) | 0 (0.0%) |
| 20 to 24 Years | 0 (0.0%) | 0 (0.0%) |
| 25 to 29 Years | 57 (43.2%) | 0 (0.0%) |
| 30 to 34 Years | 0 (0.0%) | 0 (0.0%) |
| 35 to 39 Years | 47 (35.6%) | 0 (0.0%) |
| 40 to 44 Years | 0 (0.0%) | 0 (0.0%) |
| 45 to 49 Years | 0 (0.0%) | 0 (0.0%) |
| 50 to 54 Years | 10 (7.6%) | 0 (0.0%) |
| 55 to 59 Years | 0 (0.0%) | 8 (19.5%) |
| 60 to 64 Years | 11 (8.3%) | 0 (0.0%) |
| 65 to 69 Years | 7 (5.3%) | 16 (39.0%) |
| 70 to 74 Years | 0 (0.0%) | 10 (24.4%) |
| 75 to 79 Years | 0 (0.0%) | 0 (0.0%) |
| 80 to 84 Years | 0 (0.0%) | 7 (17.1%) |
| 85 Years and over | 0 (0.0%) | 0 (0.0%) |
| Total | 132 (100.0%) | 41 (100.0%) |
Families and Households in Ravalli
Median Family Size in Ravalli
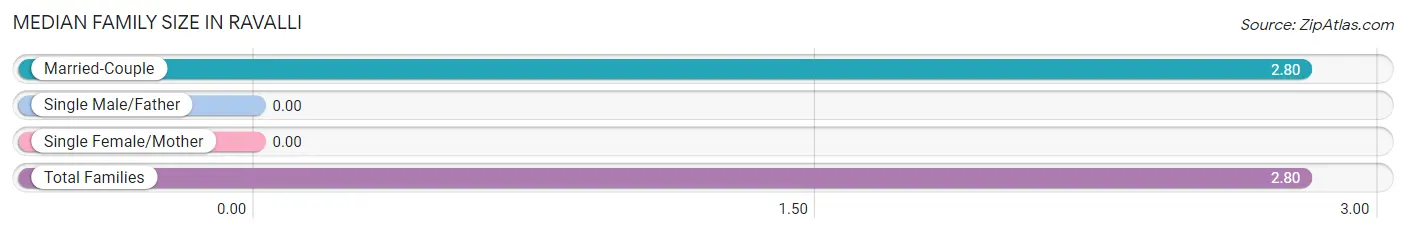
| Family Type | # Families | Family Size |
| Married-Couple | 15 (100.0%) | 2.80 |
| Single Male/Father | 0 (0.0%) | - |
| Single Female/Mother | 0 (0.0%) | - |
| Total Families | 15 (100.0%) | 2.80 |
Median Household Size in Ravalli
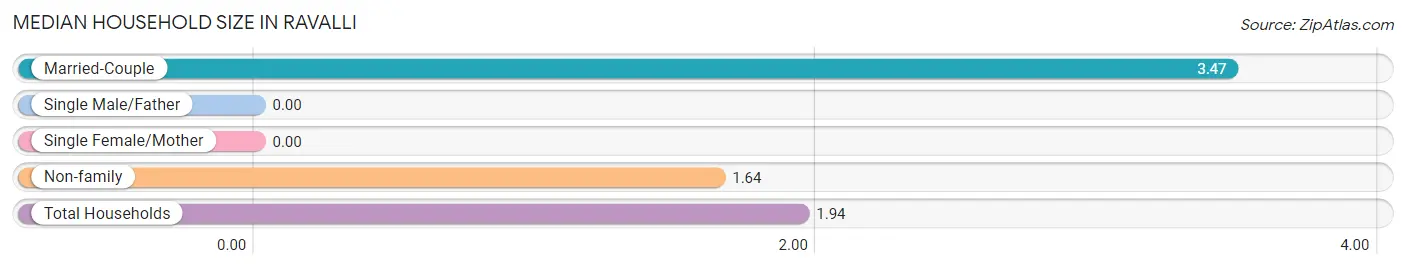
| Household Type | # Households | Household Size |
| Married-Couple | 15 (16.9%) | 3.47 |
| Single Male/Father | 0 (0.0%) | - |
| Single Female/Mother | 0 (0.0%) | - |
| Non-family | 74 (83.2%) | 1.64 |
| Total Households | 89 (100.0%) | 1.94 |
Household Size by Marriage Status in Ravalli
Out of a total of 89 households in Ravalli, 15 (16.9%) are family households, while 74 (83.2%) are nonfamily households. The most numerous type of family households are 2-person households, comprising 8, and the most common type of nonfamily households are 2-person households, comprising 57.
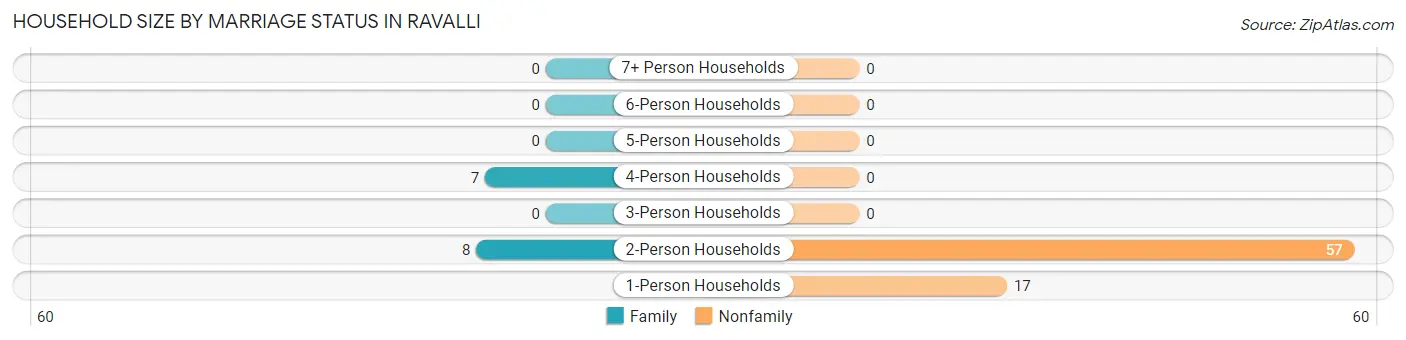
| Household Size | Family Households | Nonfamily Households |
| 1-Person Households | - | 17 (19.1%) |
| 2-Person Households | 8 (9.0%) | 57 (64.0%) |
| 3-Person Households | 0 (0.0%) | 0 (0.0%) |
| 4-Person Households | 7 (7.9%) | 0 (0.0%) |
| 5-Person Households | 0 (0.0%) | 0 (0.0%) |
| 6-Person Households | 0 (0.0%) | 0 (0.0%) |
| 7+ Person Households | 0 (0.0%) | 0 (0.0%) |
| Total | 15 (16.9%) | 74 (83.2%) |
Female Fertility in Ravalli
Fertility by Age in Ravalli
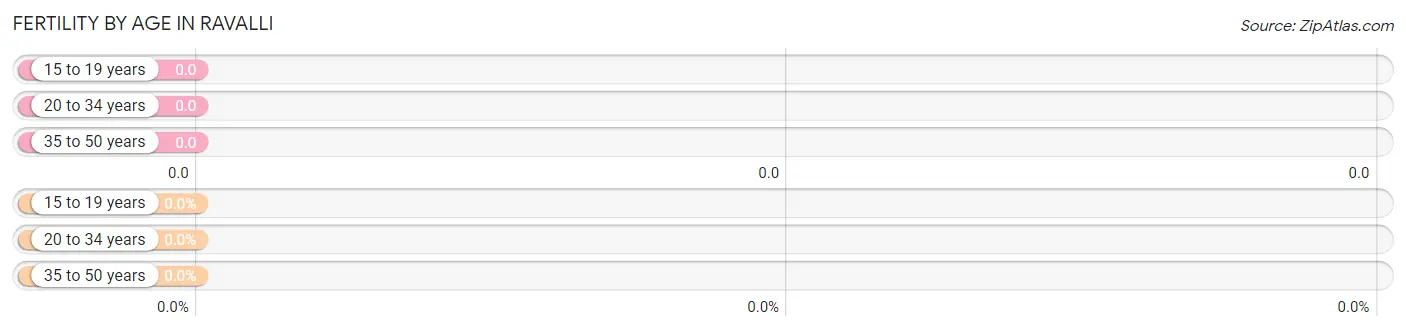
| Age Bracket | Women with Births | Births / 1,000 Women |
| 15 to 19 years | 0 (0.0%) | 0.0 |
| 20 to 34 years | 0 (0.0%) | 0.0 |
| 35 to 50 years | 0 (0.0%) | 0.0 |
| Total | 0 (0.0%) | 0.0 |
Fertility by Age by Marriage Status in Ravalli
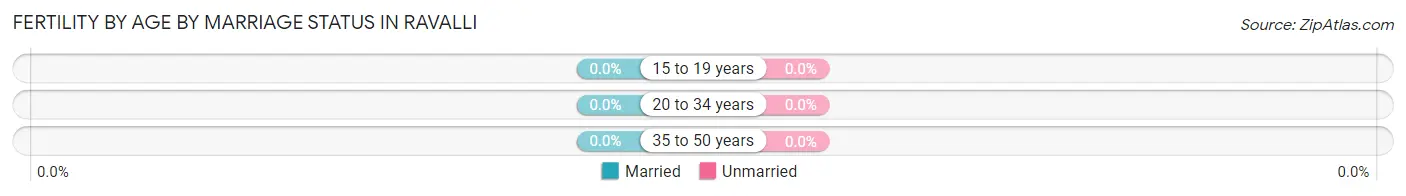
| Age Bracket | Married | Unmarried |
| 15 to 19 years | 0 (0.0%) | 0 (0.0%) |
| 20 to 34 years | 0 (0.0%) | 0 (0.0%) |
| 35 to 50 years | 0 (0.0%) | 0 (0.0%) |
| Total | 0 (0.0%) | 0 (0.0%) |
Fertility by Education in Ravalli
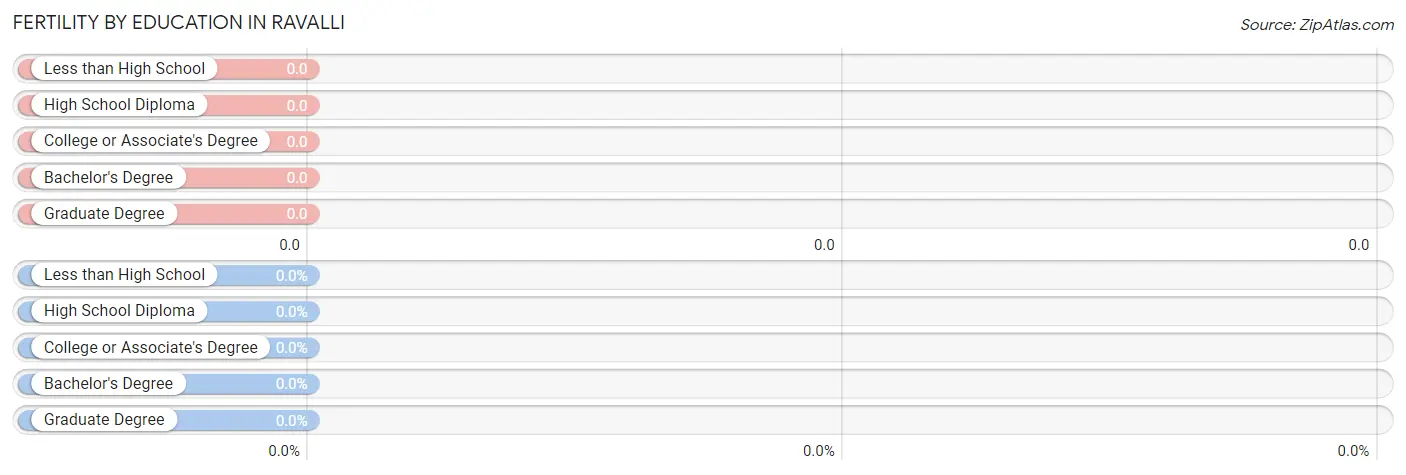
| Educational Attainment | Women with Births | Births / 1,000 Women |
| Less than High School | 0 (0.0%) | 0.0 |
| High School Diploma | 0 (0.0%) | 0.0 |
| College or Associate's Degree | 0 (0.0%) | 0.0 |
| Bachelor's Degree | 0 (0.0%) | 0.0 |
| Graduate Degree | 0 (0.0%) | 0.0 |
| Total | 0 (0.0%) | 0.0 |
Fertility by Education by Marriage Status in Ravalli
| Educational Attainment | Married | Unmarried |
| Less than High School | 0 (0.0%) | 0 (0.0%) |
| High School Diploma | 0 (0.0%) | 0 (0.0%) |
| College or Associate's Degree | 0 (0.0%) | 0 (0.0%) |
| Bachelor's Degree | 0 (0.0%) | 0 (0.0%) |
| Graduate Degree | 0 (0.0%) | 0 (0.0%) |
| Total | 0 (0.0%) | 0 (0.0%) |
Employment Characteristics in Ravalli
Employment by Class of Employer in Ravalli
Among the 81 employed individuals in Ravalli, private company employees (73 | 90.1%), and state government employees (8 | 9.9%) make up the most common classes of employment.
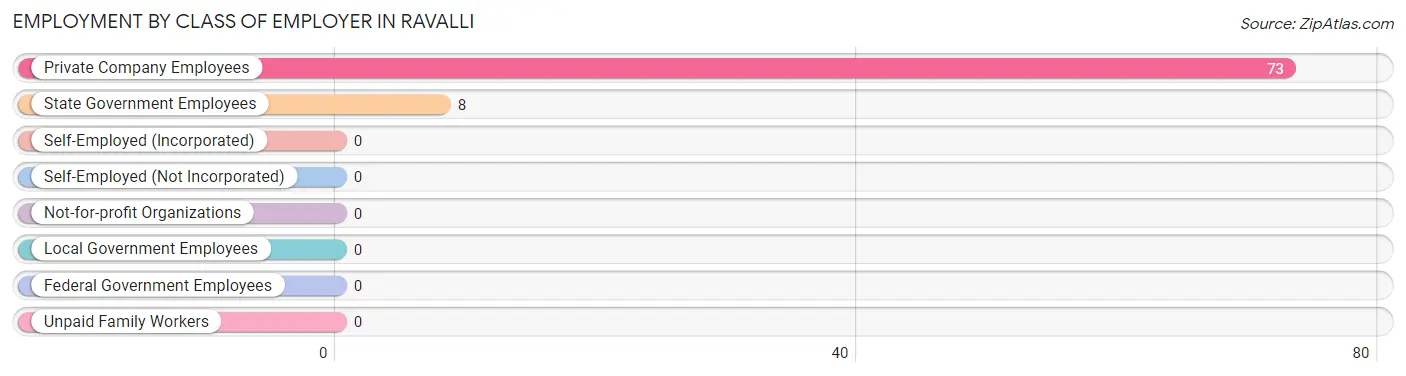
| Employer Class | # Employees | % Employees |
| Private Company Employees | 73 | 90.1% |
| Self-Employed (Incorporated) | 0 | 0.0% |
| Self-Employed (Not Incorporated) | 0 | 0.0% |
| Not-for-profit Organizations | 0 | 0.0% |
| Local Government Employees | 0 | 0.0% |
| State Government Employees | 8 | 9.9% |
| Federal Government Employees | 0 | 0.0% |
| Unpaid Family Workers | 0 | 0.0% |
| Total | 81 | 100.0% |
Employment Status by Age in Ravalli
According to the labor force statistics for Ravalli, out of the total population over 16 years of age (173), 79.8% or 138 individuals are in the labor force, with 7.2% or 10 of them unemployed. The age group with the highest labor force participation rate is 25 to 29 years, with 100.0% or 57 individuals in the labor force. Within the labor force, the 45 to 54 years age range has the highest percentage of unemployed individuals, with 100.0% or 10 of them being unemployed.
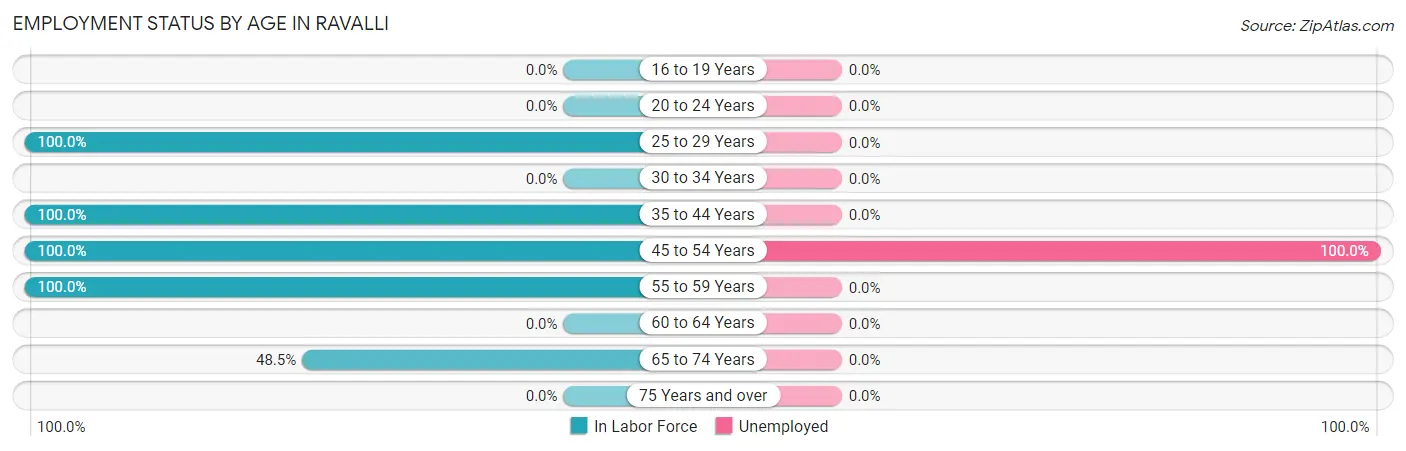
| Age Bracket | In Labor Force | Unemployed |
| 16 to 19 Years | 0 (0.0%) | 0 (0.0%) |
| 20 to 24 Years | 0 (0.0%) | 0 (0.0%) |
| 25 to 29 Years | 57 (100.0%) | 0 (0.0%) |
| 30 to 34 Years | 0 (0.0%) | 0 (0.0%) |
| 35 to 44 Years | 47 (100.0%) | 0 (0.0%) |
| 45 to 54 Years | 10 (100.0%) | 10 (100.0%) |
| 55 to 59 Years | 8 (100.0%) | 0 (0.0%) |
| 60 to 64 Years | 0 (0.0%) | 0 (0.0%) |
| 65 to 74 Years | 16 (48.5%) | 0 (0.0%) |
| 75 Years and over | 0 (0.0%) | 0 (0.0%) |
| Total | 138 (79.8%) | 10 (7.2%) |
Employment Status by Educational Attainment in Ravalli
According to labor force statistics for Ravalli, 91.7% of individuals (122) out of the total population between 25 and 64 years of age (133) are in the labor force, with 8.2% or 10 of them being unemployed. The group with the highest labor force participation rate are those with the educational attainment of high school diploma, with 100.0% or 47 individuals in the labor force. Within the labor force, individuals with college / associate degree education have the highest percentage of unemployment, with 14.9% or 10 of them being unemployed.
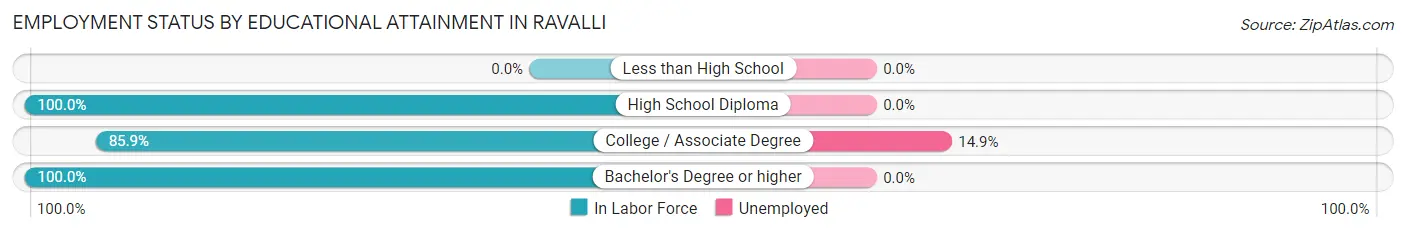
| Educational Attainment | In Labor Force | Unemployed |
| Less than High School | 0 (0.0%) | 0 (0.0%) |
| High School Diploma | 47 (100.0%) | 0 (0.0%) |
| College / Associate Degree | 67 (85.9%) | 12 (14.9%) |
| Bachelor's Degree or higher | 8 (100.0%) | 0 (0.0%) |
| Total | 122 (91.7%) | 11 (8.2%) |
Employment Occupations by Sex in Ravalli
Management, Business, Science and Arts Occupations
The most common Management, Business, Science and Arts occupations in Ravalli are , and Management (17 | 13.3%).
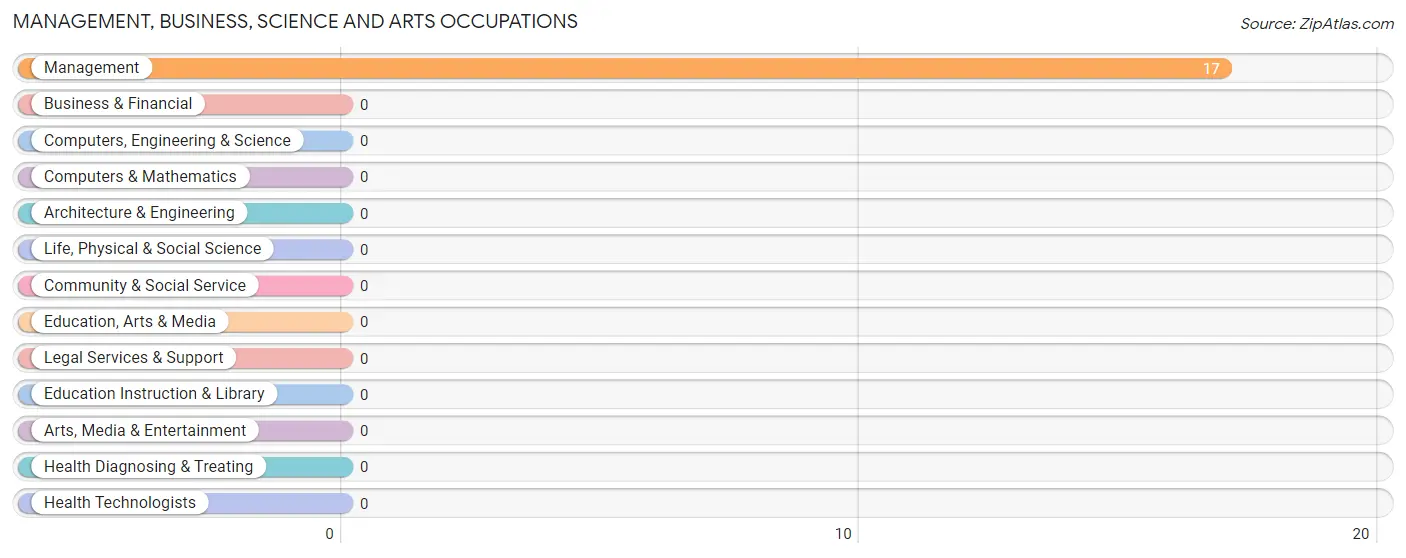
Management, Business, Science and Arts Occupations by Sex
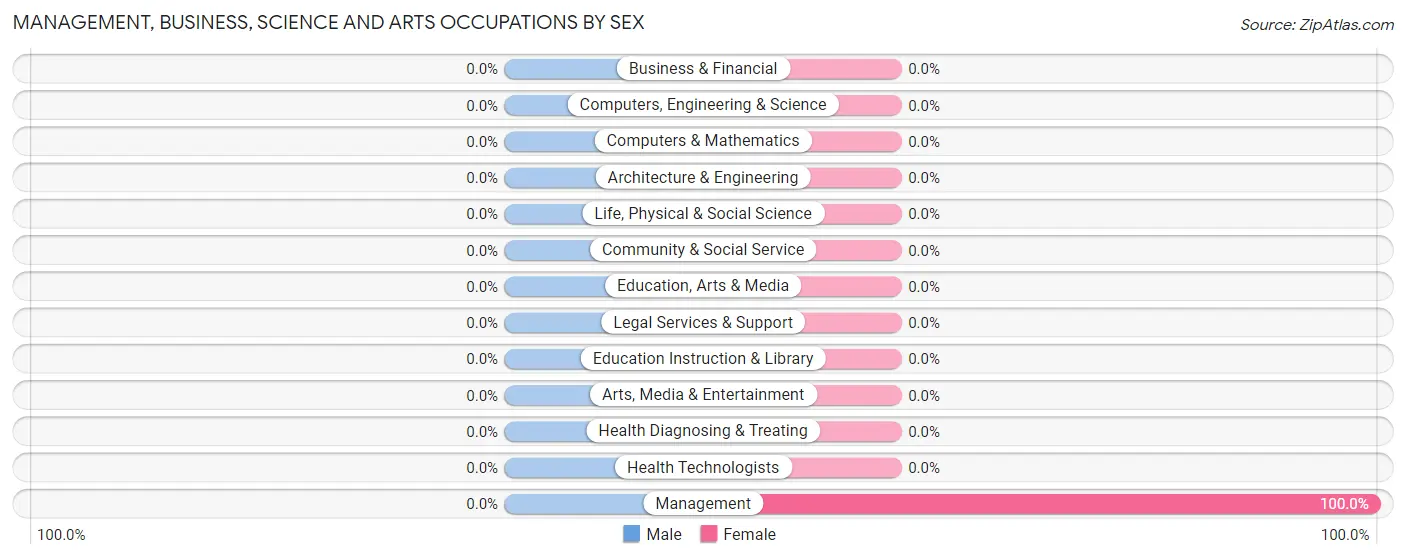
| Occupation | Male | Female |
| Management | 0 (0.0%) | 17 (100.0%) |
| Business & Financial | 0 (0.0%) | 0 (0.0%) |
| Computers, Engineering & Science | 0 (0.0%) | 0 (0.0%) |
| Computers & Mathematics | 0 (0.0%) | 0 (0.0%) |
| Architecture & Engineering | 0 (0.0%) | 0 (0.0%) |
| Life, Physical & Social Science | 0 (0.0%) | 0 (0.0%) |
| Community & Social Service | 0 (0.0%) | 0 (0.0%) |
| Education, Arts & Media | 0 (0.0%) | 0 (0.0%) |
| Legal Services & Support | 0 (0.0%) | 0 (0.0%) |
| Education Instruction & Library | 0 (0.0%) | 0 (0.0%) |
| Arts, Media & Entertainment | 0 (0.0%) | 0 (0.0%) |
| Health Diagnosing & Treating | 0 (0.0%) | 0 (0.0%) |
| Health Technologists | 0 (0.0%) | 0 (0.0%) |
| Total (Category) | 0 (0.0%) | 17 (100.0%) |
| Total (Overall) | 111 (86.7%) | 17 (13.3%) |
Services Occupations
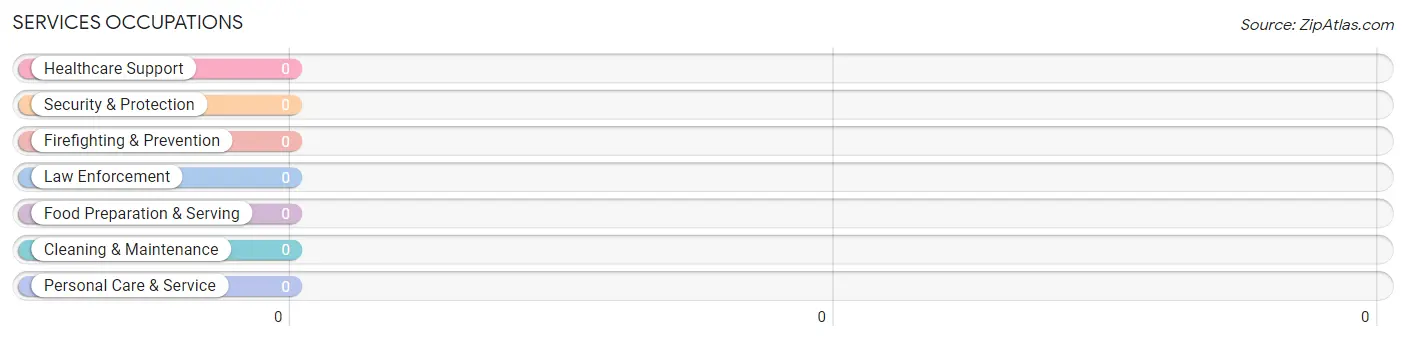
Services Occupations by Sex
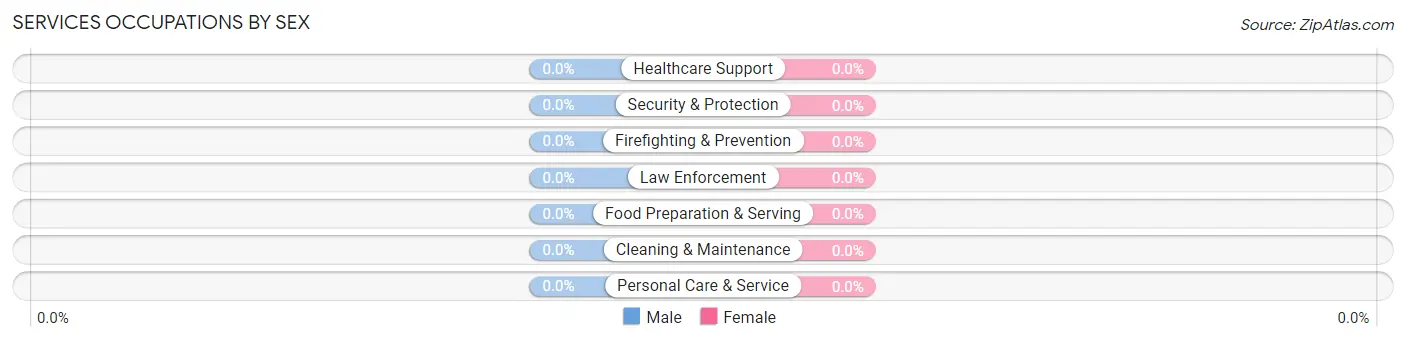
| Occupation | Male | Female |
| Healthcare Support | 0 (0.0%) | 0 (0.0%) |
| Security & Protection | 0 (0.0%) | 0 (0.0%) |
| Firefighting & Prevention | 0 (0.0%) | 0 (0.0%) |
| Law Enforcement | 0 (0.0%) | 0 (0.0%) |
| Food Preparation & Serving | 0 (0.0%) | 0 (0.0%) |
| Cleaning & Maintenance | 0 (0.0%) | 0 (0.0%) |
| Personal Care & Service | 0 (0.0%) | 0 (0.0%) |
| Total (Category) | 0 (0.0%) | 0 (0.0%) |
| Total (Overall) | 111 (86.7%) | 17 (13.3%) |
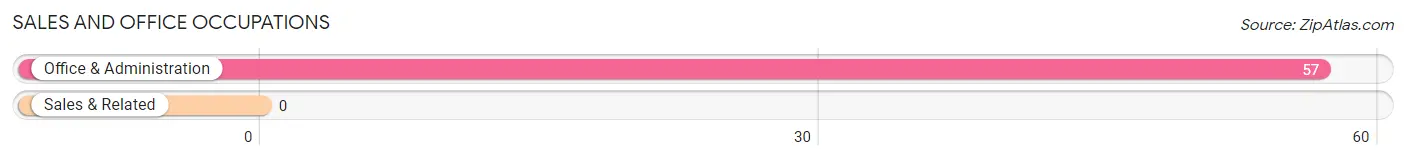
Sales and Office Occupations
The most common Sales and Office occupations in Ravalli are , and Office & Administration (57 | 44.5%).
Sales and Office Occupations by Sex
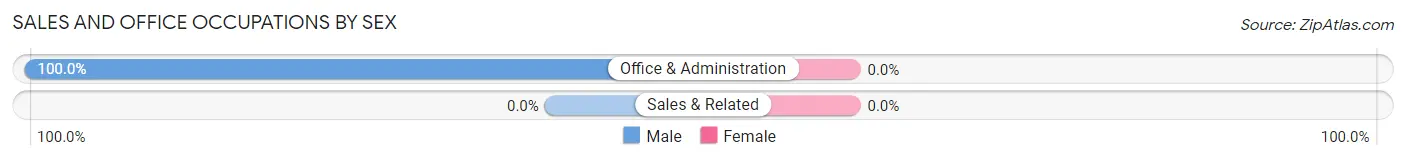
| Occupation | Male | Female |
| Sales & Related | 0 (0.0%) | 0 (0.0%) |
| Office & Administration | 57 (100.0%) | 0 (0.0%) |
| Total (Category) | 57 (100.0%) | 0 (0.0%) |
| Total (Overall) | 111 (86.7%) | 17 (13.3%) |
Natural Resources, Construction and Maintenance Occupations
The most common Natural Resources, Construction and Maintenance occupations in Ravalli are , and Construction & Extraction (47 | 36.7%).
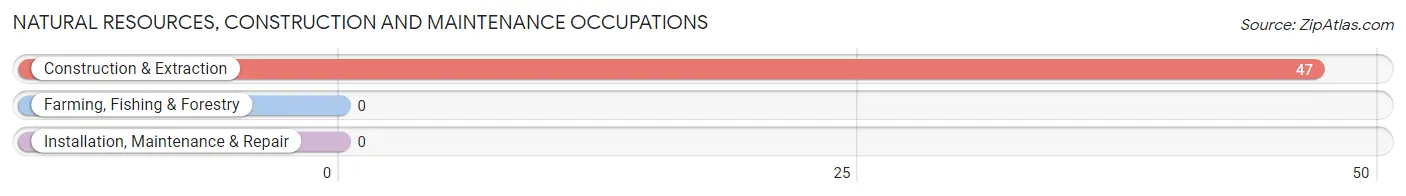
Natural Resources, Construction and Maintenance Occupations by Sex
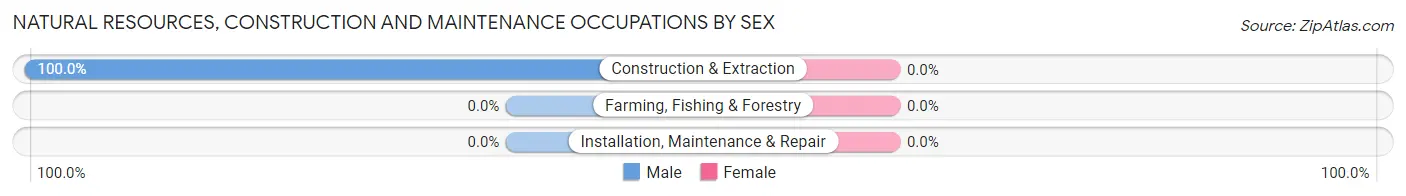
| Occupation | Male | Female |
| Farming, Fishing & Forestry | 0 (0.0%) | 0 (0.0%) |
| Construction & Extraction | 47 (100.0%) | 0 (0.0%) |
| Installation, Maintenance & Repair | 0 (0.0%) | 0 (0.0%) |
| Total (Category) | 47 (100.0%) | 0 (0.0%) |
| Total (Overall) | 111 (86.7%) | 17 (13.3%) |
Production, Transportation and Moving Occupations
The most common Production, Transportation and Moving occupations in Ravalli are , and Transportation (7 | 5.5%).
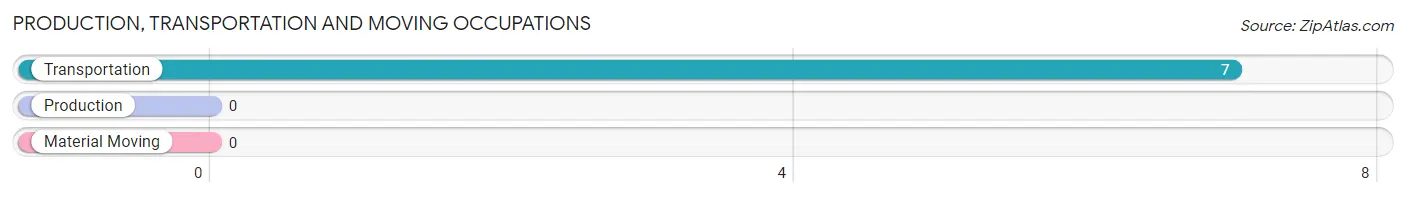
Production, Transportation and Moving Occupations by Sex
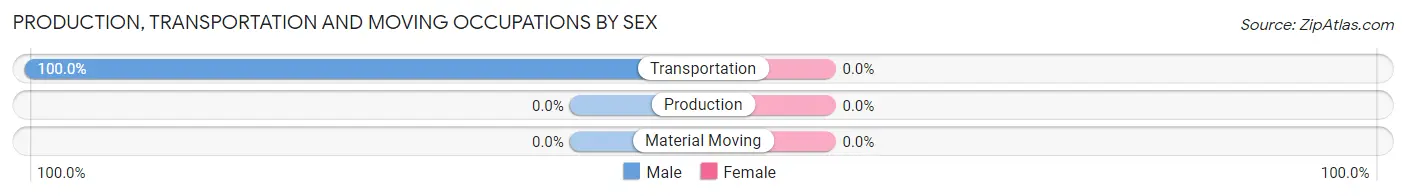
| Occupation | Male | Female |
| Production | 0 (0.0%) | 0 (0.0%) |
| Transportation | 7 (100.0%) | 0 (0.0%) |
| Material Moving | 0 (0.0%) | 0 (0.0%) |
| Total (Category) | 7 (100.0%) | 0 (0.0%) |
| Total (Overall) | 111 (86.7%) | 17 (13.3%) |
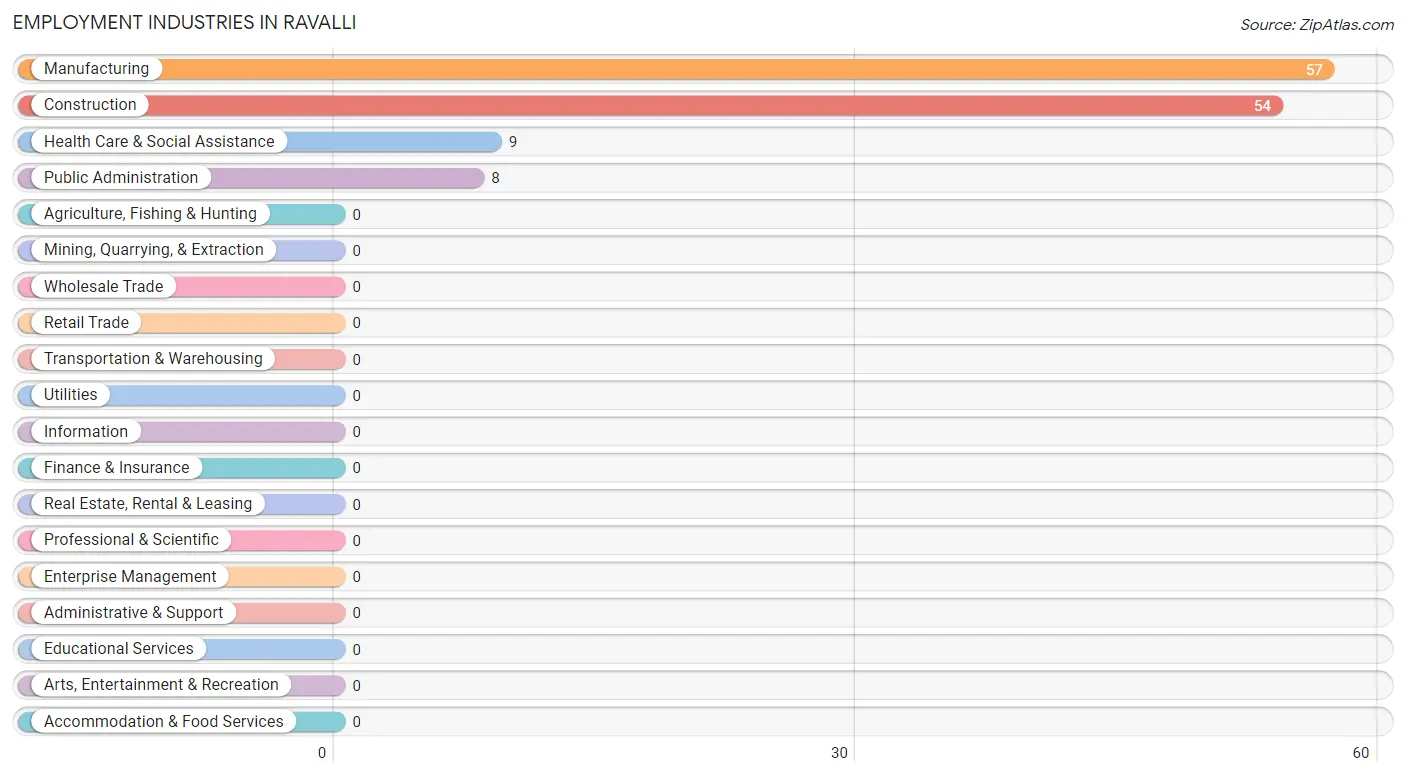
Employment Industries by Sex in Ravalli
Employment Industries in Ravalli
The major employment industries in Ravalli include Manufacturing (57 | 44.5%), Construction (54 | 42.2%), Health Care & Social Assistance (9 | 7.0%), and Public Administration (8 | 6.2%).
Employment Industries by Sex in Ravalli
The Ravalli industries that see more men than women are Construction (100.0%), and Manufacturing (100.0%), whereas the industries that tend to have a higher number of women are Health Care & Social Assistance (100.0%), and Public Administration (100.0%).
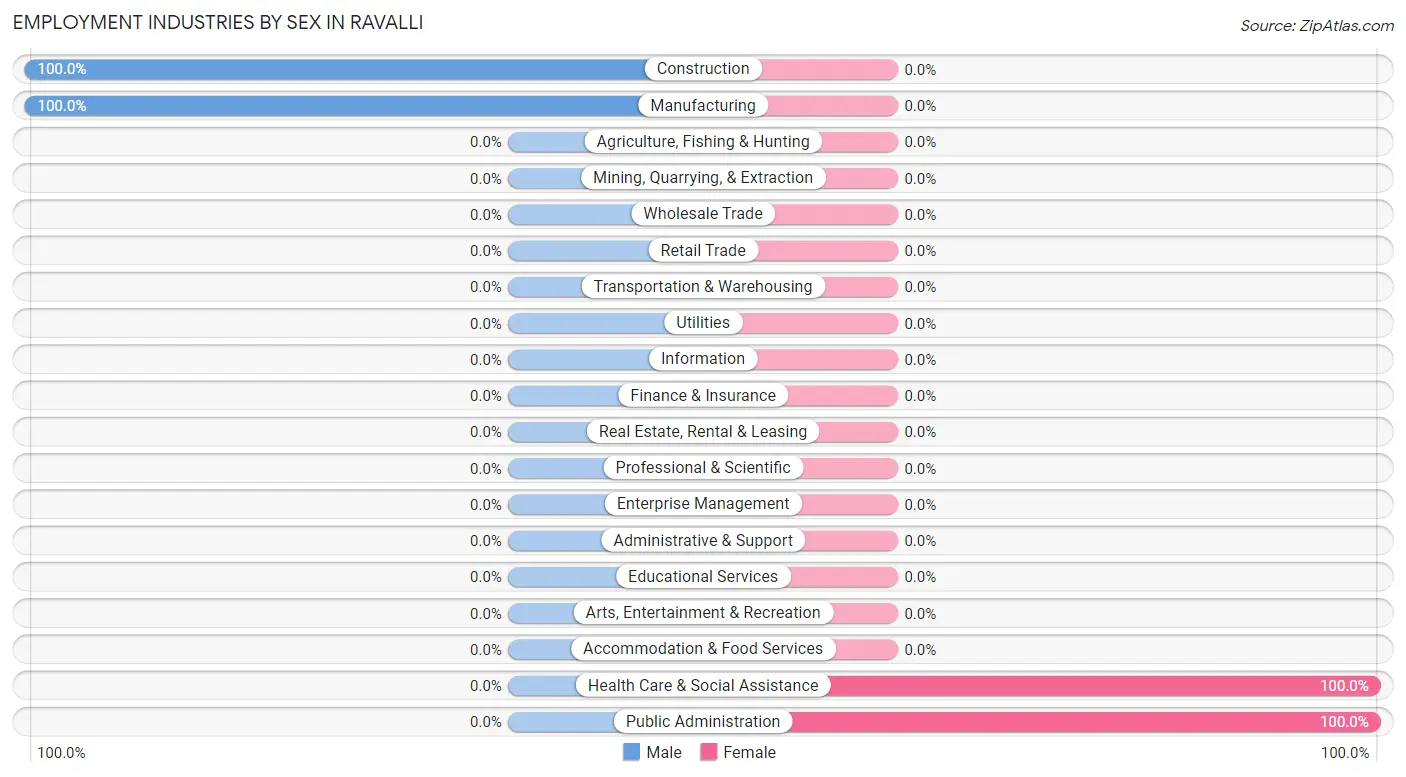
| Industry | Male | Female |
| Agriculture, Fishing & Hunting | 0 (0.0%) | 0 (0.0%) |
| Mining, Quarrying, & Extraction | 0 (0.0%) | 0 (0.0%) |
| Construction | 54 (100.0%) | 0 (0.0%) |
| Manufacturing | 57 (100.0%) | 0 (0.0%) |
| Wholesale Trade | 0 (0.0%) | 0 (0.0%) |
| Retail Trade | 0 (0.0%) | 0 (0.0%) |
| Transportation & Warehousing | 0 (0.0%) | 0 (0.0%) |
| Utilities | 0 (0.0%) | 0 (0.0%) |
| Information | 0 (0.0%) | 0 (0.0%) |
| Finance & Insurance | 0 (0.0%) | 0 (0.0%) |
| Real Estate, Rental & Leasing | 0 (0.0%) | 0 (0.0%) |
| Professional & Scientific | 0 (0.0%) | 0 (0.0%) |
| Enterprise Management | 0 (0.0%) | 0 (0.0%) |
| Administrative & Support | 0 (0.0%) | 0 (0.0%) |
| Educational Services | 0 (0.0%) | 0 (0.0%) |
| Health Care & Social Assistance | 0 (0.0%) | 9 (100.0%) |
| Arts, Entertainment & Recreation | 0 (0.0%) | 0 (0.0%) |
| Accommodation & Food Services | 0 (0.0%) | 0 (0.0%) |
| Public Administration | 0 (0.0%) | 8 (100.0%) |
| Total | 111 (86.7%) | 17 (13.3%) |
Education in Ravalli
School Enrollment in Ravalli
| School Level | # Students | % Students |
| Nursery / Preschool | 0 | 0.0% |
| Kindergarten | 0 | 0.0% |
| Elementary School | 0 | 0.0% |
| Middle School | 0 | 0.0% |
| High School | 0 | 0.0% |
| College / Undergraduate | 0 | 0.0% |
| Graduate / Professional | 0 | 0.0% |
| Total | 0 | 0.0% |
School Enrollment by Age by Funding Source in Ravalli
| Age Bracket | Public School | Private School |
| 3 to 4 Year Olds | 0 (0.0%) | 0 (0.0%) |
| 5 to 9 Year Old | 0 (0.0%) | 0 (0.0%) |
| 10 to 14 Year Olds | 0 (0.0%) | 0 (0.0%) |
| 15 to 17 Year Olds | 0 (0.0%) | 0 (0.0%) |
| 18 to 19 Year Olds | 0 (0.0%) | 0 (0.0%) |
| 20 to 24 Year Olds | 0 (0.0%) | 0 (0.0%) |
| 25 to 34 Year Olds | 0 (0.0%) | 0 (0.0%) |
| 35 Years and over | 0 (0.0%) | 0 (0.0%) |
| Total | 0 (0.0%) | 0 (0.0%) |
Educational Attainment by Field of Study in Ravalli
Computers & mathematics (10 | 37.0%), bio, nature & agricultural (9 | 33.3%), and social sciences (8 | 29.6%) are the most common fields of study among 27 individuals in Ravalli who have obtained a bachelor's degree or higher.
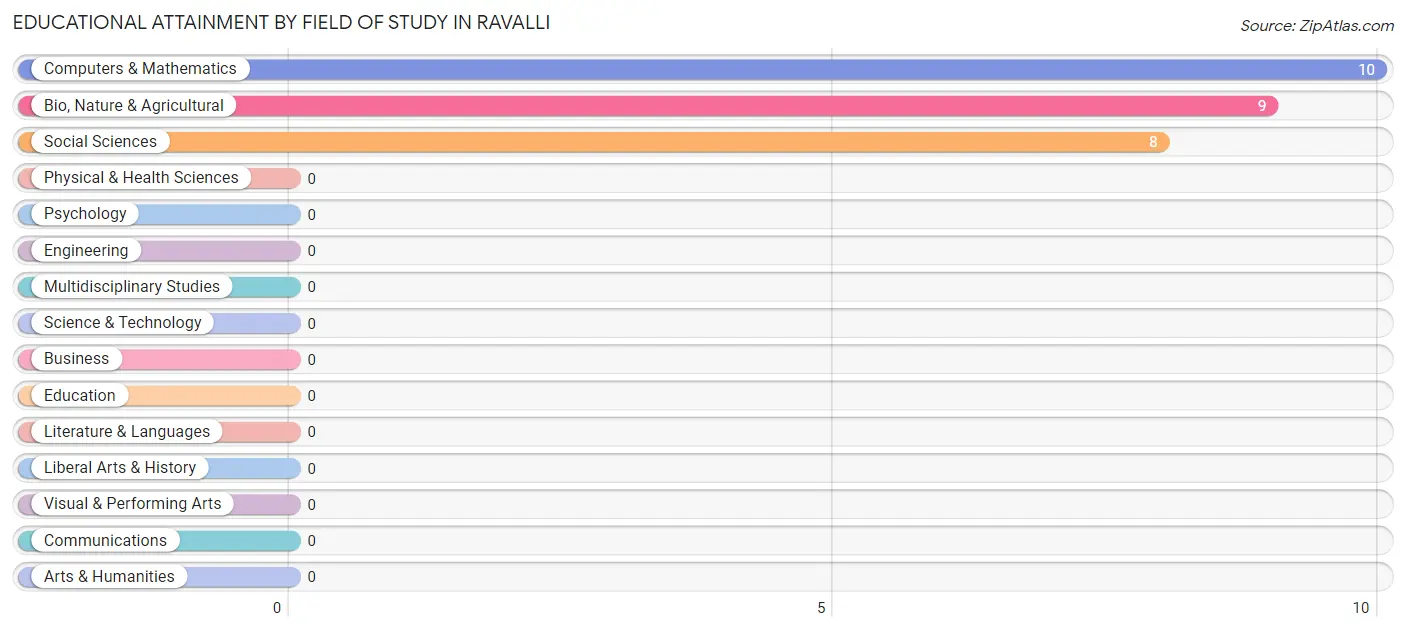
| Field of Study | # Graduates | % Graduates |
| Computers & Mathematics | 10 | 37.0% |
| Bio, Nature & Agricultural | 9 | 33.3% |
| Physical & Health Sciences | 0 | 0.0% |
| Psychology | 0 | 0.0% |
| Social Sciences | 8 | 29.6% |
| Engineering | 0 | 0.0% |
| Multidisciplinary Studies | 0 | 0.0% |
| Science & Technology | 0 | 0.0% |
| Business | 0 | 0.0% |
| Education | 0 | 0.0% |
| Literature & Languages | 0 | 0.0% |
| Liberal Arts & History | 0 | 0.0% |
| Visual & Performing Arts | 0 | 0.0% |
| Communications | 0 | 0.0% |
| Arts & Humanities | 0 | 0.0% |
| Total | 27 | 100.0% |
Transportation & Commute in Ravalli
Vehicle Availability by Sex in Ravalli
The most prevalent vehicle ownership categories in Ravalli are males with 3 vehicles (57, accounting for 89.1%) and females with 3 vehicles (8, making up 335.3%).
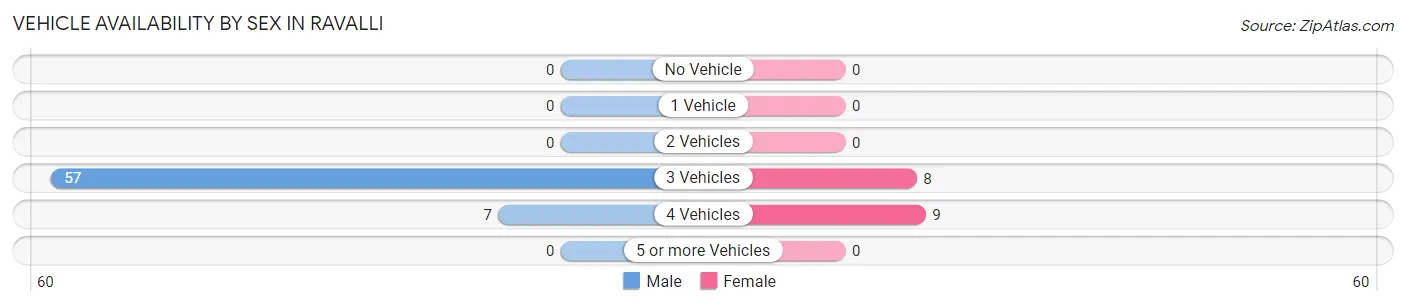
| Vehicles Available | Male | Female |
| No Vehicle | 0 (0.0%) | 0 (0.0%) |
| 1 Vehicle | 0 (0.0%) | 0 (0.0%) |
| 2 Vehicles | 0 (0.0%) | 0 (0.0%) |
| 3 Vehicles | 57 (89.1%) | 8 (47.1%) |
| 4 Vehicles | 7 (10.9%) | 9 (52.9%) |
| 5 or more Vehicles | 0 (0.0%) | 0 (0.0%) |
| Total | 64 (100.0%) | 17 (100.0%) |
Commute Time in Ravalli
The most frequently occuring commute durations in Ravalli are 20 to 24 minutes (65 commuters, 80.2%), 5 to 9 minutes (9 commuters, 11.1%), and 10 to 14 minutes (7 commuters, 8.6%).
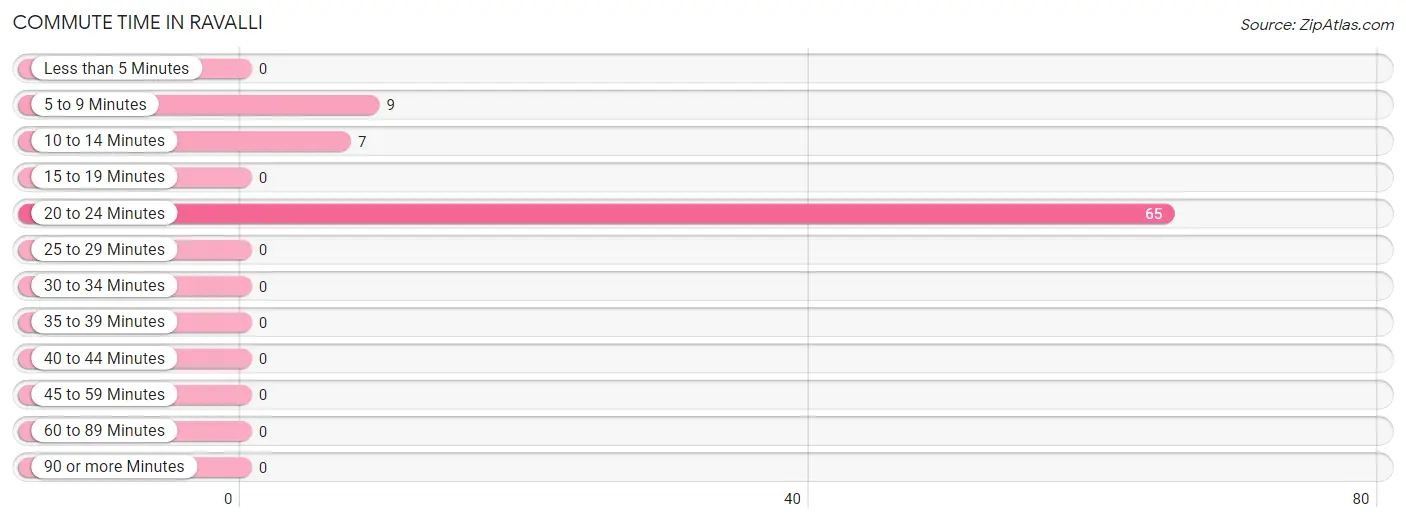
| Commute Time | # Commuters | % Commuters |
| Less than 5 Minutes | 0 | 0.0% |
| 5 to 9 Minutes | 9 | 11.1% |
| 10 to 14 Minutes | 7 | 8.6% |
| 15 to 19 Minutes | 0 | 0.0% |
| 20 to 24 Minutes | 65 | 80.2% |
| 25 to 29 Minutes | 0 | 0.0% |
| 30 to 34 Minutes | 0 | 0.0% |
| 35 to 39 Minutes | 0 | 0.0% |
| 40 to 44 Minutes | 0 | 0.0% |
| 45 to 59 Minutes | 0 | 0.0% |
| 60 to 89 Minutes | 0 | 0.0% |
| 90 or more Minutes | 0 | 0.0% |
Commute Time by Sex in Ravalli
The most common commute times in Ravalli are 20 to 24 minutes (57 commuters, 89.1%) for males and 5 to 9 minutes (9 commuters, 52.9%) for females.
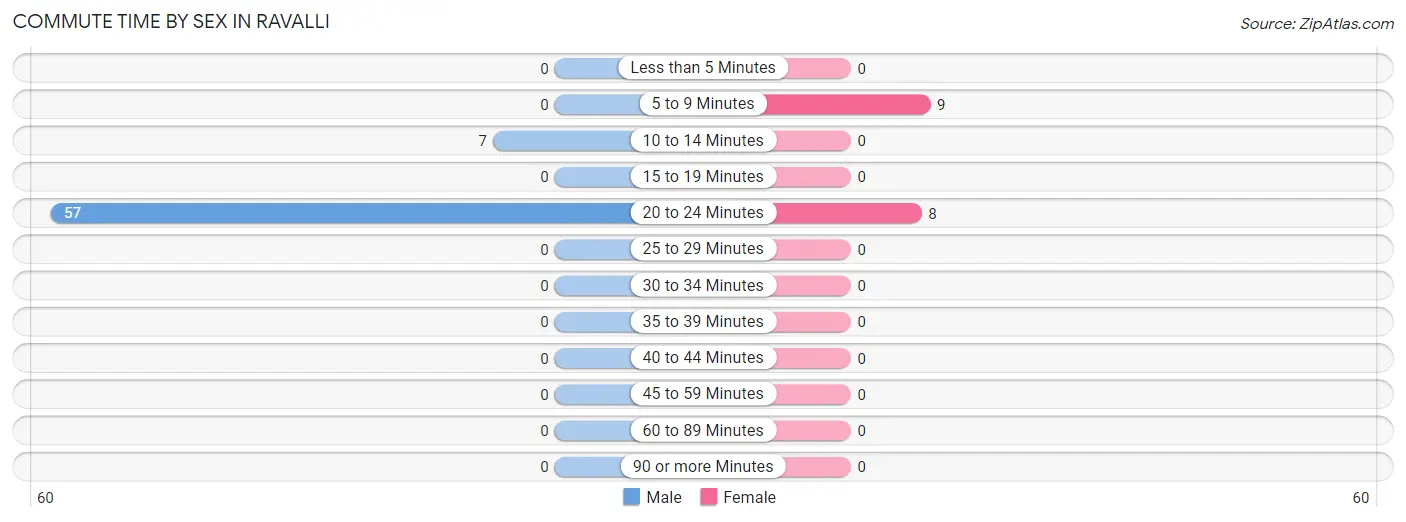
| Commute Time | Male | Female |
| Less than 5 Minutes | 0 (0.0%) | 0 (0.0%) |
| 5 to 9 Minutes | 0 (0.0%) | 9 (52.9%) |
| 10 to 14 Minutes | 7 (10.9%) | 0 (0.0%) |
| 15 to 19 Minutes | 0 (0.0%) | 0 (0.0%) |
| 20 to 24 Minutes | 57 (89.1%) | 8 (47.1%) |
| 25 to 29 Minutes | 0 (0.0%) | 0 (0.0%) |
| 30 to 34 Minutes | 0 (0.0%) | 0 (0.0%) |
| 35 to 39 Minutes | 0 (0.0%) | 0 (0.0%) |
| 40 to 44 Minutes | 0 (0.0%) | 0 (0.0%) |
| 45 to 59 Minutes | 0 (0.0%) | 0 (0.0%) |
| 60 to 89 Minutes | 0 (0.0%) | 0 (0.0%) |
| 90 or more Minutes | 0 (0.0%) | 0 (0.0%) |
Time of Departure to Work by Sex in Ravalli
The most frequent times of departure to work in Ravalli are 8:30 AM to 8:59 AM (57, 89.1%) for males and 8:30 AM to 8:59 AM (17, 100.0%) for females.
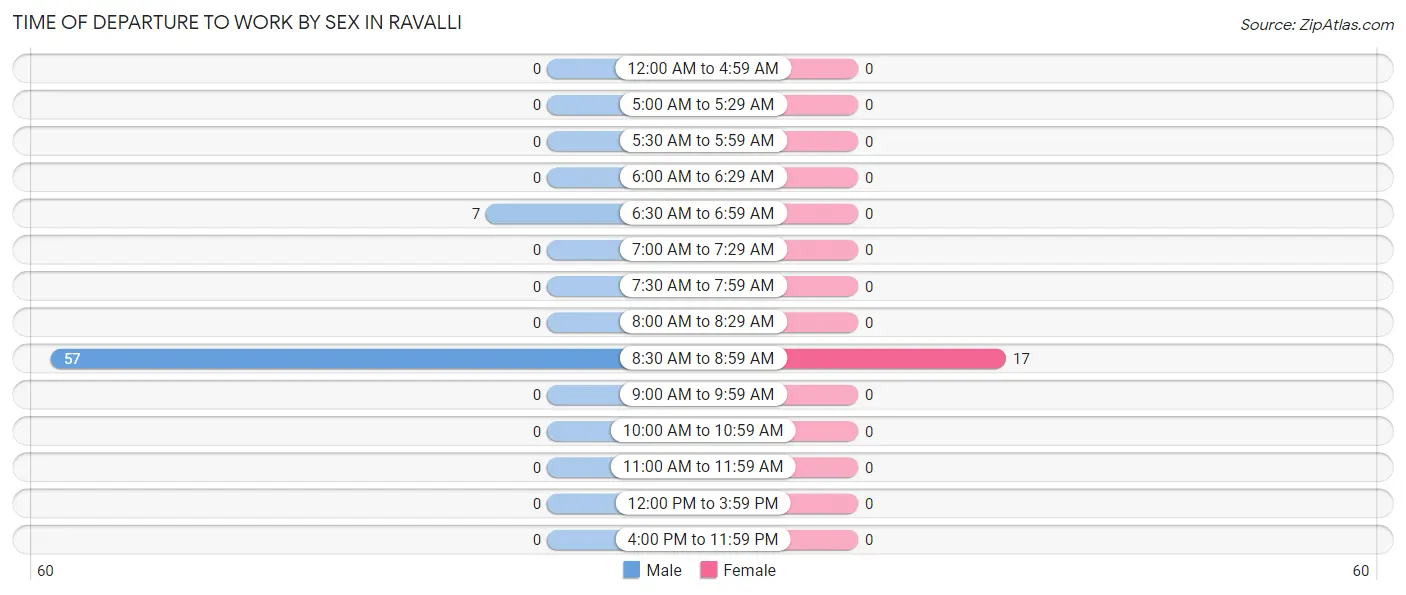
| Time of Departure | Male | Female |
| 12:00 AM to 4:59 AM | 0 (0.0%) | 0 (0.0%) |
| 5:00 AM to 5:29 AM | 0 (0.0%) | 0 (0.0%) |
| 5:30 AM to 5:59 AM | 0 (0.0%) | 0 (0.0%) |
| 6:00 AM to 6:29 AM | 0 (0.0%) | 0 (0.0%) |
| 6:30 AM to 6:59 AM | 7 (10.9%) | 0 (0.0%) |
| 7:00 AM to 7:29 AM | 0 (0.0%) | 0 (0.0%) |
| 7:30 AM to 7:59 AM | 0 (0.0%) | 0 (0.0%) |
| 8:00 AM to 8:29 AM | 0 (0.0%) | 0 (0.0%) |
| 8:30 AM to 8:59 AM | 57 (89.1%) | 17 (100.0%) |
| 9:00 AM to 9:59 AM | 0 (0.0%) | 0 (0.0%) |
| 10:00 AM to 10:59 AM | 0 (0.0%) | 0 (0.0%) |
| 11:00 AM to 11:59 AM | 0 (0.0%) | 0 (0.0%) |
| 12:00 PM to 3:59 PM | 0 (0.0%) | 0 (0.0%) |
| 4:00 PM to 11:59 PM | 0 (0.0%) | 0 (0.0%) |
| Total | 64 (100.0%) | 17 (100.0%) |
Housing Occupancy in Ravalli
Occupancy by Ownership in Ravalli
Of the total 89 dwellings in Ravalli, owner-occupied units account for 89 (100.0%), while renter-occupied units make up 0 (0.0%).
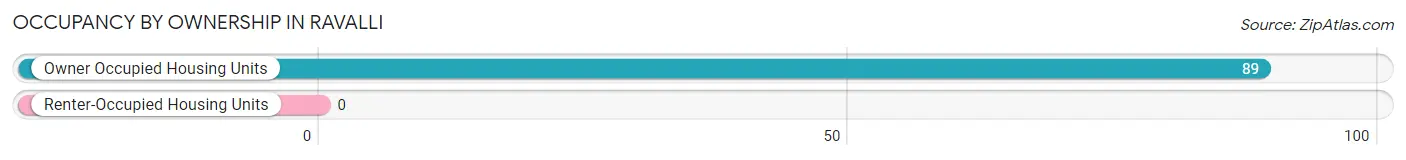
| Occupancy | # Housing Units | % Housing Units |
| Owner Occupied Housing Units | 89 | 100.0% |
| Renter-Occupied Housing Units | 0 | 0.0% |
| Total Occupied Housing Units | 89 | 100.0% |
Occupancy by Household Size in Ravalli
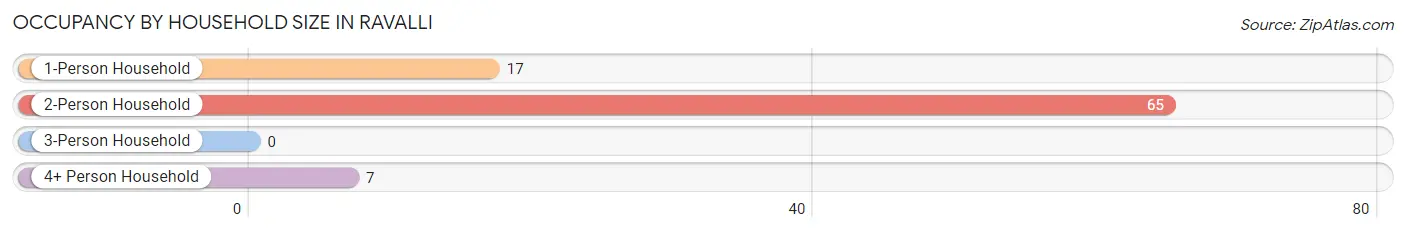
| Household Size | # Housing Units | % Housing Units |
| 1-Person Household | 17 | 19.1% |
| 2-Person Household | 65 | 73.0% |
| 3-Person Household | 0 | 0.0% |
| 4+ Person Household | 7 | 7.9% |
| Total Housing Units | 89 | 100.0% |
Occupancy by Ownership by Household Size in Ravalli
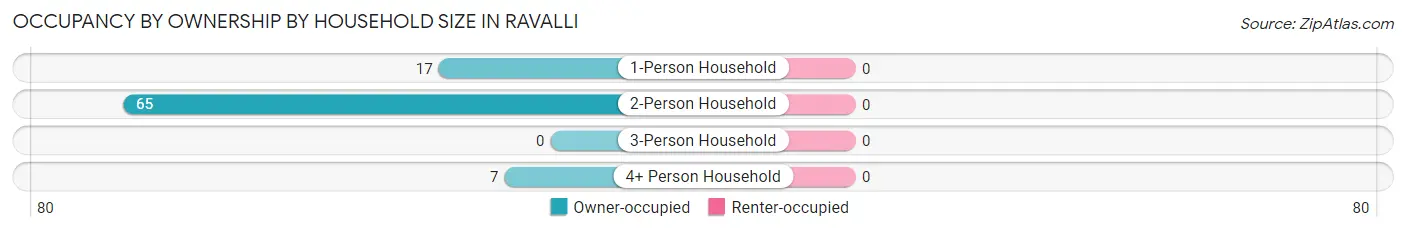
| Household Size | Owner-occupied | Renter-occupied |
| 1-Person Household | 17 (100.0%) | 0 (0.0%) |
| 2-Person Household | 65 (100.0%) | 0 (0.0%) |
| 3-Person Household | 0 (0.0%) | 0 (0.0%) |
| 4+ Person Household | 7 (100.0%) | 0 (0.0%) |
| Total Housing Units | 89 (100.0%) | 0 (0.0%) |
Occupancy by Educational Attainment in Ravalli
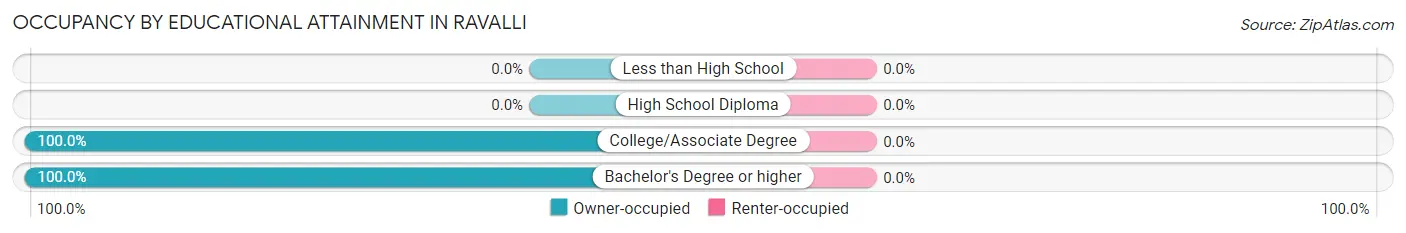
| Household Size | Owner-occupied | Renter-occupied |
| Less than High School | 0 (0.0%) | 0 (0.0%) |
| High School Diploma | 0 (0.0%) | 0 (0.0%) |
| College/Associate Degree | 81 (100.0%) | 0 (0.0%) |
| Bachelor's Degree or higher | 8 (100.0%) | 0 (0.0%) |
Occupancy by Age of Householder in Ravalli
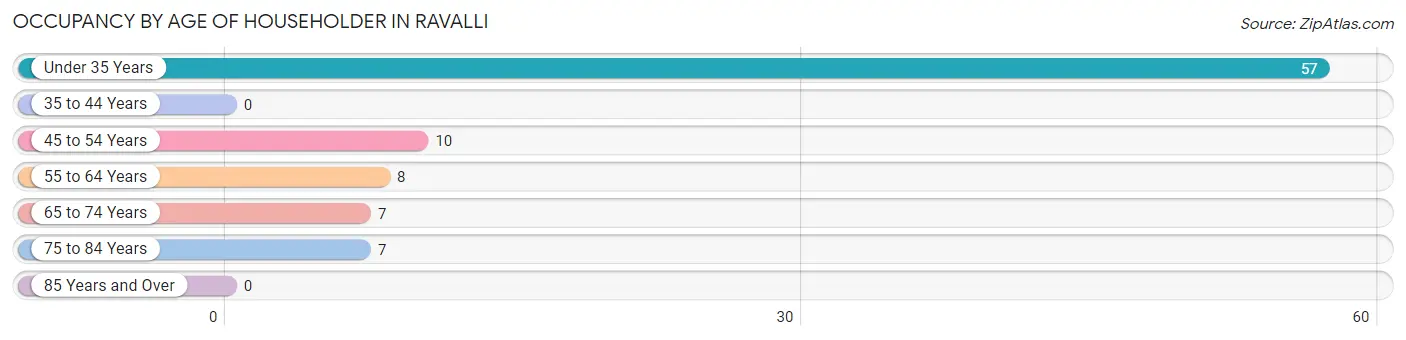
| Age Bracket | # Households | % Households |
| Under 35 Years | 57 | 64.0% |
| 35 to 44 Years | 0 | 0.0% |
| 45 to 54 Years | 10 | 11.2% |
| 55 to 64 Years | 8 | 9.0% |
| 65 to 74 Years | 7 | 7.9% |
| 75 to 84 Years | 7 | 7.9% |
| 85 Years and Over | 0 | 0.0% |
| Total | 89 | 100.0% |
Housing Finances in Ravalli
Median Income by Occupancy in Ravalli
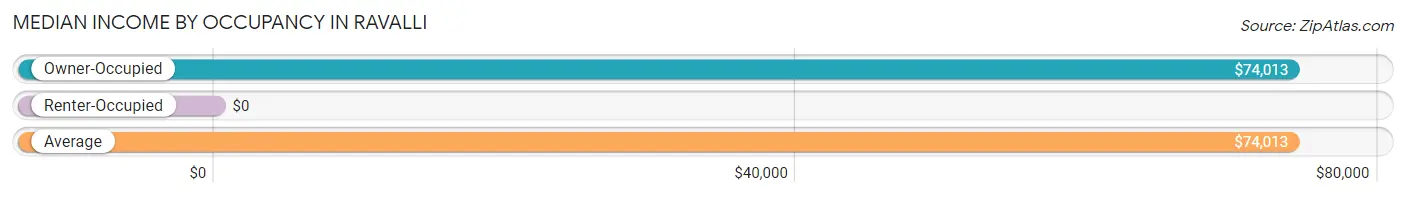
| Occupancy Type | # Households | Median Income |
| Owner-Occupied | 89 (100.0%) | $74,013 |
| Renter-Occupied | 0 (0.0%) | $0 |
| Average | 89 (100.0%) | $74,013 |
Occupancy by Householder Income Bracket in Ravalli
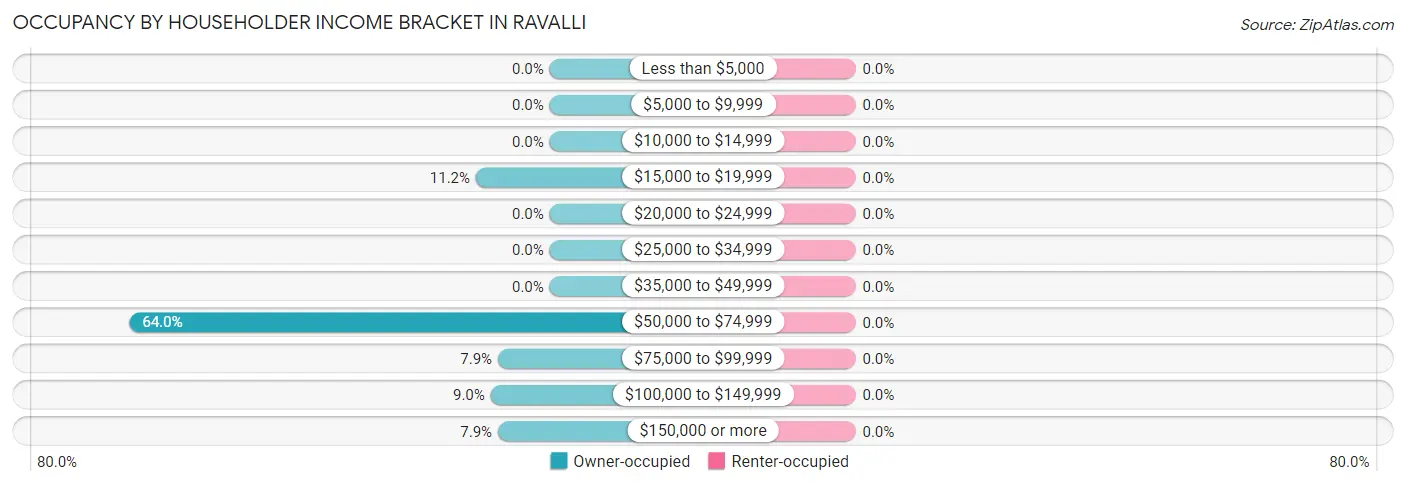
| Income Bracket | Owner-occupied | Renter-occupied |
| Less than $5,000 | 0 (0.0%) | 0 (0.0%) |
| $5,000 to $9,999 | 0 (0.0%) | 0 (0.0%) |
| $10,000 to $14,999 | 0 (0.0%) | 0 (0.0%) |
| $15,000 to $19,999 | 10 (11.2%) | 0 (0.0%) |
| $20,000 to $24,999 | 0 (0.0%) | 0 (0.0%) |
| $25,000 to $34,999 | 0 (0.0%) | 0 (0.0%) |
| $35,000 to $49,999 | 0 (0.0%) | 0 (0.0%) |
| $50,000 to $74,999 | 57 (64.0%) | 0 (0.0%) |
| $75,000 to $99,999 | 7 (7.9%) | 0 (0.0%) |
| $100,000 to $149,999 | 8 (9.0%) | 0 (0.0%) |
| $150,000 or more | 7 (7.9%) | 0 (0.0%) |
| Total | 89 (100.0%) | 0 (0.0%) |
Monthly Housing Cost Tiers in Ravalli
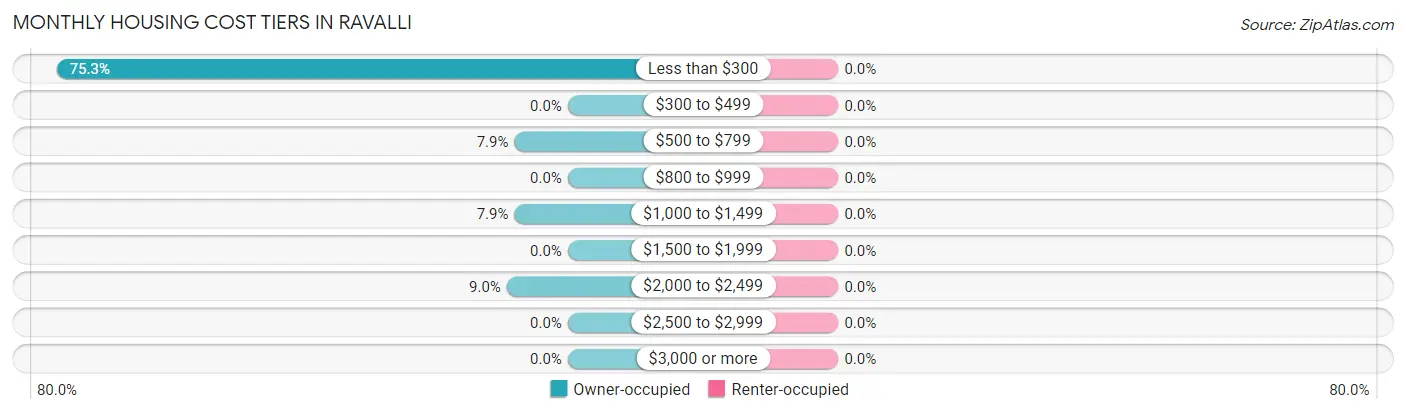
| Monthly Cost | Owner-occupied | Renter-occupied |
| Less than $300 | 67 (75.3%) | 0 (0.0%) |
| $300 to $499 | 0 (0.0%) | 0 (0.0%) |
| $500 to $799 | 7 (7.9%) | 0 (0.0%) |
| $800 to $999 | 0 (0.0%) | 0 (0.0%) |
| $1,000 to $1,499 | 7 (7.9%) | 0 (0.0%) |
| $1,500 to $1,999 | 0 (0.0%) | 0 (0.0%) |
| $2,000 to $2,499 | 8 (9.0%) | 0 (0.0%) |
| $2,500 to $2,999 | 0 (0.0%) | 0 (0.0%) |
| $3,000 or more | 0 (0.0%) | 0 (0.0%) |
| Total | 89 (100.0%) | 0 (0.0%) |
Physical Housing Characteristics in Ravalli
Housing Structures in Ravalli
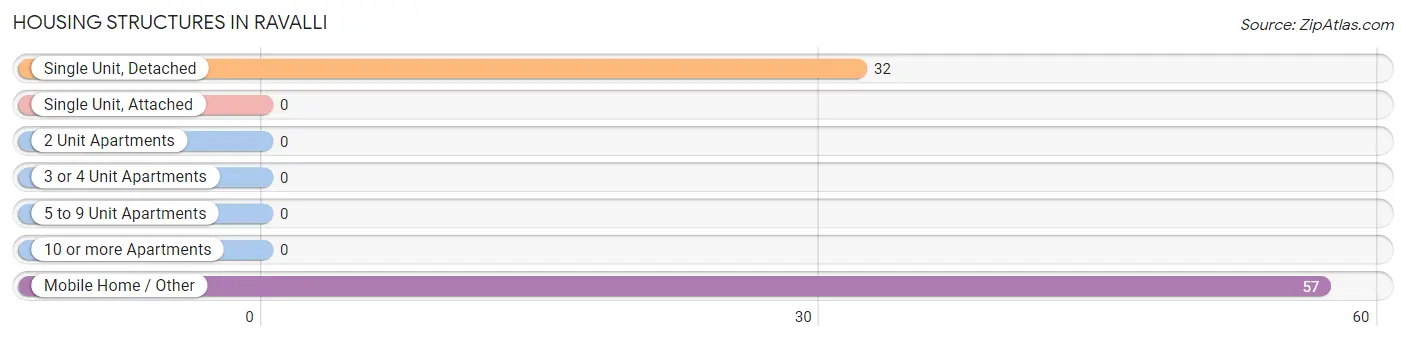
| Structure Type | # Housing Units | % Housing Units |
| Single Unit, Detached | 32 | 36.0% |
| Single Unit, Attached | 0 | 0.0% |
| 2 Unit Apartments | 0 | 0.0% |
| 3 or 4 Unit Apartments | 0 | 0.0% |
| 5 to 9 Unit Apartments | 0 | 0.0% |
| 10 or more Apartments | 0 | 0.0% |
| Mobile Home / Other | 57 | 64.0% |
| Total | 89 | 100.0% |
Housing Structures by Occupancy in Ravalli
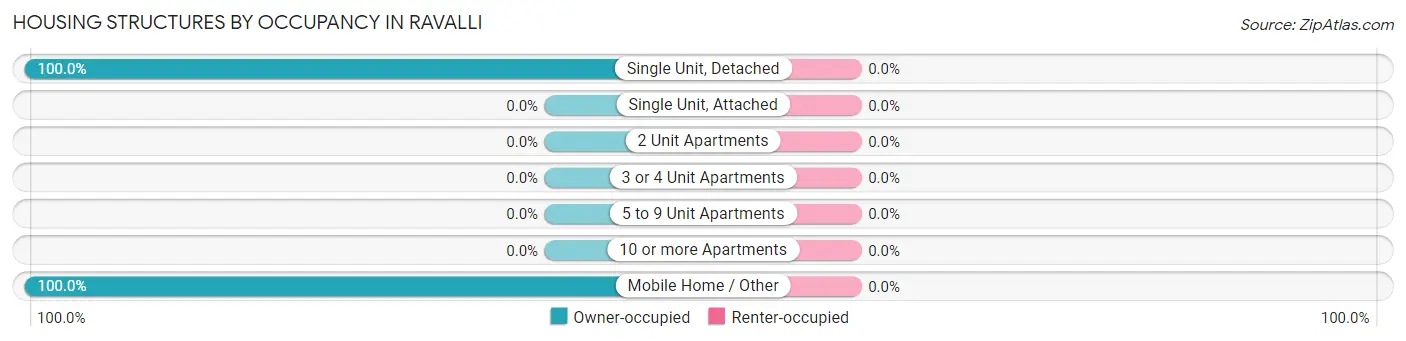
| Structure Type | Owner-occupied | Renter-occupied |
| Single Unit, Detached | 32 (100.0%) | 0 (0.0%) |
| Single Unit, Attached | 0 (0.0%) | 0 (0.0%) |
| 2 Unit Apartments | 0 (0.0%) | 0 (0.0%) |
| 3 or 4 Unit Apartments | 0 (0.0%) | 0 (0.0%) |
| 5 to 9 Unit Apartments | 0 (0.0%) | 0 (0.0%) |
| 10 or more Apartments | 0 (0.0%) | 0 (0.0%) |
| Mobile Home / Other | 57 (100.0%) | 0 (0.0%) |
| Total | 89 (100.0%) | 0 (0.0%) |
Housing Structures by Number of Rooms in Ravalli
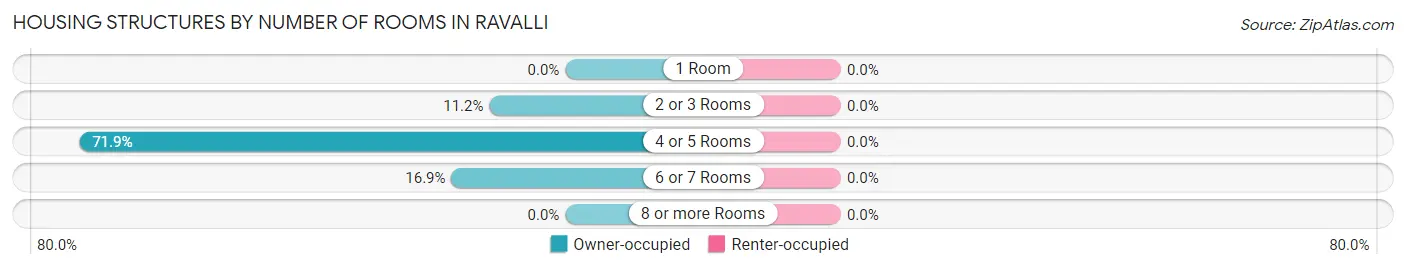
| Number of Rooms | Owner-occupied | Renter-occupied |
| 1 Room | 0 (0.0%) | 0 (0.0%) |
| 2 or 3 Rooms | 10 (11.2%) | 0 (0.0%) |
| 4 or 5 Rooms | 64 (71.9%) | 0 (0.0%) |
| 6 or 7 Rooms | 15 (16.9%) | 0 (0.0%) |
| 8 or more Rooms | 0 (0.0%) | 0 (0.0%) |
| Total | 89 (100.0%) | 0 (0.0%) |
Housing Structure by Heating Type in Ravalli
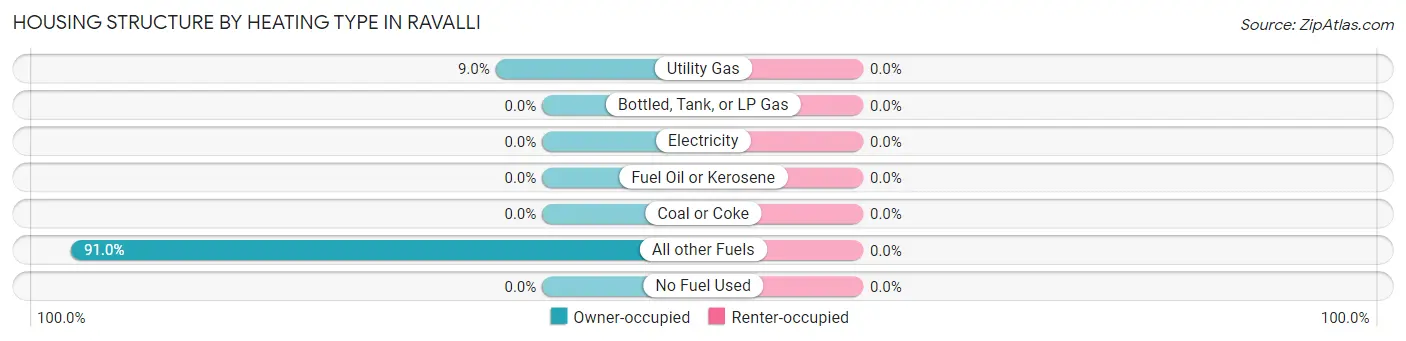
| Heating Type | Owner-occupied | Renter-occupied |
| Utility Gas | 8 (9.0%) | 0 (0.0%) |
| Bottled, Tank, or LP Gas | 0 (0.0%) | 0 (0.0%) |
| Electricity | 0 (0.0%) | 0 (0.0%) |
| Fuel Oil or Kerosene | 0 (0.0%) | 0 (0.0%) |
| Coal or Coke | 0 (0.0%) | 0 (0.0%) |
| All other Fuels | 81 (91.0%) | 0 (0.0%) |
| No Fuel Used | 0 (0.0%) | 0 (0.0%) |
| Total | 89 (100.0%) | 0 (0.0%) |
Household Vehicle Usage in Ravalli
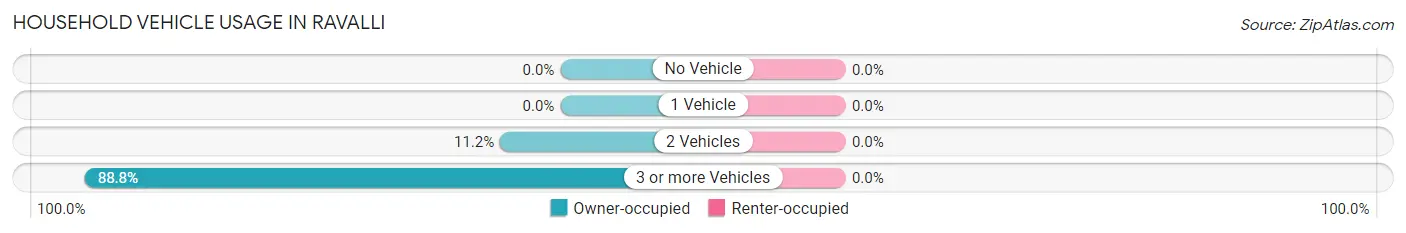
| Vehicles per Household | Owner-occupied | Renter-occupied |
| No Vehicle | 0 (0.0%) | 0 (0.0%) |
| 1 Vehicle | 0 (0.0%) | 0 (0.0%) |
| 2 Vehicles | 10 (11.2%) | 0 (0.0%) |
| 3 or more Vehicles | 79 (88.8%) | 0 (0.0%) |
| Total | 89 (100.0%) | 0 (0.0%) |
Real Estate & Mortgages in Ravalli
Real Estate and Mortgage Overview in Ravalli
| Characteristic | Without Mortgage | With Mortgage |
| Housing Units | 81 | 8 |
| Median Property Value | - | - |
| Median Household Income | $73,838 | $0 |
| Monthly Housing Costs | $236 | $0 |
| Real Estate Taxes | - | - |
Property Value by Mortgage Status in Ravalli
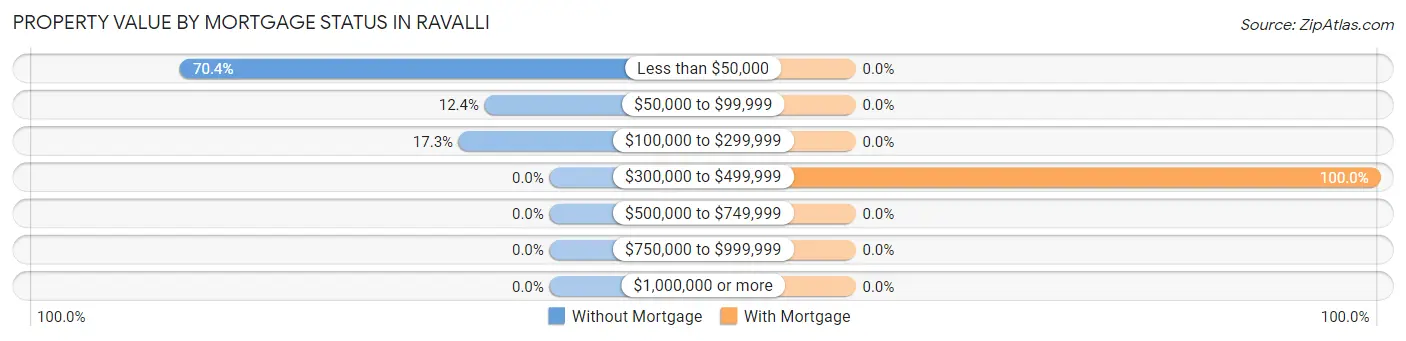
| Property Value | Without Mortgage | With Mortgage |
| Less than $50,000 | 57 (70.4%) | 0 (0.0%) |
| $50,000 to $99,999 | 10 (12.3%) | 0 (0.0%) |
| $100,000 to $299,999 | 14 (17.3%) | 0 (0.0%) |
| $300,000 to $499,999 | 0 (0.0%) | 8 (100.0%) |
| $500,000 to $749,999 | 0 (0.0%) | 0 (0.0%) |
| $750,000 to $999,999 | 0 (0.0%) | 0 (0.0%) |
| $1,000,000 or more | 0 (0.0%) | 0 (0.0%) |
| Total | 81 (100.0%) | 8 (100.0%) |
Household Income by Mortgage Status in Ravalli
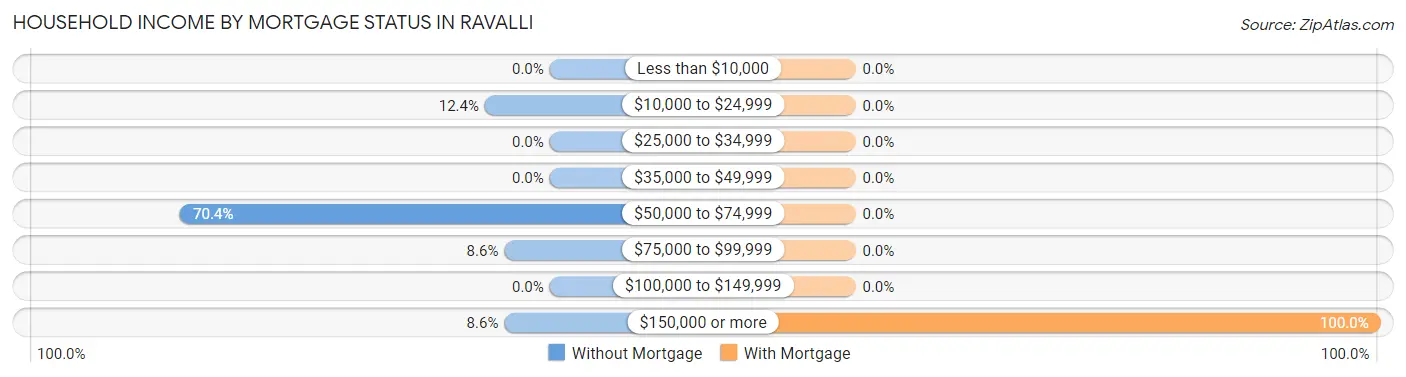
| Household Income | Without Mortgage | With Mortgage |
| Less than $10,000 | 0 (0.0%) | 0 (0.0%) |
| $10,000 to $24,999 | 10 (12.3%) | 0 (0.0%) |
| $25,000 to $34,999 | 0 (0.0%) | 0 (0.0%) |
| $35,000 to $49,999 | 0 (0.0%) | 0 (0.0%) |
| $50,000 to $74,999 | 57 (70.4%) | 0 (0.0%) |
| $75,000 to $99,999 | 7 (8.6%) | 0 (0.0%) |
| $100,000 to $149,999 | 0 (0.0%) | 0 (0.0%) |
| $150,000 or more | 7 (8.6%) | 8 (100.0%) |
| Total | 81 (100.0%) | 8 (100.0%) |
Property Value to Household Income Ratio in Ravalli
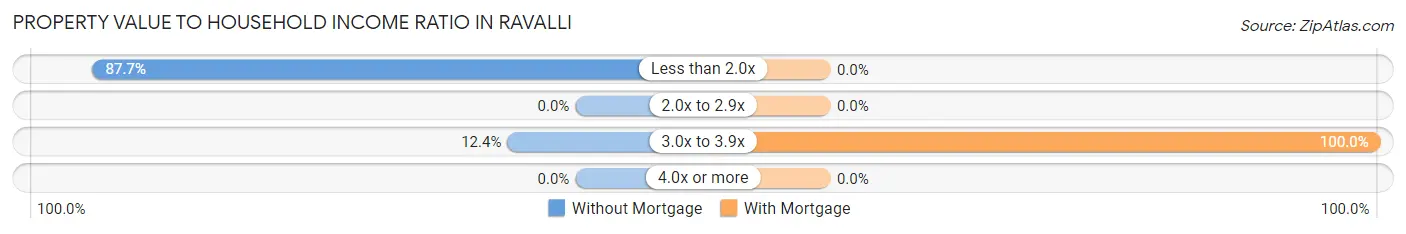
| Value-to-Income Ratio | Without Mortgage | With Mortgage |
| Less than 2.0x | 71 (87.6%) | 0 (0.0%) |
| 2.0x to 2.9x | 0 (0.0%) | 0 (0.0%) |
| 3.0x to 3.9x | 10 (12.3%) | 8 (100.0%) |
| 4.0x or more | 0 (0.0%) | 0 (0.0%) |
| Total | 81 (100.0%) | 8 (100.0%) |
Real Estate Taxes by Mortgage Status in Ravalli
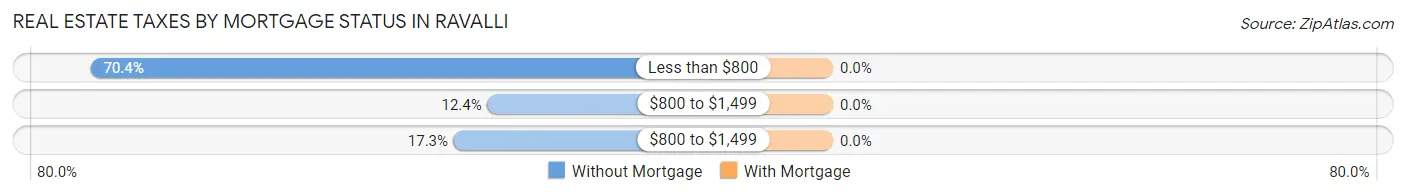
| Property Taxes | Without Mortgage | With Mortgage |
| Less than $800 | 57 (70.4%) | 0 (0.0%) |
| $800 to $1,499 | 10 (12.3%) | 0 (0.0%) |
| $800 to $1,499 | 14 (17.3%) | 0 (0.0%) |
| Total | 81 (100.0%) | 8 (100.0%) |
Health & Disability in Ravalli
Health Insurance Coverage by Age in Ravalli
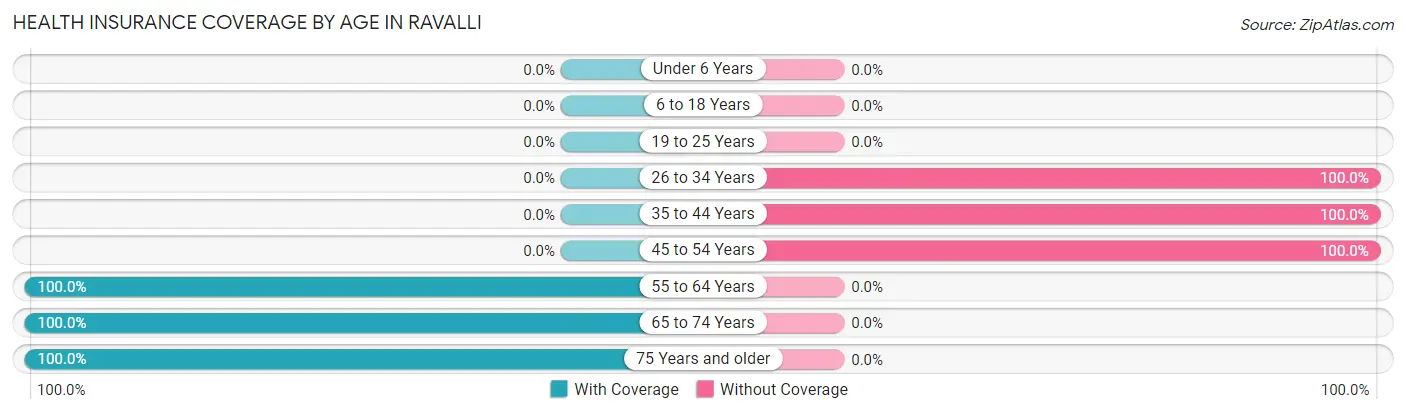
| Age Bracket | With Coverage | Without Coverage |
| Under 6 Years | 0 (0.0%) | 0 (0.0%) |
| 6 to 18 Years | 0 (0.0%) | 0 (0.0%) |
| 19 to 25 Years | 0 (0.0%) | 0 (0.0%) |
| 26 to 34 Years | 0 (0.0%) | 57 (100.0%) |
| 35 to 44 Years | 0 (0.0%) | 47 (100.0%) |
| 45 to 54 Years | 0 (0.0%) | 10 (100.0%) |
| 55 to 64 Years | 19 (100.0%) | 0 (0.0%) |
| 65 to 74 Years | 33 (100.0%) | 0 (0.0%) |
| 75 Years and older | 7 (100.0%) | 0 (0.0%) |
| Total | 59 (34.1%) | 114 (65.9%) |
Health Insurance Coverage by Citizenship Status in Ravalli
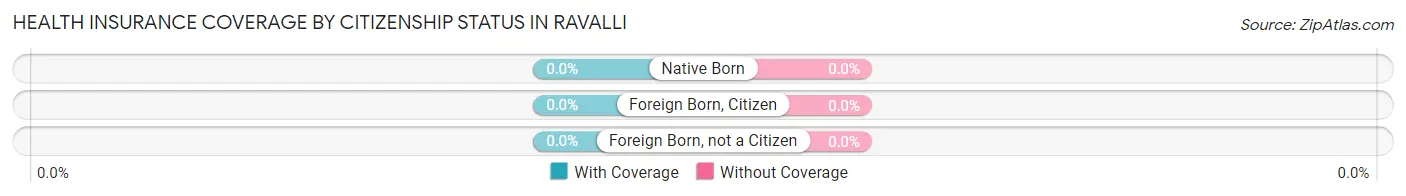
| Citizenship Status | With Coverage | Without Coverage |
| Native Born | 0 (0.0%) | 0 (0.0%) |
| Foreign Born, Citizen | 0 (0.0%) | 0 (0.0%) |
| Foreign Born, not a Citizen | 0 (0.0%) | 0 (0.0%) |
Health Insurance Coverage by Household Income in Ravalli
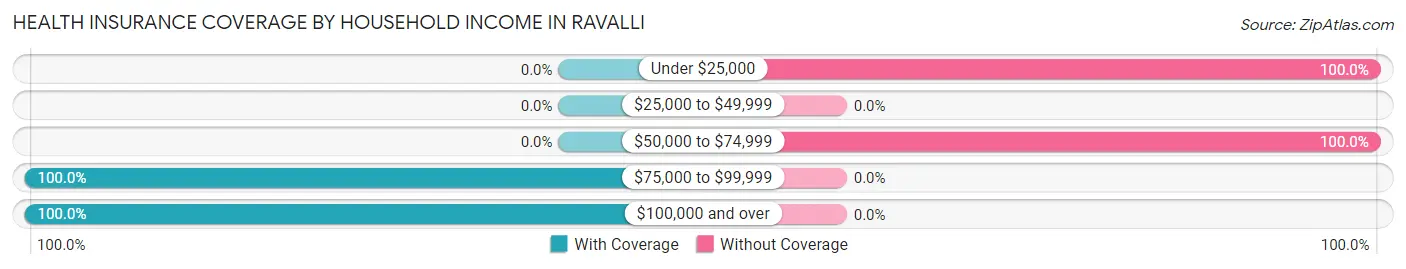
| Household Income | With Coverage | Without Coverage |
| Under $25,000 | 0 (0.0%) | 10 (100.0%) |
| $25,000 to $49,999 | 0 (0.0%) | 0 (0.0%) |
| $50,000 to $74,999 | 0 (0.0%) | 104 (100.0%) |
| $75,000 to $99,999 | 7 (100.0%) | 0 (0.0%) |
| $100,000 and over | 52 (100.0%) | 0 (0.0%) |
Public vs Private Health Insurance Coverage by Age in Ravalli
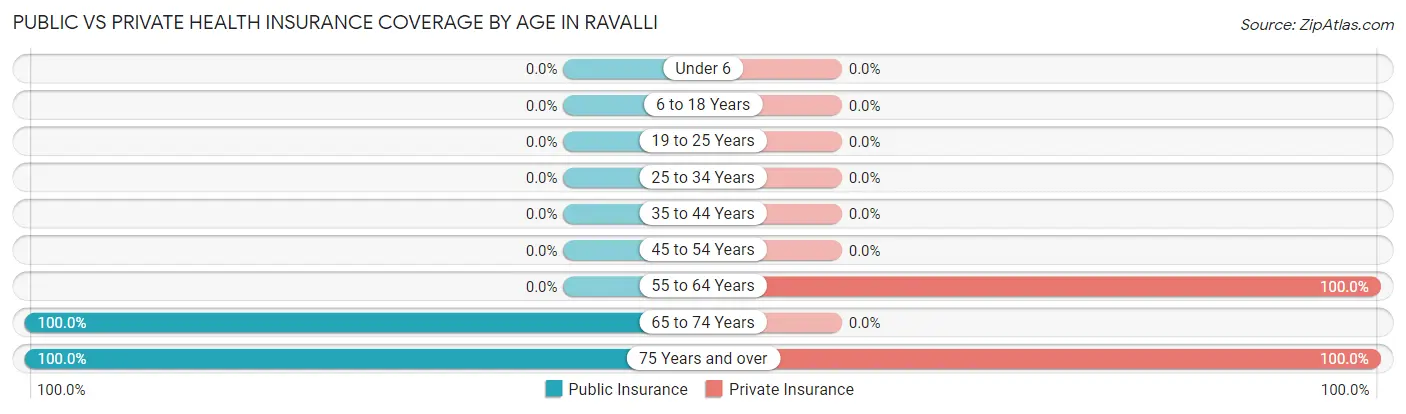
| Age Bracket | Public Insurance | Private Insurance |
| Under 6 | 0 (0.0%) | 0 (0.0%) |
| 6 to 18 Years | 0 (0.0%) | 0 (0.0%) |
| 19 to 25 Years | 0 (0.0%) | 0 (0.0%) |
| 25 to 34 Years | 0 (0.0%) | 0 (0.0%) |
| 35 to 44 Years | 0 (0.0%) | 0 (0.0%) |
| 45 to 54 Years | 0 (0.0%) | 0 (0.0%) |
| 55 to 64 Years | 0 (0.0%) | 19 (100.0%) |
| 65 to 74 Years | 33 (100.0%) | 0 (0.0%) |
| 75 Years and over | 7 (100.0%) | 7 (100.0%) |
| Total | 40 (23.1%) | 26 (15.0%) |
Disability Status by Sex by Age in Ravalli
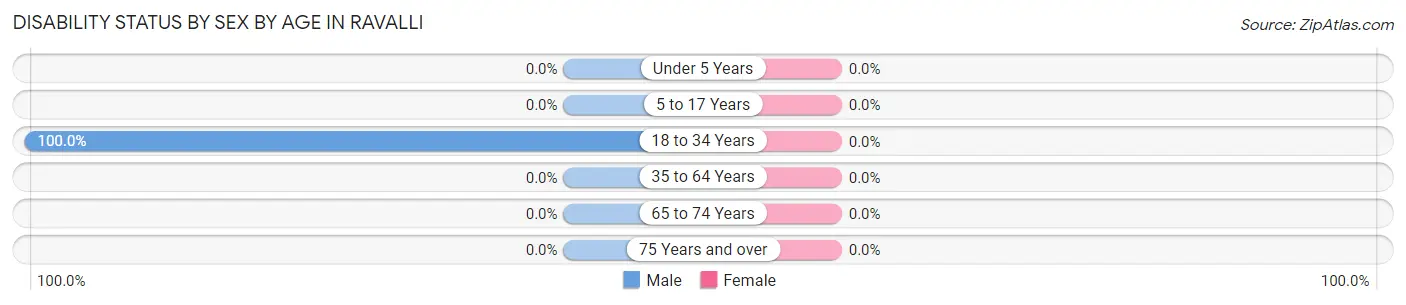
| Age Bracket | Male | Female |
| Under 5 Years | 0 (0.0%) | 0 (0.0%) |
| 5 to 17 Years | 0 (0.0%) | 0 (0.0%) |
| 18 to 34 Years | 57 (100.0%) | 0 (0.0%) |
| 35 to 64 Years | 0 (0.0%) | 0 (0.0%) |
| 65 to 74 Years | 0 (0.0%) | 0 (0.0%) |
| 75 Years and over | 0 (0.0%) | 0 (0.0%) |
Disability Class by Sex by Age in Ravalli
Disability Class: Hearing Difficulty
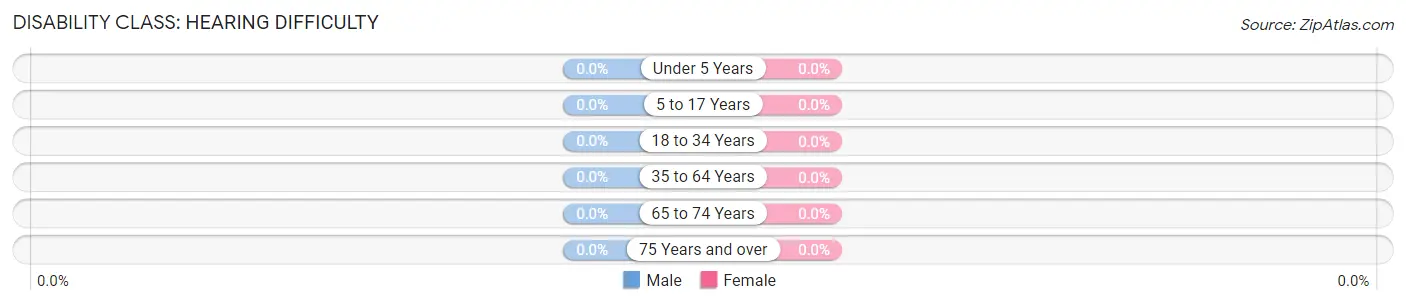
| Age Bracket | Male | Female |
| Under 5 Years | 0 (0.0%) | 0 (0.0%) |
| 5 to 17 Years | 0 (0.0%) | 0 (0.0%) |
| 18 to 34 Years | 0 (0.0%) | 0 (0.0%) |
| 35 to 64 Years | 0 (0.0%) | 0 (0.0%) |
| 65 to 74 Years | 0 (0.0%) | 0 (0.0%) |
| 75 Years and over | 0 (0.0%) | 0 (0.0%) |
Disability Class: Vision Difficulty
| Age Bracket | Male | Female |
| Under 5 Years | 0 (0.0%) | 0 (0.0%) |
| 5 to 17 Years | 0 (0.0%) | 0 (0.0%) |
| 18 to 34 Years | 0 (0.0%) | 0 (0.0%) |
| 35 to 64 Years | 0 (0.0%) | 0 (0.0%) |
| 65 to 74 Years | 0 (0.0%) | 0 (0.0%) |
| 75 Years and over | 0 (0.0%) | 0 (0.0%) |
Disability Class: Cognitive Difficulty
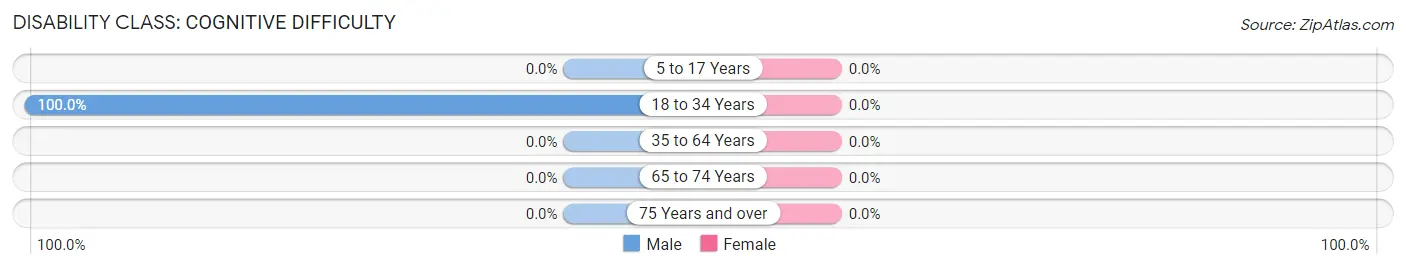
| Age Bracket | Male | Female |
| 5 to 17 Years | 0 (0.0%) | 0 (0.0%) |
| 18 to 34 Years | 57 (100.0%) | 0 (0.0%) |
| 35 to 64 Years | 0 (0.0%) | 0 (0.0%) |
| 65 to 74 Years | 0 (0.0%) | 0 (0.0%) |
| 75 Years and over | 0 (0.0%) | 0 (0.0%) |
Disability Class: Ambulatory Difficulty
| Age Bracket | Male | Female |
| 5 to 17 Years | 0 (0.0%) | 0 (0.0%) |
| 18 to 34 Years | 0 (0.0%) | 0 (0.0%) |
| 35 to 64 Years | 0 (0.0%) | 0 (0.0%) |
| 65 to 74 Years | 0 (0.0%) | 0 (0.0%) |
| 75 Years and over | 0 (0.0%) | 0 (0.0%) |
Disability Class: Self-Care Difficulty
| Age Bracket | Male | Female |
| 5 to 17 Years | 0 (0.0%) | 0 (0.0%) |
| 18 to 34 Years | 0 (0.0%) | 0 (0.0%) |
| 35 to 64 Years | 0 (0.0%) | 0 (0.0%) |
| 65 to 74 Years | 0 (0.0%) | 0 (0.0%) |
| 75 Years and over | 0 (0.0%) | 0 (0.0%) |
Technology Access in Ravalli
Computing Device Access in Ravalli
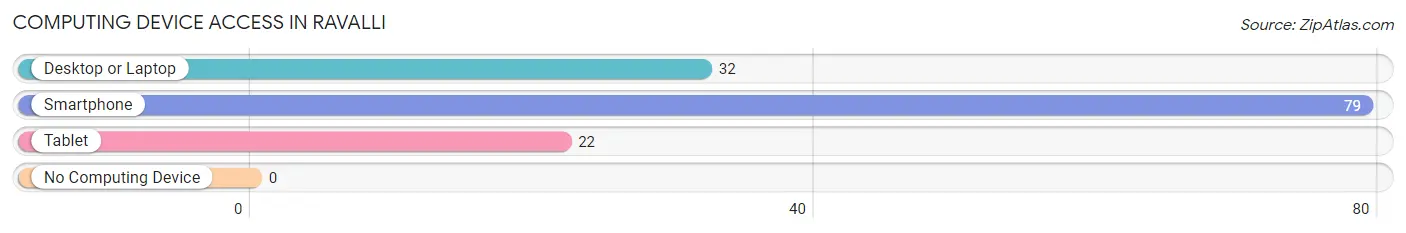
| Device Type | # Households | % Households |
| Desktop or Laptop | 32 | 36.0% |
| Smartphone | 79 | 88.8% |
| Tablet | 22 | 24.7% |
| No Computing Device | 0 | 0.0% |
| Total | 89 | 100.0% |
Internet Access in Ravalli
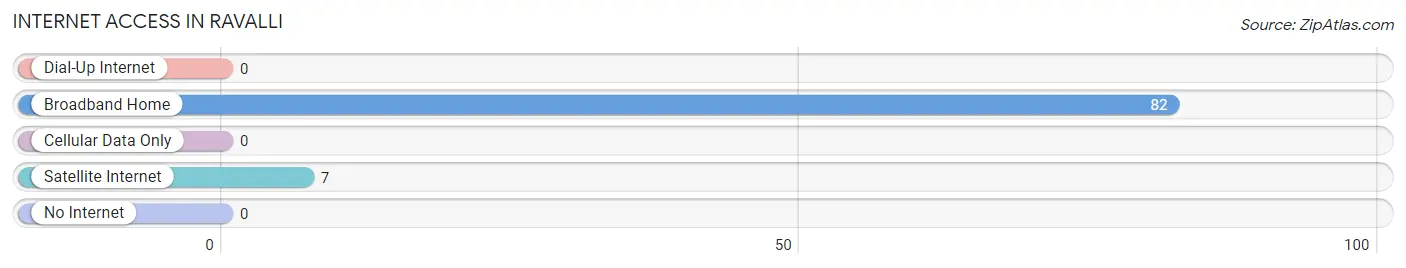
| Internet Type | # Households | % Households |
| Dial-Up Internet | 0 | 0.0% |
| Broadband Home | 82 | 92.1% |
| Cellular Data Only | 0 | 0.0% |
| Satellite Internet | 7 | 7.9% |
| No Internet | 0 | 0.0% |
| Total | 89 | 100.0% |
Ravalli Summary
Ravalli is a county located in the western part of the state of Montana. It is bordered by Missoula County to the north, Sanders County to the east, and Idaho to the west. The county seat is Hamilton, and the largest city is Stevensville. The county was named after Father Anthony Ravalli, an Italian Jesuit missionary who worked in the area in the early 1800s.
History
Ravalli County was established in 1893, and was named after Father Anthony Ravalli, an Italian Jesuit missionary who worked in the area in the early 1800s. The county was originally inhabited by the Salish and Kootenai tribes, who were later joined by the Flathead and Pend d'Oreille tribes. The first settlers in the area were miners and ranchers, who arrived in the late 1800s.
The county was originally part of Missoula County, but was split off in 1893. The county seat was originally located in Stevensville, but was moved to Hamilton in 1895.
Geography
Ravalli County is located in the western part of the state of Montana. It is bordered by Missoula County to the north, Sanders County to the east, and Idaho to the west. The county covers an area of 2,637 square miles, and is the fourth largest county in Montana.
The county is located in the Rocky Mountains, and is home to several mountain ranges, including the Bitterroot Range, the Sapphire Range, and the Garnet Range. The highest point in the county is Trapper Peak, which has an elevation of 10,157 feet.
The county is home to several rivers, including the Bitterroot River, the Clark Fork River, and the Flathead River. The county also contains several lakes, including Flathead Lake, which is the largest natural freshwater lake in the western United States.
Economy
Ravalli County has a diverse economy, with industries ranging from agriculture to tourism. The county is home to several large agricultural operations, including cattle ranches, wheat farms, and fruit orchards. The county is also home to several large timber operations, and is a major producer of lumber and wood products.
Tourism is also an important part of the county's economy. The county is home to several popular tourist attractions, including the Bitterroot National Forest, the Flathead National Forest, and the National Bison Range. The county is also home to several ski resorts, including Lost Trail Powder Mountain and Lookout Pass Ski Area.
Demographics
As of the 2010 census, Ravalli County had a population of 40,212. The county's population was spread out, with 24.3% under the age of 18, 8.2% from 18 to 24, 25.2% from 25 to 44, 28.2% from 45 to 64, and 14.1% who were 65 years of age or older. The median age was 39.4 years.
The county's population was predominantly white, with 91.2% of the population identifying as white, 4.2% as Native American, 1.2% as Asian, 0.7% as African American, and 2.7% as two or more races. The county's Hispanic population was 5.3%.
The median household income in the county was $41,945, and the median family income was $50,945. The county's per capita income was $22,945. About 11.2% of the population was below the poverty line.
Common Questions
What is Per Capita Income in Ravalli?
Per Capita income in Ravalli is $42,786.
What is the Median Household income in Ravalli?
Median Household Income in Ravalli is $74,013.
What is Inequality or Gini Index in Ravalli?
Inequality or Gini Index in Ravalli is 0.23.
What is the Total Population of Ravalli?
Total Population of Ravalli is 173.
What is the Total Male Population of Ravalli?
Total Male Population of Ravalli is 132.
What is the Total Female Population of Ravalli?
Total Female Population of Ravalli is 41.
What is the Ratio of Males per 100 Females in Ravalli?
There are 321.95 Males per 100 Females in Ravalli.
What is the Ratio of Females per 100 Males in Ravalli?
There are 31.06 Females per 100 Males in Ravalli.
What is the Median Population Age in Ravalli?
Median Population Age in Ravalli is 37.6 Years.
What is the Average Family Size in Ravalli
Average Family Size in Ravalli is 2.8 People.
What is the Average Household Size in Ravalli
Average Household Size in Ravalli is 1.9 People.
How Large is the Labor Force in Ravalli?
There are 138 People in the Labor Forcein in Ravalli.
What is the Percentage of People in the Labor Force in Ravalli?
79.8% of People are in the Labor Force in Ravalli.
What is the Unemployment Rate in Ravalli?
Unemployment Rate in Ravalli is 7.2%.