Sylvanite, MT Map & Demographics
Sylvanite Map
Sylvanite Overview
$31,156
PER CAPITA INCOME
$51,042
AVG FAMILY INCOME
$51,979
AVG HOUSEHOLD INCOME
0.28
INEQUALITY / GINI INDEX
112
TOTAL POPULATION
67
MALE POPULATION
45
FEMALE POPULATION
148.89
MALES / 100 FEMALES
67.16
FEMALES / 100 MALES
68.0
MEDIAN AGE
2.2
AVG FAMILY SIZE
2.1
AVG HOUSEHOLD SIZE
31
LABOR FORCE [ PEOPLE ]
27.7%
PERCENT IN LABOR FORCE
Income in Sylvanite
Income Overview in Sylvanite
Per Capita Income in Sylvanite is $31,156, while median incomes of families and households are $51,042 and $51,979 respectively.
| Characteristic | Number | Measure |
| Per Capita Income | 112 | $31,156 |
| Median Family Income | 44 | $51,042 |
| Mean Family Income | 44 | $57,355 |
| Median Household Income | 53 | $51,979 |
| Mean Household Income | 53 | $64,217 |
| Income Deficit | 44 | $0 |
| Wage / Income Gap (%) | 112 | 0.00% |
| Wage / Income Gap ($) | 112 | 100.00¢ per $1 |
| Gini / Inequality Index | 112 | 0.28 |
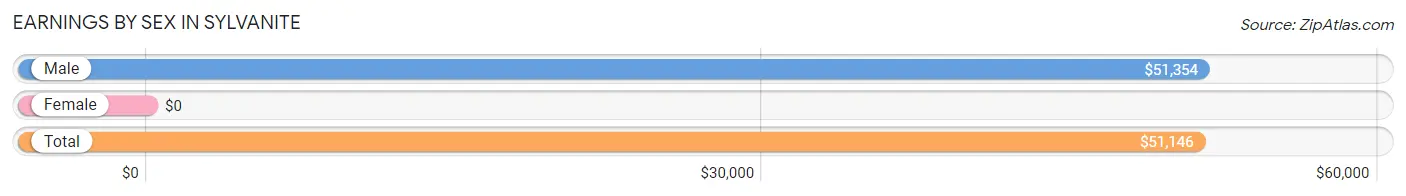
Earnings by Sex in Sylvanite
| Sex | Number | Average Earnings |
| Male | 25 (80.6%) | $51,354 |
| Female | 6 (19.4%) | $0 |
| Total | 31 (100.0%) | $51,146 |
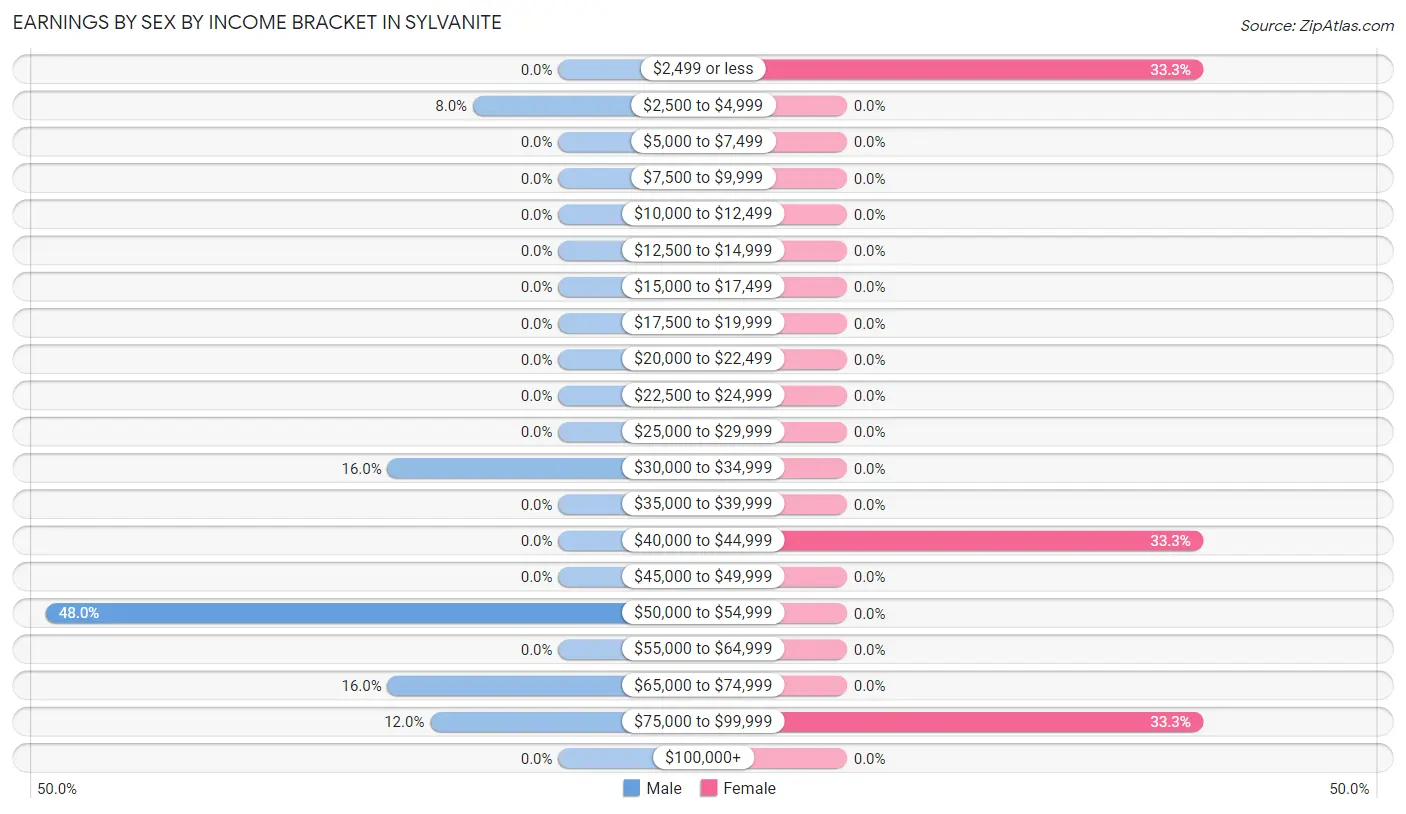
Earnings by Sex by Income Bracket in Sylvanite
The most common earnings brackets in Sylvanite are $50,000 to $54,999 for men (12 | 48.0%) and $2,499 or less for women (2 | 33.3%).
| Income | Male | Female |
| $2,499 or less | 0 (0.0%) | 2 (33.3%) |
| $2,500 to $4,999 | 2 (8.0%) | 0 (0.0%) |
| $5,000 to $7,499 | 0 (0.0%) | 0 (0.0%) |
| $7,500 to $9,999 | 0 (0.0%) | 0 (0.0%) |
| $10,000 to $12,499 | 0 (0.0%) | 0 (0.0%) |
| $12,500 to $14,999 | 0 (0.0%) | 0 (0.0%) |
| $15,000 to $17,499 | 0 (0.0%) | 0 (0.0%) |
| $17,500 to $19,999 | 0 (0.0%) | 0 (0.0%) |
| $20,000 to $22,499 | 0 (0.0%) | 0 (0.0%) |
| $22,500 to $24,999 | 0 (0.0%) | 0 (0.0%) |
| $25,000 to $29,999 | 0 (0.0%) | 0 (0.0%) |
| $30,000 to $34,999 | 4 (16.0%) | 0 (0.0%) |
| $35,000 to $39,999 | 0 (0.0%) | 0 (0.0%) |
| $40,000 to $44,999 | 0 (0.0%) | 2 (33.3%) |
| $45,000 to $49,999 | 0 (0.0%) | 0 (0.0%) |
| $50,000 to $54,999 | 12 (48.0%) | 0 (0.0%) |
| $55,000 to $64,999 | 0 (0.0%) | 0 (0.0%) |
| $65,000 to $74,999 | 4 (16.0%) | 0 (0.0%) |
| $75,000 to $99,999 | 3 (12.0%) | 2 (33.3%) |
| $100,000+ | 0 (0.0%) | 0 (0.0%) |
| Total | 25 (100.0%) | 6 (100.0%) |
Earnings by Sex by Educational Attainment in Sylvanite
| Educational Attainment | Male Income | Female Income |
| Less than High School | - | - |
| High School Diploma | - | - |
| College or Associate's Degree | - | - |
| Bachelor's Degree | - | - |
| Graduate Degree | - | - |
| Total | $51,354 | $0 |
Family Income in Sylvanite
Family Income Brackets in Sylvanite
According to the Sylvanite family income data, there are 17 families falling into the $25,000 to $34,999 income range, which is the most common income bracket and makes up 38.6% of all families.
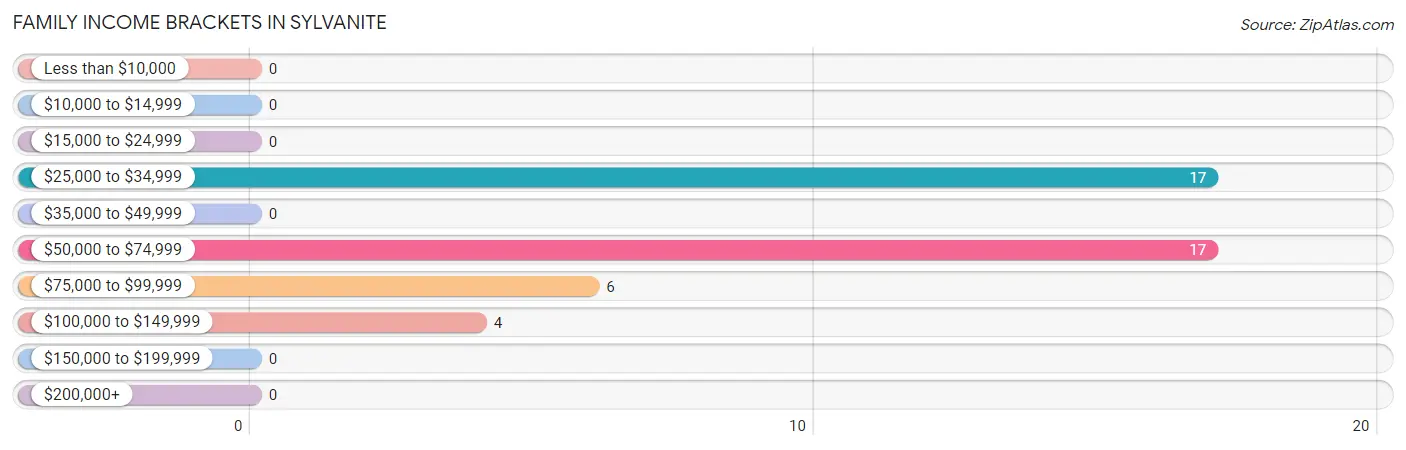
| Income Bracket | # Families | % Families |
| Less than $10,000 | 0 | 0.0% |
| $10,000 to $14,999 | 0 | 0.0% |
| $15,000 to $24,999 | 0 | 0.0% |
| $25,000 to $34,999 | 17 | 38.6% |
| $35,000 to $49,999 | 0 | 0.0% |
| $50,000 to $74,999 | 17 | 38.6% |
| $75,000 to $99,999 | 6 | 13.6% |
| $100,000 to $149,999 | 4 | 9.1% |
| $150,000 to $199,999 | 0 | 0.0% |
| $200,000+ | 0 | 0.0% |
Family Income by Famaliy Size in Sylvanite
2-person families (44 | 100.0%) account for the highest median family income in Sylvanite with $51,042 per family, while 2-person families (44 | 100.0%) have the highest median income of $25,521 per family member.
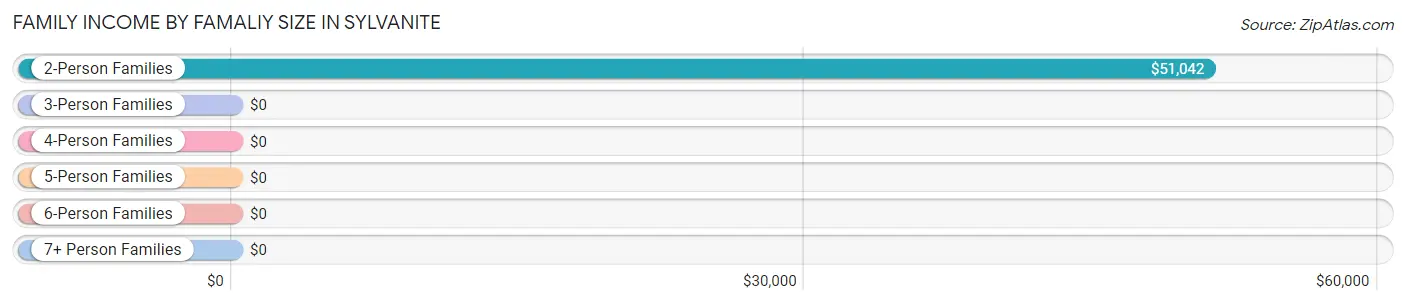
| Income Bracket | # Families | Median Income |
| 2-Person Families | 44 (100.0%) | $51,042 |
| 3-Person Families | 0 (0.0%) | $0 |
| 4-Person Families | 0 (0.0%) | $0 |
| 5-Person Families | 0 (0.0%) | $0 |
| 6-Person Families | 0 (0.0%) | $0 |
| 7+ Person Families | 0 (0.0%) | $0 |
| Total | 44 (100.0%) | $51,042 |
Family Income by Number of Earners in Sylvanite
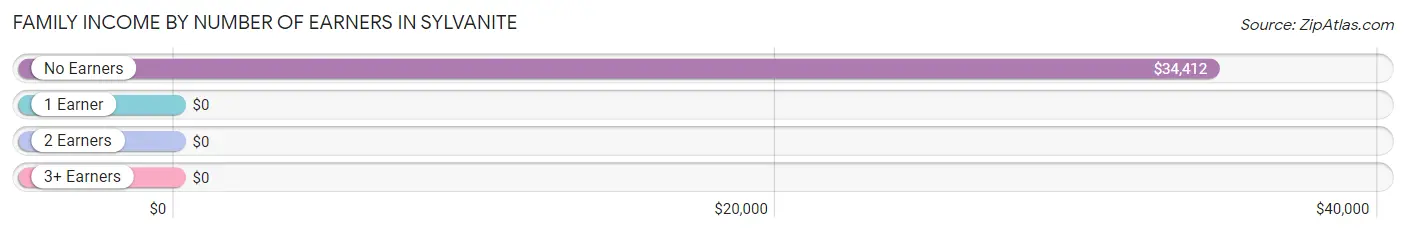
| Number of Earners | # Families | Median Income |
| No Earners | 26 (59.1%) | $34,412 |
| 1 Earner | 15 (34.1%) | $0 |
| 2 Earners | 3 (6.8%) | $0 |
| 3+ Earners | 0 (0.0%) | $0 |
| Total | 44 (100.0%) | $51,042 |
Household Income in Sylvanite
Household Income Brackets in Sylvanite
With 22 households falling in the category, the $50,000 to $74,999 income range is the most frequent in Sylvanite, accounting for 41.5% of all households.
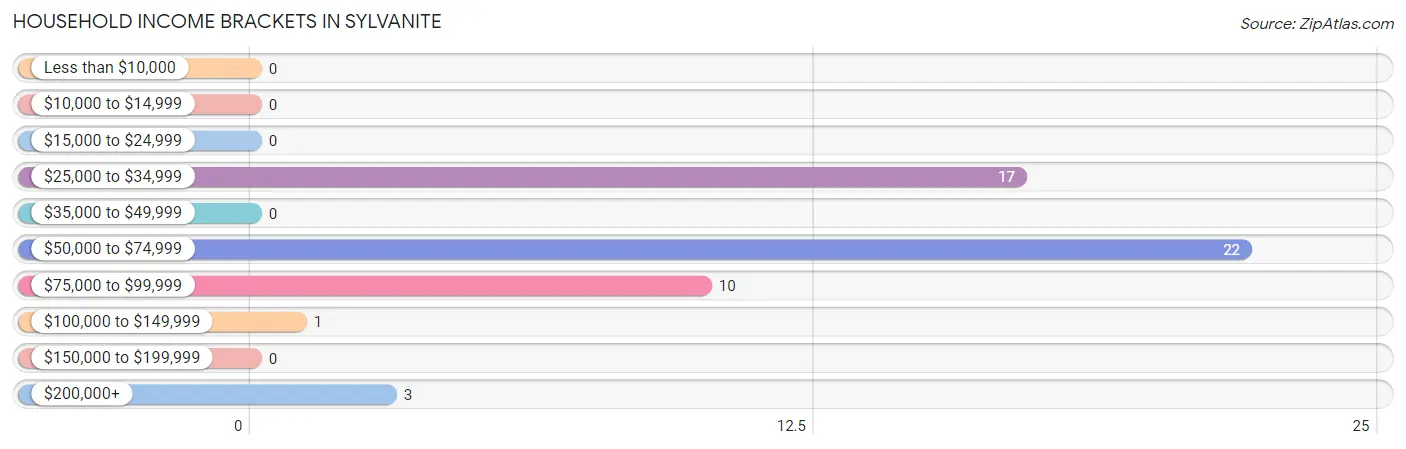
| Income Bracket | # Households | % Households |
| Less than $10,000 | 0 | 0.0% |
| $10,000 to $14,999 | 0 | 0.0% |
| $15,000 to $24,999 | 0 | 0.0% |
| $25,000 to $34,999 | 17 | 32.1% |
| $35,000 to $49,999 | 0 | 0.0% |
| $50,000 to $74,999 | 22 | 41.5% |
| $75,000 to $99,999 | 10 | 18.9% |
| $100,000 to $149,999 | 1 | 1.9% |
| $150,000 to $199,999 | 0 | 0.0% |
| $200,000+ | 3 | 5.7% |
Household Income by Householder Age in Sylvanite
The median household income in Sylvanite is $51,979, with the highest median household income of $70,417 found in the 65+ years age bracket for the primary householder. A total of 31 households (58.5%) fall into this category.
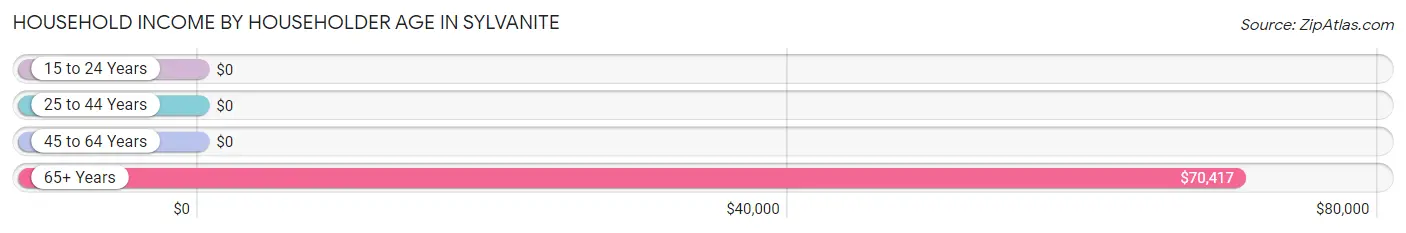
| Income Bracket | # Households | Median Income |
| 15 to 24 Years | 0 (0.0%) | $0 |
| 25 to 44 Years | 3 (5.7%) | $0 |
| 45 to 64 Years | 19 (35.8%) | $0 |
| 65+ Years | 31 (58.5%) | $70,417 |
| Total | 53 (100.0%) | $51,979 |
Poverty in Sylvanite
Income Below Poverty by Sex and Age in Sylvanite
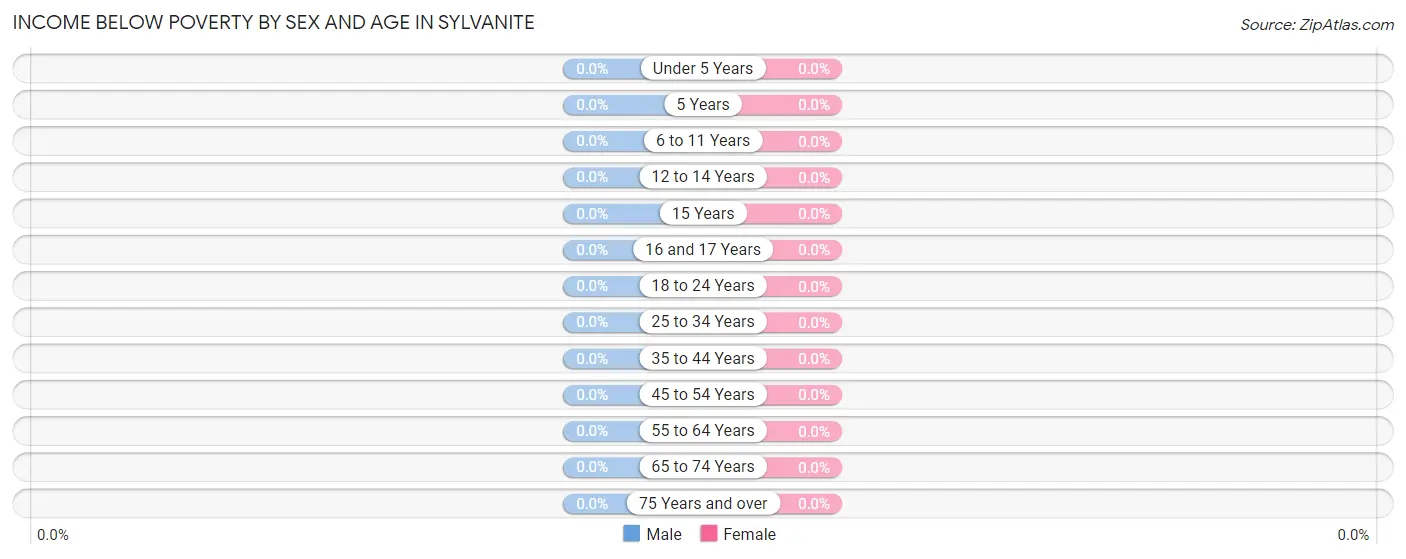
| Age Bracket | Male | Female |
| Under 5 Years | 0 (0.0%) | 0 (0.0%) |
| 5 Years | 0 (0.0%) | 0 (0.0%) |
| 6 to 11 Years | 0 (0.0%) | 0 (0.0%) |
| 12 to 14 Years | 0 (0.0%) | 0 (0.0%) |
| 15 Years | 0 (0.0%) | 0 (0.0%) |
| 16 and 17 Years | 0 (0.0%) | 0 (0.0%) |
| 18 to 24 Years | 0 (0.0%) | 0 (0.0%) |
| 25 to 34 Years | 0 (0.0%) | 0 (0.0%) |
| 35 to 44 Years | 0 (0.0%) | 0 (0.0%) |
| 45 to 54 Years | 0 (0.0%) | 0 (0.0%) |
| 55 to 64 Years | 0 (0.0%) | 0 (0.0%) |
| 65 to 74 Years | 0 (0.0%) | 0 (0.0%) |
| 75 Years and over | 0 (0.0%) | 0 (0.0%) |
| Total | 0 (0.0%) | 0 (0.0%) |
Income Above Poverty by Sex and Age in Sylvanite
According to the poverty statistics in Sylvanite, males aged 25 to 34 years and females aged 25 to 34 years are the age groups that are most secure financially, with 100.0% of males and 100.0% of females in these age groups living above the poverty line.
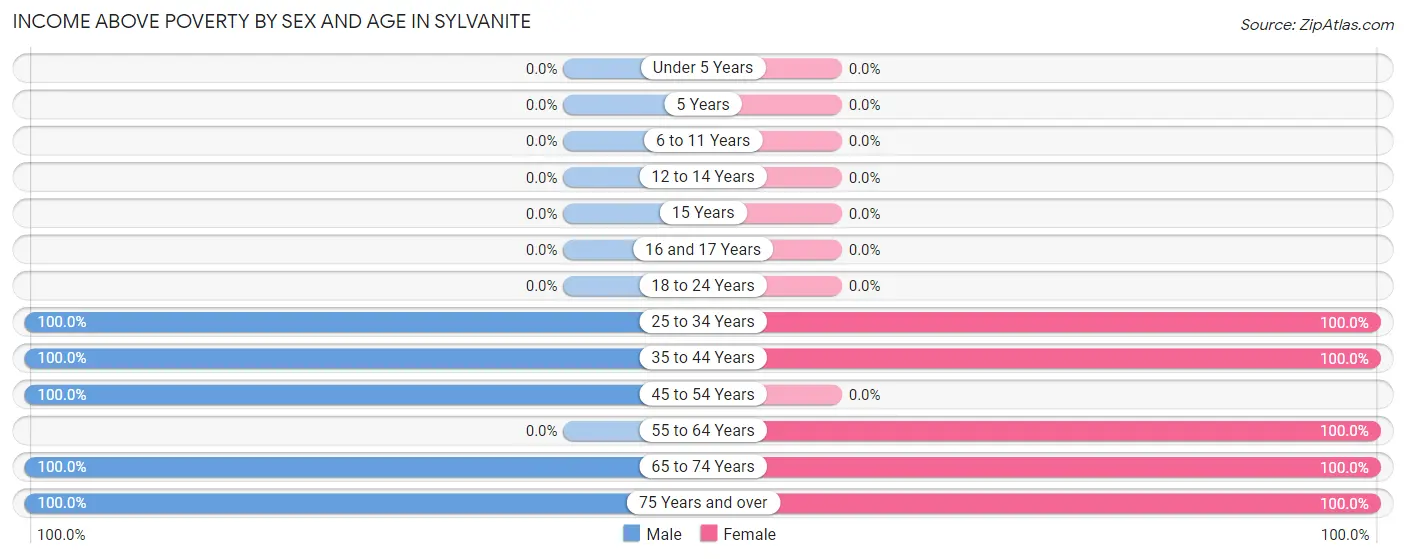
| Age Bracket | Male | Female |
| Under 5 Years | 0 (0.0%) | 0 (0.0%) |
| 5 Years | 0 (0.0%) | 0 (0.0%) |
| 6 to 11 Years | 0 (0.0%) | 0 (0.0%) |
| 12 to 14 Years | 0 (0.0%) | 0 (0.0%) |
| 15 Years | 0 (0.0%) | 0 (0.0%) |
| 16 and 17 Years | 0 (0.0%) | 0 (0.0%) |
| 18 to 24 Years | 0 (0.0%) | 0 (0.0%) |
| 25 to 34 Years | 4 (100.0%) | 2 (100.0%) |
| 35 to 44 Years | 3 (100.0%) | 15 (100.0%) |
| 45 to 54 Years | 12 (100.0%) | 0 (0.0%) |
| 55 to 64 Years | 0 (0.0%) | 7 (100.0%) |
| 65 to 74 Years | 38 (100.0%) | 9 (100.0%) |
| 75 Years and over | 10 (100.0%) | 12 (100.0%) |
| Total | 67 (100.0%) | 45 (100.0%) |
Income Below Poverty Among Married-Couple Families in Sylvanite
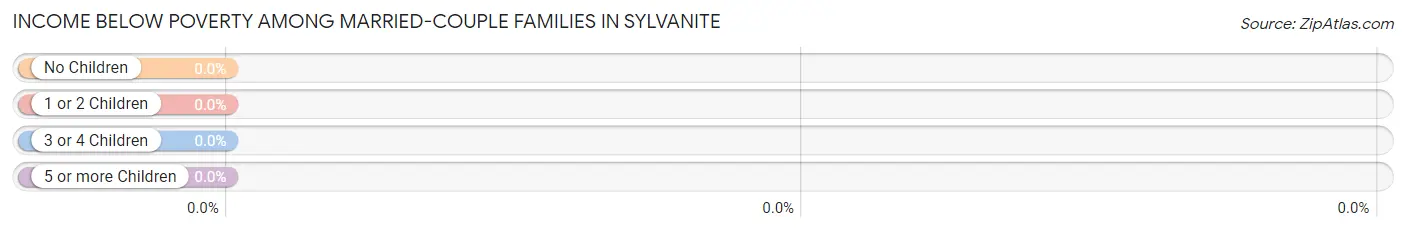
| Children | Above Poverty | Below Poverty |
| No Children | 41 (100.0%) | 0 (0.0%) |
| 1 or 2 Children | 0 (0.0%) | 0 (0.0%) |
| 3 or 4 Children | 0 (0.0%) | 0 (0.0%) |
| 5 or more Children | 0 (0.0%) | 0 (0.0%) |
| Total | 41 (100.0%) | 0 (0.0%) |
Income Below Poverty Among Single-Parent Households in Sylvanite
| Children | Single Father | Single Mother |
| No Children | 0 (0.0%) | 0 (0.0%) |
| 1 or 2 Children | 0 (0.0%) | 0 (0.0%) |
| 3 or 4 Children | 0 (0.0%) | 0 (0.0%) |
| 5 or more Children | 0 (0.0%) | 0 (0.0%) |
| Total | 0 (0.0%) | 0 (0.0%) |
Income Below Poverty Among Married-Couple vs Single-Parent Households in Sylvanite
| Children | Married-Couple Families | Single-Parent Households |
| No Children | 0 (0.0%) | 0 (0.0%) |
| 1 or 2 Children | 0 (0.0%) | 0 (0.0%) |
| 3 or 4 Children | 0 (0.0%) | 0 (0.0%) |
| 5 or more Children | 0 (0.0%) | 0 (0.0%) |
| Total | 0 (0.0%) | 0 (0.0%) |
Race in Sylvanite
The most populous races in Sylvanite are White / Caucasian (95 | 84.8%), Two or more Races (9 | 8.0%), and Asian (4 | 3.6%).
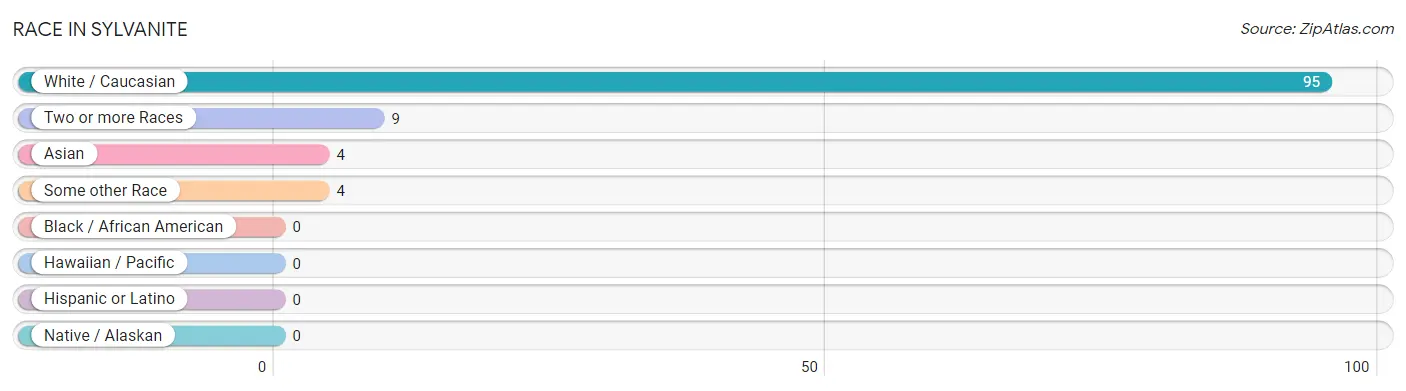
| Race | # Population | % Population |
| Asian | 4 | 3.6% |
| Black / African American | 0 | 0.0% |
| Hawaiian / Pacific | 0 | 0.0% |
| Hispanic or Latino | 0 | 0.0% |
| Native / Alaskan | 0 | 0.0% |
| White / Caucasian | 95 | 84.8% |
| Two or more Races | 9 | 8.0% |
| Some other Race | 4 | 3.6% |
| Total | 112 | 100.0% |
Ancestry in Sylvanite
The most populous ancestries reported in Sylvanite are German (56 | 50.0%), Irish (26 | 23.2%), Portuguese (12 | 10.7%), Italian (10 | 8.9%), and Scotch-Irish (10 | 8.9%), together accounting for 101.8% of all Sylvanite residents.
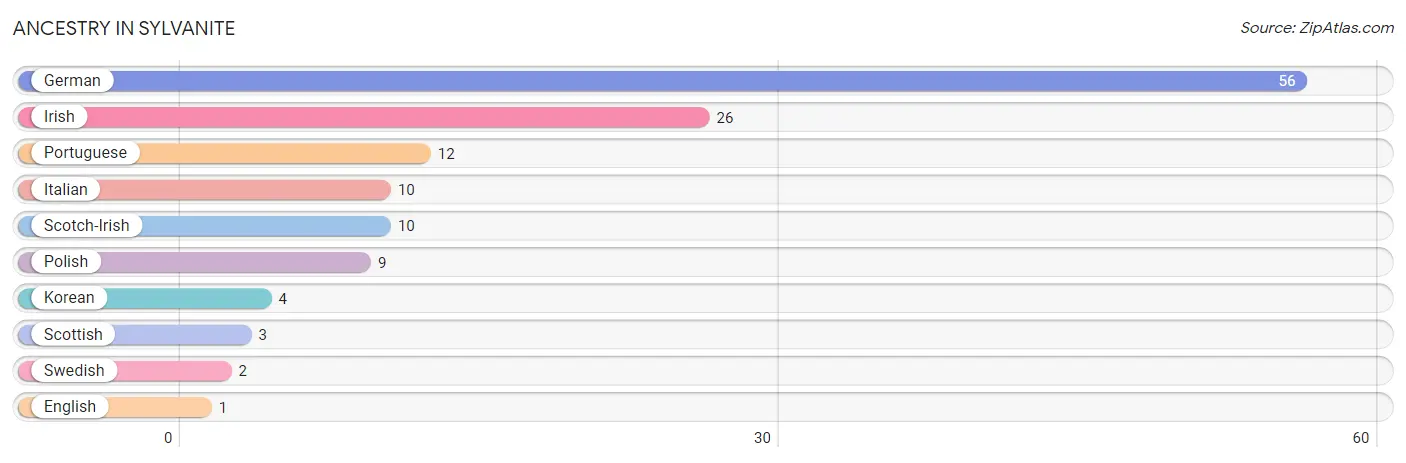
| Ancestry | # Population | % Population |
| English | 1 | 0.9% |
| German | 56 | 50.0% |
| Irish | 26 | 23.2% |
| Italian | 10 | 8.9% |
| Korean | 4 | 3.6% |
| Polish | 9 | 8.0% |
| Portuguese | 12 | 10.7% |
| Scotch-Irish | 10 | 8.9% |
| Scottish | 3 | 2.7% |
| Swedish | 2 | 1.8% | View All 10 Rows |
Immigrants in Sylvanite
The most numerous immigrant groups reported in Sylvanite came from Asia (4 | 3.6%), Philippines (4 | 3.6%), and South Eastern Asia (4 | 3.6%), together accounting for 10.7% of all Sylvanite residents.
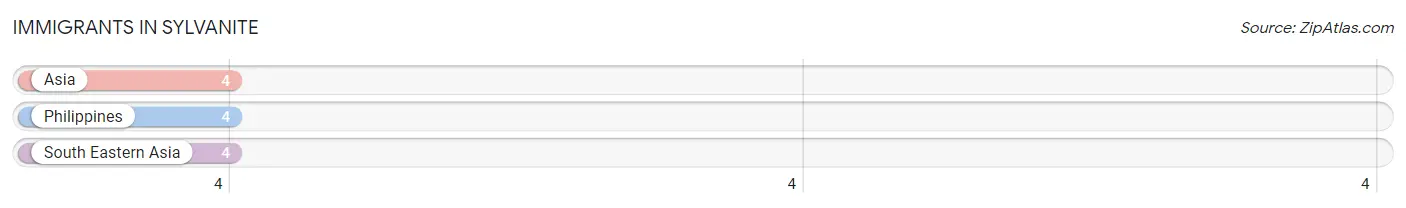
| Immigration Origin | # Population | % Population |
| Asia | 4 | 3.6% |
| Philippines | 4 | 3.6% |
| South Eastern Asia | 4 | 3.6% | View All 3 Rows |
Sex and Age in Sylvanite
Sex and Age in Sylvanite
The most populous age groups in Sylvanite are 70 to 74 Years (29 | 43.3%) for men and 40 to 44 Years (15 | 33.3%) for women.
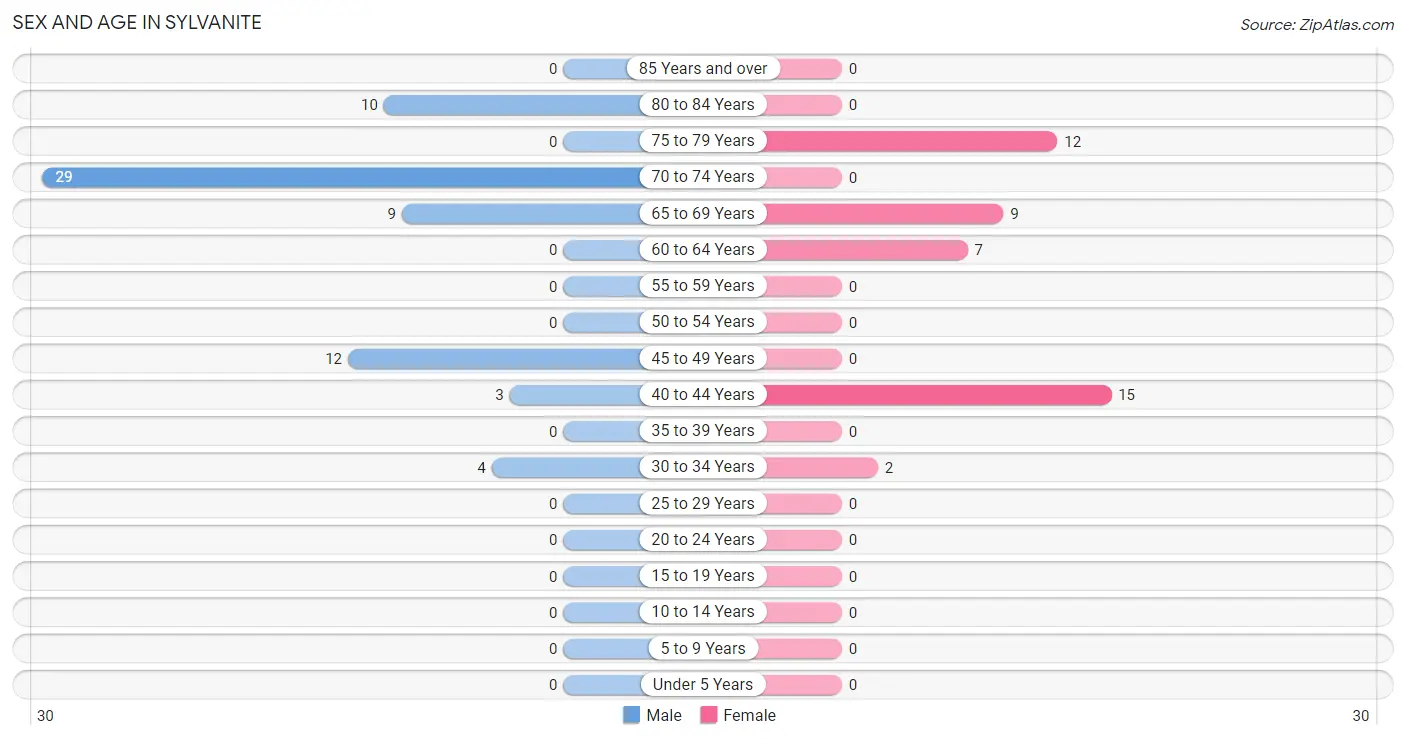
| Age Bracket | Male | Female |
| Under 5 Years | 0 (0.0%) | 0 (0.0%) |
| 5 to 9 Years | 0 (0.0%) | 0 (0.0%) |
| 10 to 14 Years | 0 (0.0%) | 0 (0.0%) |
| 15 to 19 Years | 0 (0.0%) | 0 (0.0%) |
| 20 to 24 Years | 0 (0.0%) | 0 (0.0%) |
| 25 to 29 Years | 0 (0.0%) | 0 (0.0%) |
| 30 to 34 Years | 4 (6.0%) | 2 (4.4%) |
| 35 to 39 Years | 0 (0.0%) | 0 (0.0%) |
| 40 to 44 Years | 3 (4.5%) | 15 (33.3%) |
| 45 to 49 Years | 12 (17.9%) | 0 (0.0%) |
| 50 to 54 Years | 0 (0.0%) | 0 (0.0%) |
| 55 to 59 Years | 0 (0.0%) | 0 (0.0%) |
| 60 to 64 Years | 0 (0.0%) | 7 (15.6%) |
| 65 to 69 Years | 9 (13.4%) | 9 (20.0%) |
| 70 to 74 Years | 29 (43.3%) | 0 (0.0%) |
| 75 to 79 Years | 0 (0.0%) | 12 (26.7%) |
| 80 to 84 Years | 10 (14.9%) | 0 (0.0%) |
| 85 Years and over | 0 (0.0%) | 0 (0.0%) |
| Total | 67 (100.0%) | 45 (100.0%) |
Families and Households in Sylvanite
Median Family Size in Sylvanite
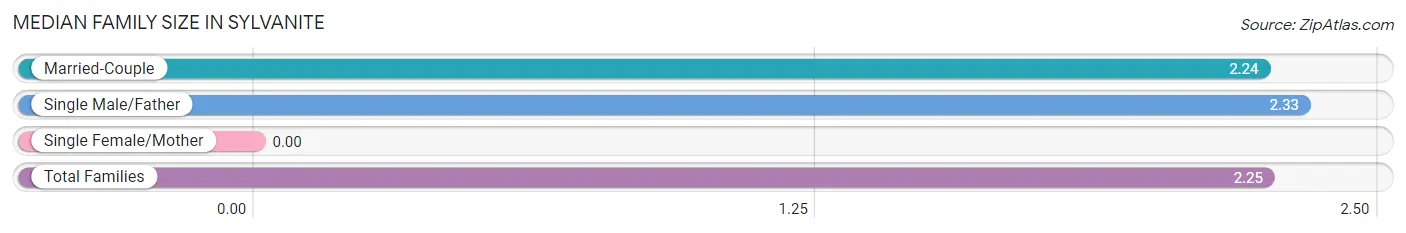
| Family Type | # Families | Family Size |
| Married-Couple | 41 (93.2%) | 2.24 |
| Single Male/Father | 3 (6.8%) | 2.33 |
| Single Female/Mother | 0 (0.0%) | - |
| Total Families | 44 (100.0%) | 2.25 |
Median Household Size in Sylvanite
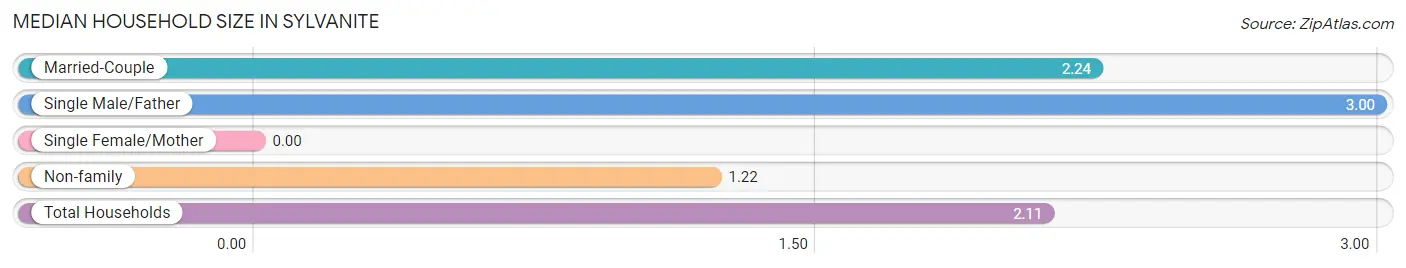
| Household Type | # Households | Household Size |
| Married-Couple | 41 (77.4%) | 2.24 |
| Single Male/Father | 3 (5.7%) | 3.00 |
| Single Female/Mother | 0 (0.0%) | - |
| Non-family | 9 (17.0%) | 1.22 |
| Total Households | 53 (100.0%) | 2.11 |
Household Size by Marriage Status in Sylvanite
Out of a total of 53 households in Sylvanite, 44 (83.0%) are family households, while 9 (17.0%) are nonfamily households. The most numerous type of family households are 2-person households, comprising 41, and the most common type of nonfamily households are 1-person households, comprising 7.
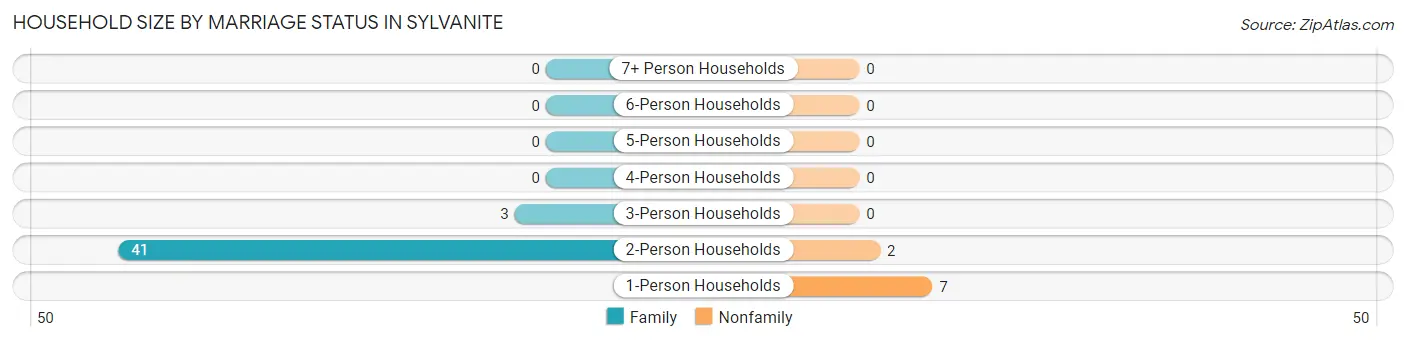
| Household Size | Family Households | Nonfamily Households |
| 1-Person Households | - | 7 (13.2%) |
| 2-Person Households | 41 (77.4%) | 2 (3.8%) |
| 3-Person Households | 3 (5.7%) | 0 (0.0%) |
| 4-Person Households | 0 (0.0%) | 0 (0.0%) |
| 5-Person Households | 0 (0.0%) | 0 (0.0%) |
| 6-Person Households | 0 (0.0%) | 0 (0.0%) |
| 7+ Person Households | 0 (0.0%) | 0 (0.0%) |
| Total | 44 (83.0%) | 9 (17.0%) |
Female Fertility in Sylvanite
Fertility by Age in Sylvanite
| Age Bracket | Women with Births | Births / 1,000 Women |
| 15 to 19 years | 0 (0.0%) | 0.0 |
| 20 to 34 years | 0 (0.0%) | 0.0 |
| 35 to 50 years | 0 (0.0%) | 0.0 |
| Total | 0 (0.0%) | 0.0 |
Fertility by Age by Marriage Status in Sylvanite
| Age Bracket | Married | Unmarried |
| 15 to 19 years | 0 (0.0%) | 0 (0.0%) |
| 20 to 34 years | 0 (0.0%) | 0 (0.0%) |
| 35 to 50 years | 0 (0.0%) | 0 (0.0%) |
| Total | 0 (0.0%) | 0 (0.0%) |
Fertility by Education in Sylvanite
| Educational Attainment | Women with Births | Births / 1,000 Women |
| Less than High School | 0 (0.0%) | 0.0 |
| High School Diploma | 0 (0.0%) | 0.0 |
| College or Associate's Degree | 0 (0.0%) | 0.0 |
| Bachelor's Degree | 0 (0.0%) | 0.0 |
| Graduate Degree | 0 (0.0%) | 0.0 |
| Total | 0 (0.0%) | 0.0 |
Fertility by Education by Marriage Status in Sylvanite
| Educational Attainment | Married | Unmarried |
| Less than High School | 0 (0.0%) | 0 (0.0%) |
| High School Diploma | 0 (0.0%) | 0 (0.0%) |
| College or Associate's Degree | 0 (0.0%) | 0 (0.0%) |
| Bachelor's Degree | 0 (0.0%) | 0 (0.0%) |
| Graduate Degree | 0 (0.0%) | 0 (0.0%) |
| Total | 0 (0.0%) | 0 (0.0%) |
Employment Characteristics in Sylvanite
Employment by Class of Employer in Sylvanite
Among the 25 employed individuals in Sylvanite, federal government employees (12 | 48.0%), private company employees (7 | 28.0%), and self-employed (incorporated) (4 | 16.0%) make up the most common classes of employment.
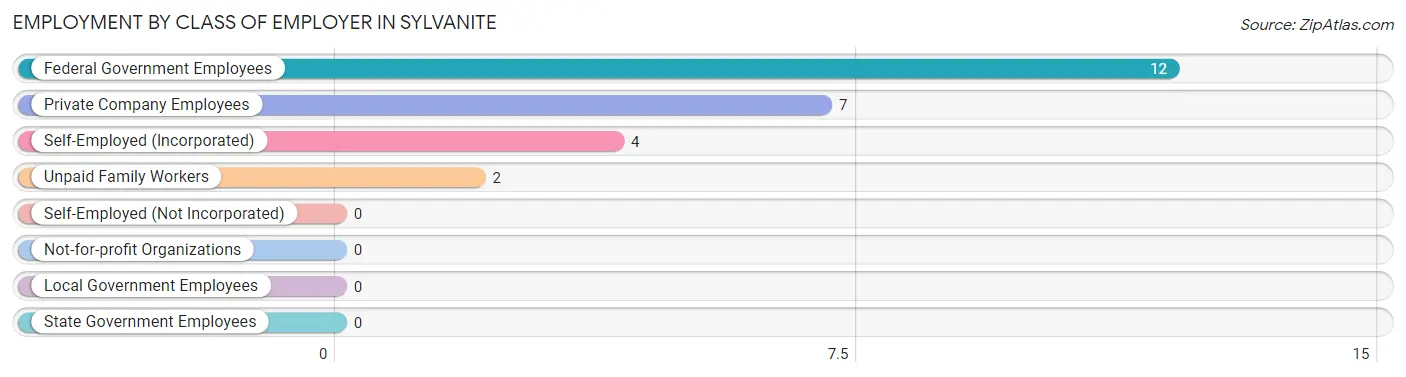
| Employer Class | # Employees | % Employees |
| Private Company Employees | 7 | 28.0% |
| Self-Employed (Incorporated) | 4 | 16.0% |
| Self-Employed (Not Incorporated) | 0 | 0.0% |
| Not-for-profit Organizations | 0 | 0.0% |
| Local Government Employees | 0 | 0.0% |
| State Government Employees | 0 | 0.0% |
| Federal Government Employees | 12 | 48.0% |
| Unpaid Family Workers | 2 | 8.0% |
| Total | 25 | 100.0% |
Employment Status by Age in Sylvanite
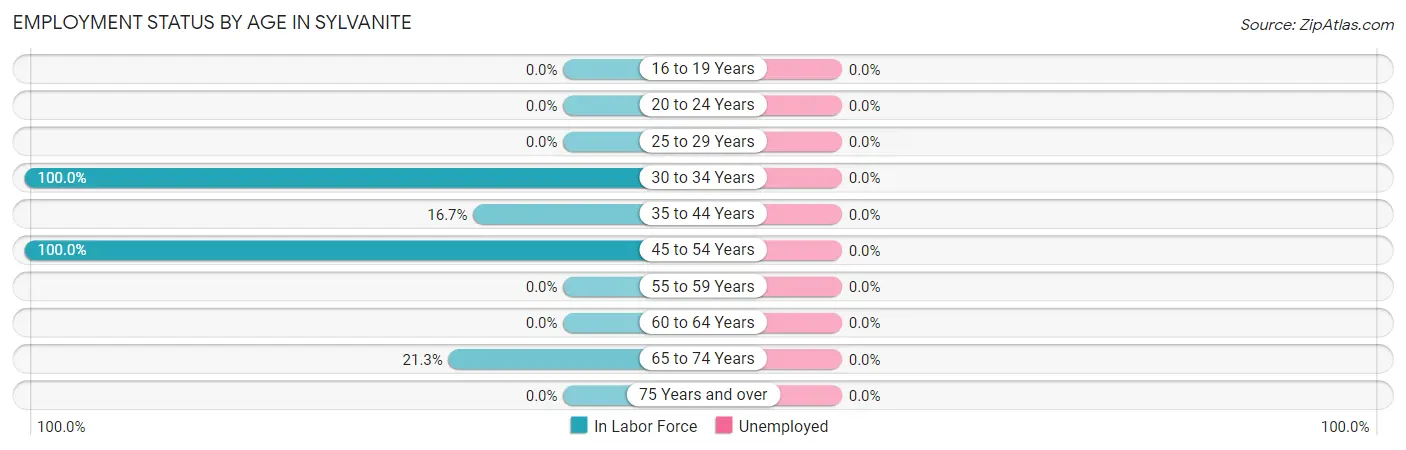
| Age Bracket | In Labor Force | Unemployed |
| 16 to 19 Years | 0 (0.0%) | 0 (0.0%) |
| 20 to 24 Years | 0 (0.0%) | 0 (0.0%) |
| 25 to 29 Years | 0 (0.0%) | 0 (0.0%) |
| 30 to 34 Years | 6 (100.0%) | 0 (0.0%) |
| 35 to 44 Years | 3 (16.7%) | 0 (0.0%) |
| 45 to 54 Years | 12 (100.0%) | 0 (0.0%) |
| 55 to 59 Years | 0 (0.0%) | 0 (0.0%) |
| 60 to 64 Years | 0 (0.0%) | 0 (0.0%) |
| 65 to 74 Years | 10 (21.3%) | 0 (0.0%) |
| 75 Years and over | 0 (0.0%) | 0 (0.0%) |
| Total | 31 (27.7%) | 0 (0.0%) |
Employment Status by Educational Attainment in Sylvanite
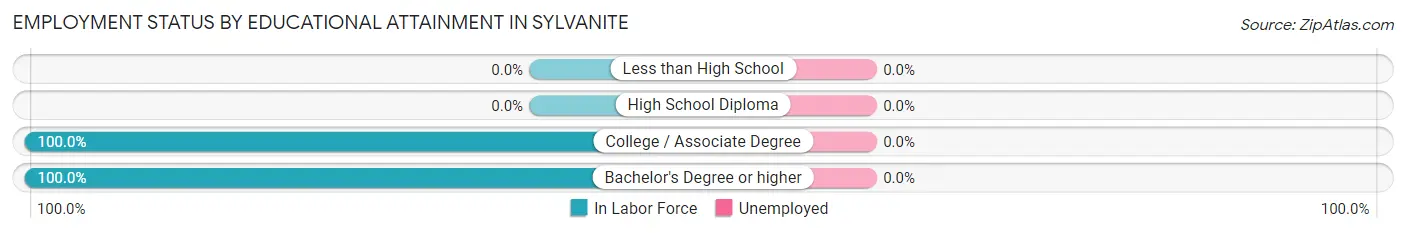
| Educational Attainment | In Labor Force | Unemployed |
| Less than High School | 0 (0.0%) | 0 (0.0%) |
| High School Diploma | 0 (0.0%) | 0 (0.0%) |
| College / Associate Degree | 4 (100.0%) | 0 (0.0%) |
| Bachelor's Degree or higher | 17 (100.0%) | 0 (0.0%) |
| Total | 21 (48.8%) | 0 (0.0%) |
Employment Occupations by Sex in Sylvanite
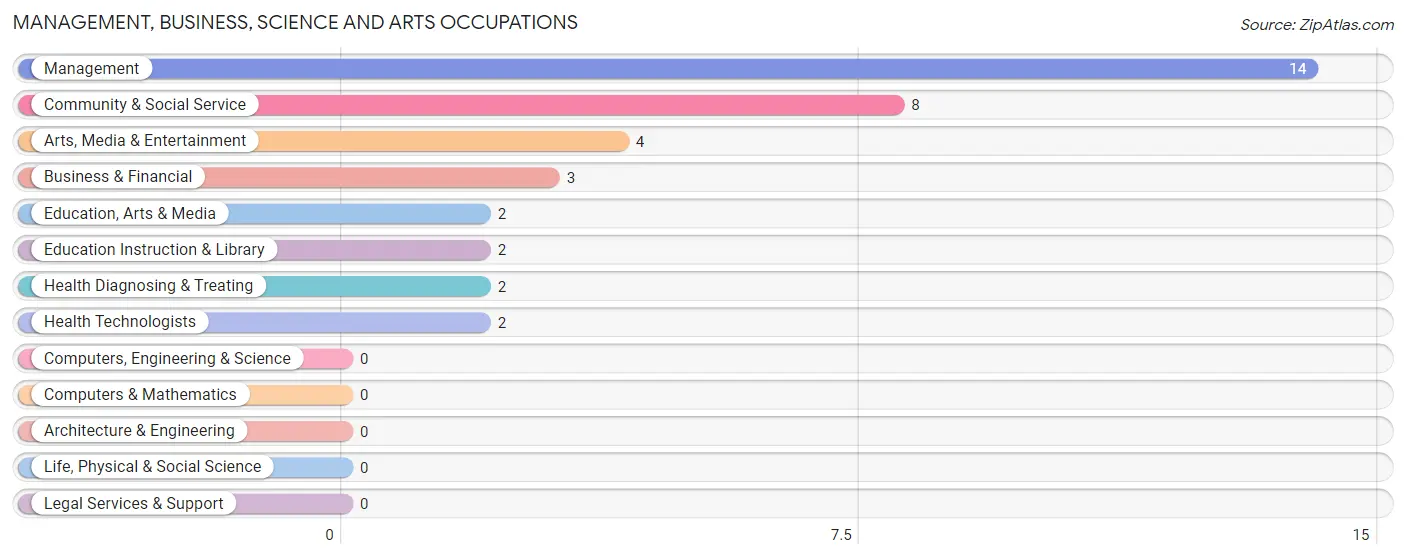
Management, Business, Science and Arts Occupations
The most common Management, Business, Science and Arts occupations in Sylvanite are Management (14 | 45.2%), Community & Social Service (8 | 25.8%), Arts, Media & Entertainment (4 | 12.9%), Business & Financial (3 | 9.7%), and Education, Arts & Media (2 | 6.5%).
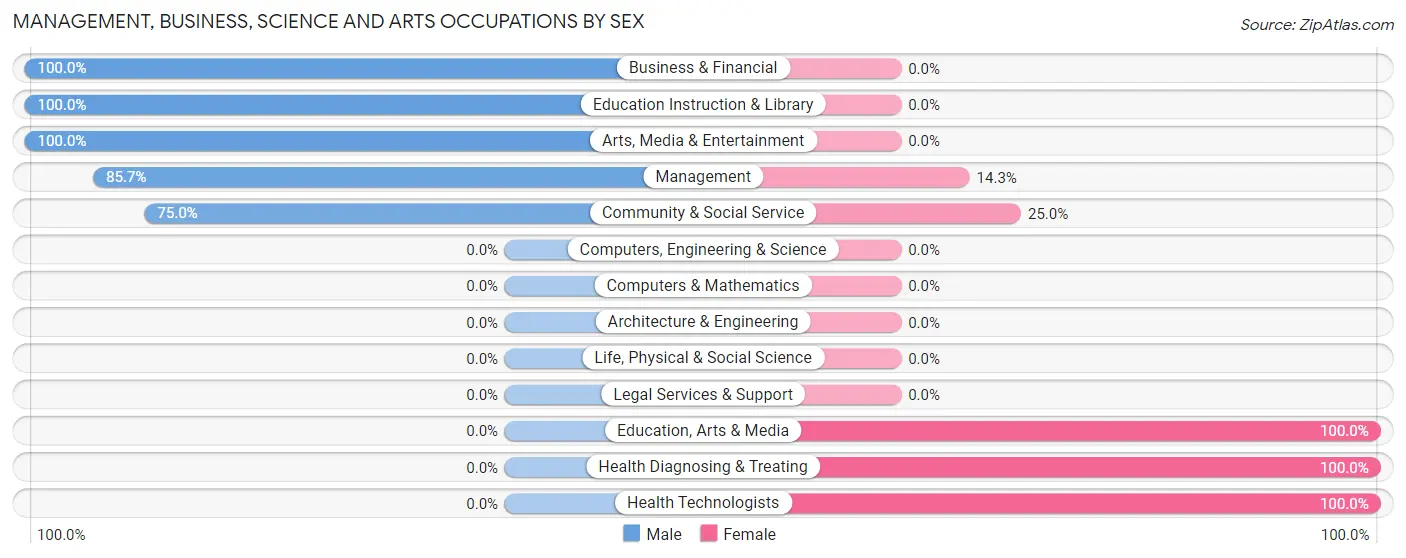
Management, Business, Science and Arts Occupations by Sex
Within the Management, Business, Science and Arts occupations in Sylvanite, the most male-oriented occupations are Business & Financial (100.0%), Education Instruction & Library (100.0%), and Arts, Media & Entertainment (100.0%), while the most female-oriented occupations are Education, Arts & Media (100.0%), Health Diagnosing & Treating (100.0%), and Health Technologists (100.0%).
| Occupation | Male | Female |
| Management | 12 (85.7%) | 2 (14.3%) |
| Business & Financial | 3 (100.0%) | 0 (0.0%) |
| Computers, Engineering & Science | 0 (0.0%) | 0 (0.0%) |
| Computers & Mathematics | 0 (0.0%) | 0 (0.0%) |
| Architecture & Engineering | 0 (0.0%) | 0 (0.0%) |
| Life, Physical & Social Science | 0 (0.0%) | 0 (0.0%) |
| Community & Social Service | 6 (75.0%) | 2 (25.0%) |
| Education, Arts & Media | 0 (0.0%) | 2 (100.0%) |
| Legal Services & Support | 0 (0.0%) | 0 (0.0%) |
| Education Instruction & Library | 2 (100.0%) | 0 (0.0%) |
| Arts, Media & Entertainment | 4 (100.0%) | 0 (0.0%) |
| Health Diagnosing & Treating | 0 (0.0%) | 2 (100.0%) |
| Health Technologists | 0 (0.0%) | 2 (100.0%) |
| Total (Category) | 21 (77.8%) | 6 (22.2%) |
| Total (Overall) | 25 (80.6%) | 6 (19.4%) |
Services Occupations
Services Occupations by Sex
| Occupation | Male | Female |
| Healthcare Support | 0 (0.0%) | 0 (0.0%) |
| Security & Protection | 0 (0.0%) | 0 (0.0%) |
| Firefighting & Prevention | 0 (0.0%) | 0 (0.0%) |
| Law Enforcement | 0 (0.0%) | 0 (0.0%) |
| Food Preparation & Serving | 0 (0.0%) | 0 (0.0%) |
| Cleaning & Maintenance | 0 (0.0%) | 0 (0.0%) |
| Personal Care & Service | 0 (0.0%) | 0 (0.0%) |
| Total (Category) | 0 (0.0%) | 0 (0.0%) |
| Total (Overall) | 25 (80.6%) | 6 (19.4%) |
Sales and Office Occupations
Sales and Office Occupations by Sex
| Occupation | Male | Female |
| Sales & Related | 0 (0.0%) | 0 (0.0%) |
| Office & Administration | 0 (0.0%) | 0 (0.0%) |
| Total (Category) | 0 (0.0%) | 0 (0.0%) |
| Total (Overall) | 25 (80.6%) | 6 (19.4%) |
Natural Resources, Construction and Maintenance Occupations
The most common Natural Resources, Construction and Maintenance occupations in Sylvanite are , and Installation, Maintenance & Repair (4 | 12.9%).
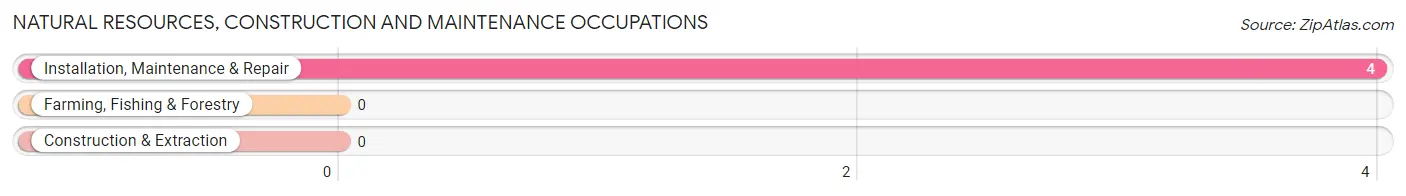
Natural Resources, Construction and Maintenance Occupations by Sex
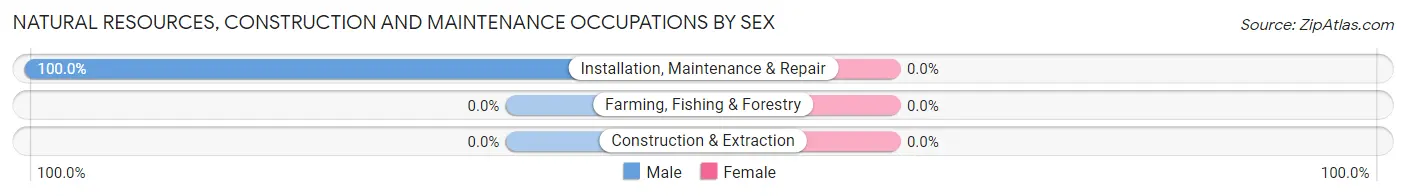
| Occupation | Male | Female |
| Farming, Fishing & Forestry | 0 (0.0%) | 0 (0.0%) |
| Construction & Extraction | 0 (0.0%) | 0 (0.0%) |
| Installation, Maintenance & Repair | 4 (100.0%) | 0 (0.0%) |
| Total (Category) | 4 (100.0%) | 0 (0.0%) |
| Total (Overall) | 25 (80.6%) | 6 (19.4%) |
Production, Transportation and Moving Occupations
Production, Transportation and Moving Occupations by Sex
| Occupation | Male | Female |
| Production | 0 (0.0%) | 0 (0.0%) |
| Transportation | 0 (0.0%) | 0 (0.0%) |
| Material Moving | 0 (0.0%) | 0 (0.0%) |
| Total (Category) | 0 (0.0%) | 0 (0.0%) |
| Total (Overall) | 25 (80.6%) | 6 (19.4%) |
Employment Industries by Sex in Sylvanite
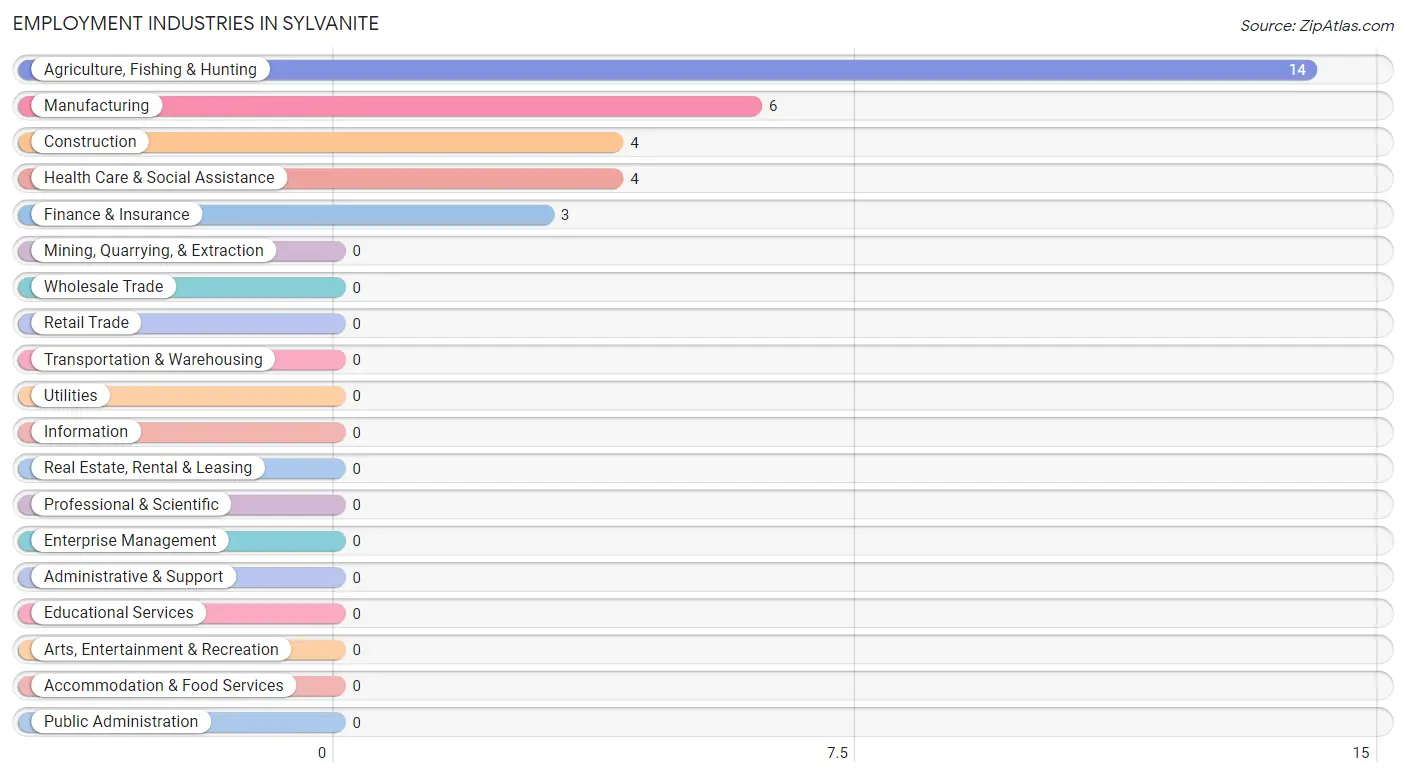
Employment Industries in Sylvanite
The major employment industries in Sylvanite include Agriculture, Fishing & Hunting (14 | 45.2%), Manufacturing (6 | 19.4%), Construction (4 | 12.9%), Health Care & Social Assistance (4 | 12.9%), and Finance & Insurance (3 | 9.7%).
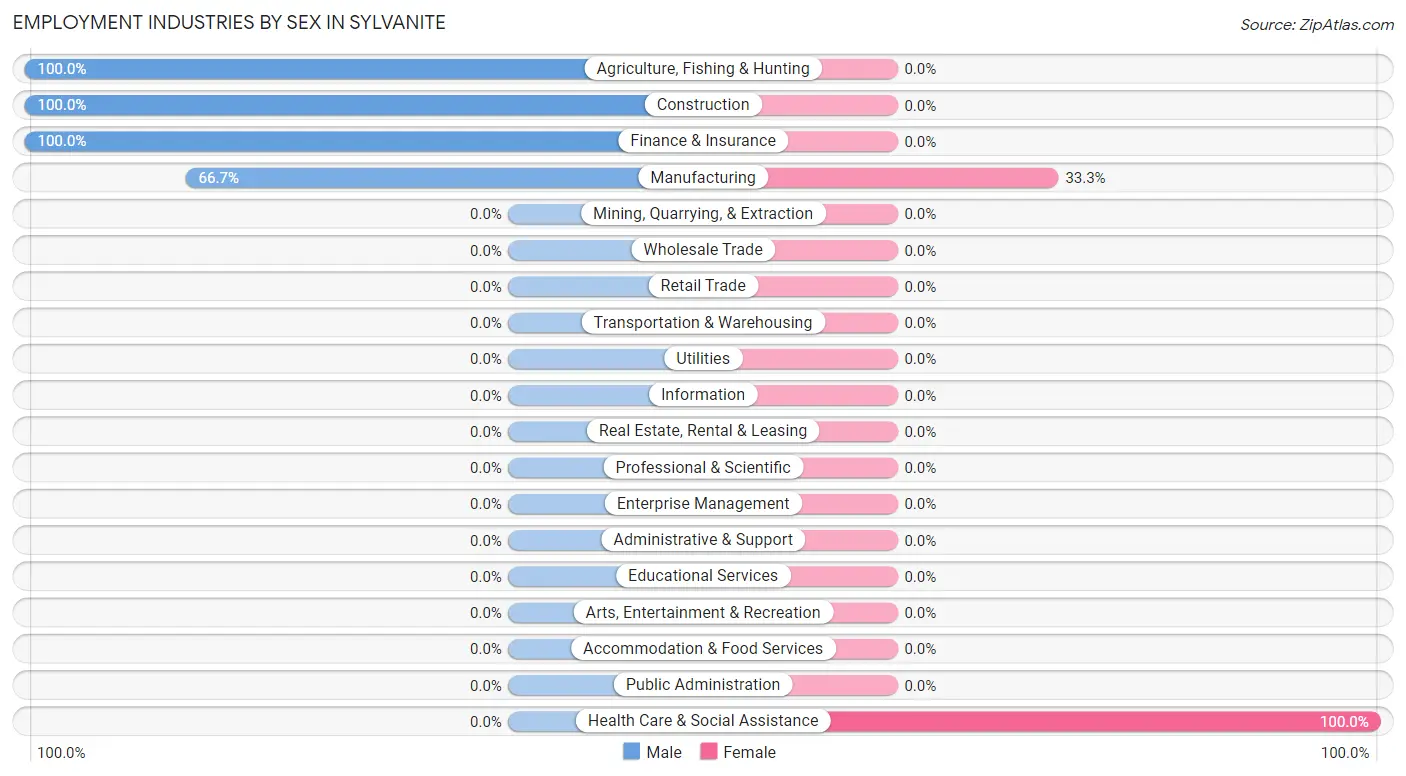
Employment Industries by Sex in Sylvanite
The Sylvanite industries that see more men than women are Agriculture, Fishing & Hunting (100.0%), Construction (100.0%), and Finance & Insurance (100.0%), whereas the industries that tend to have a higher number of women are Health Care & Social Assistance (100.0%), and Manufacturing (33.3%).
| Industry | Male | Female |
| Agriculture, Fishing & Hunting | 14 (100.0%) | 0 (0.0%) |
| Mining, Quarrying, & Extraction | 0 (0.0%) | 0 (0.0%) |
| Construction | 4 (100.0%) | 0 (0.0%) |
| Manufacturing | 4 (66.7%) | 2 (33.3%) |
| Wholesale Trade | 0 (0.0%) | 0 (0.0%) |
| Retail Trade | 0 (0.0%) | 0 (0.0%) |
| Transportation & Warehousing | 0 (0.0%) | 0 (0.0%) |
| Utilities | 0 (0.0%) | 0 (0.0%) |
| Information | 0 (0.0%) | 0 (0.0%) |
| Finance & Insurance | 3 (100.0%) | 0 (0.0%) |
| Real Estate, Rental & Leasing | 0 (0.0%) | 0 (0.0%) |
| Professional & Scientific | 0 (0.0%) | 0 (0.0%) |
| Enterprise Management | 0 (0.0%) | 0 (0.0%) |
| Administrative & Support | 0 (0.0%) | 0 (0.0%) |
| Educational Services | 0 (0.0%) | 0 (0.0%) |
| Health Care & Social Assistance | 0 (0.0%) | 4 (100.0%) |
| Arts, Entertainment & Recreation | 0 (0.0%) | 0 (0.0%) |
| Accommodation & Food Services | 0 (0.0%) | 0 (0.0%) |
| Public Administration | 0 (0.0%) | 0 (0.0%) |
| Total | 25 (80.6%) | 6 (19.4%) |
Education in Sylvanite
School Enrollment in Sylvanite
| School Level | # Students | % Students |
| Nursery / Preschool | 0 | 0.0% |
| Kindergarten | 0 | 0.0% |
| Elementary School | 0 | 0.0% |
| Middle School | 0 | 0.0% |
| High School | 0 | 0.0% |
| College / Undergraduate | 0 | 0.0% |
| Graduate / Professional | 0 | 0.0% |
| Total | 0 | 0.0% |
School Enrollment by Age by Funding Source in Sylvanite
| Age Bracket | Public School | Private School |
| 3 to 4 Year Olds | 0 (0.0%) | 0 (0.0%) |
| 5 to 9 Year Old | 0 (0.0%) | 0 (0.0%) |
| 10 to 14 Year Olds | 0 (0.0%) | 0 (0.0%) |
| 15 to 17 Year Olds | 0 (0.0%) | 0 (0.0%) |
| 18 to 19 Year Olds | 0 (0.0%) | 0 (0.0%) |
| 20 to 24 Year Olds | 0 (0.0%) | 0 (0.0%) |
| 25 to 34 Year Olds | 0 (0.0%) | 0 (0.0%) |
| 35 Years and over | 0 (0.0%) | 0 (0.0%) |
| Total | 0 (0.0%) | 0 (0.0%) |
Educational Attainment by Field of Study in Sylvanite
Physical & health sciences (12 | 38.7%), business (7 | 22.6%), science & technology (5 | 16.1%), education (3 | 9.7%), and liberal arts & history (2 | 6.5%) are the most common fields of study among 31 individuals in Sylvanite who have obtained a bachelor's degree or higher.
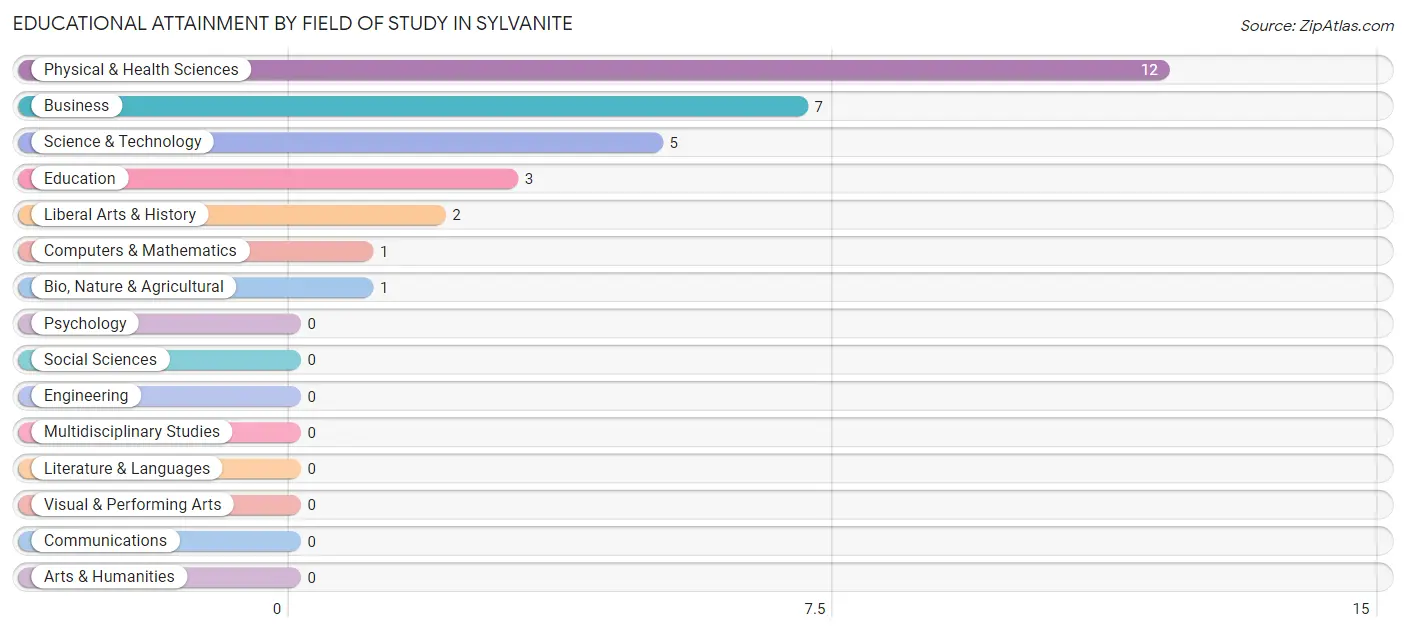
| Field of Study | # Graduates | % Graduates |
| Computers & Mathematics | 1 | 3.2% |
| Bio, Nature & Agricultural | 1 | 3.2% |
| Physical & Health Sciences | 12 | 38.7% |
| Psychology | 0 | 0.0% |
| Social Sciences | 0 | 0.0% |
| Engineering | 0 | 0.0% |
| Multidisciplinary Studies | 0 | 0.0% |
| Science & Technology | 5 | 16.1% |
| Business | 7 | 22.6% |
| Education | 3 | 9.7% |
| Literature & Languages | 0 | 0.0% |
| Liberal Arts & History | 2 | 6.5% |
| Visual & Performing Arts | 0 | 0.0% |
| Communications | 0 | 0.0% |
| Arts & Humanities | 0 | 0.0% |
| Total | 31 | 100.0% |
Transportation & Commute in Sylvanite
Vehicle Availability by Sex in Sylvanite
The most prevalent vehicle ownership categories in Sylvanite are males with 4 vehicles (19, accounting for 90.5%) and females with 4 vehicles (0, making up 475.0%).
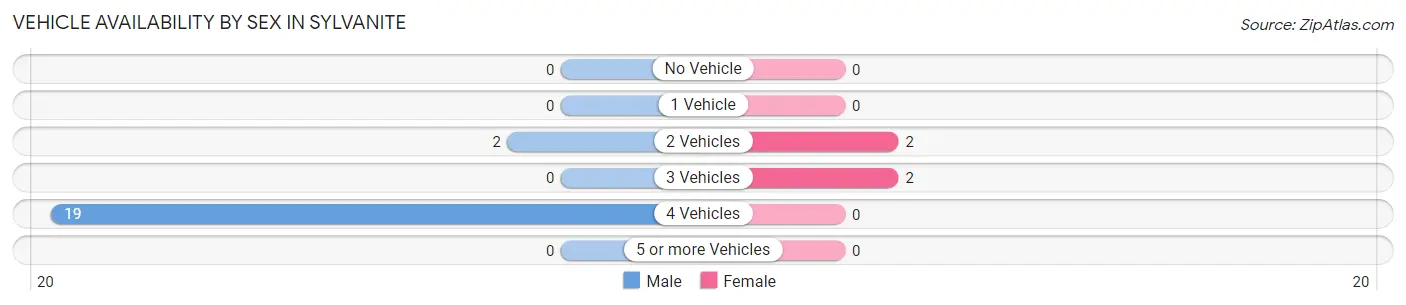
| Vehicles Available | Male | Female |
| No Vehicle | 0 (0.0%) | 0 (0.0%) |
| 1 Vehicle | 0 (0.0%) | 0 (0.0%) |
| 2 Vehicles | 2 (9.5%) | 2 (50.0%) |
| 3 Vehicles | 0 (0.0%) | 2 (50.0%) |
| 4 Vehicles | 19 (90.5%) | 0 (0.0%) |
| 5 or more Vehicles | 0 (0.0%) | 0 (0.0%) |
| Total | 21 (100.0%) | 4 (100.0%) |
Commute Time in Sylvanite
The most frequently occuring commute durations in Sylvanite are 60 to 89 minutes (16 commuters, 84.2%), 45 to 59 minutes (3 commuters, 15.8%), and less than 5 minutes (0 commuters, 0.0%).
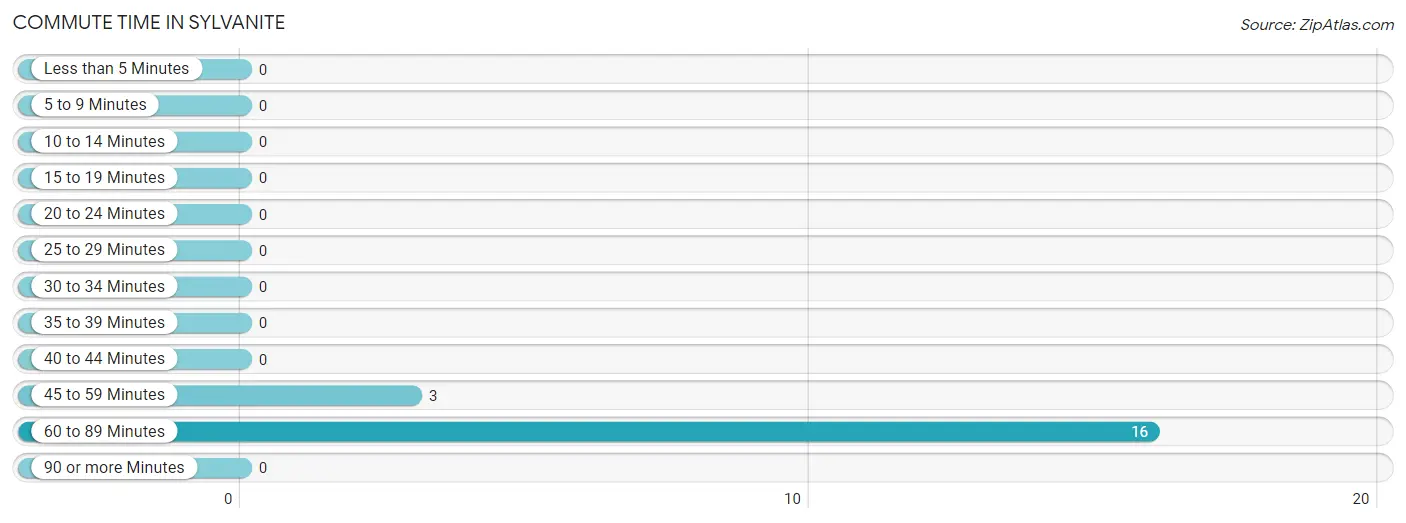
| Commute Time | # Commuters | % Commuters |
| Less than 5 Minutes | 0 | 0.0% |
| 5 to 9 Minutes | 0 | 0.0% |
| 10 to 14 Minutes | 0 | 0.0% |
| 15 to 19 Minutes | 0 | 0.0% |
| 20 to 24 Minutes | 0 | 0.0% |
| 25 to 29 Minutes | 0 | 0.0% |
| 30 to 34 Minutes | 0 | 0.0% |
| 35 to 39 Minutes | 0 | 0.0% |
| 40 to 44 Minutes | 0 | 0.0% |
| 45 to 59 Minutes | 3 | 15.8% |
| 60 to 89 Minutes | 16 | 84.2% |
| 90 or more Minutes | 0 | 0.0% |
Commute Time by Sex in Sylvanite
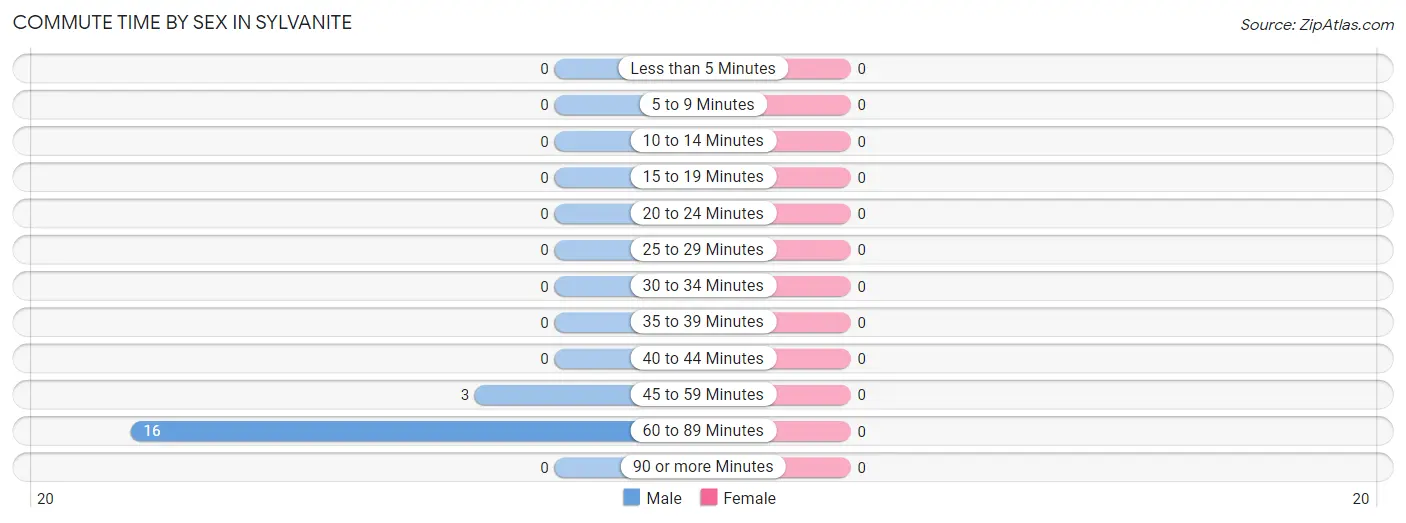
| Commute Time | Male | Female |
| Less than 5 Minutes | 0 (0.0%) | 0 (0.0%) |
| 5 to 9 Minutes | 0 (0.0%) | 0 (0.0%) |
| 10 to 14 Minutes | 0 (0.0%) | 0 (0.0%) |
| 15 to 19 Minutes | 0 (0.0%) | 0 (0.0%) |
| 20 to 24 Minutes | 0 (0.0%) | 0 (0.0%) |
| 25 to 29 Minutes | 0 (0.0%) | 0 (0.0%) |
| 30 to 34 Minutes | 0 (0.0%) | 0 (0.0%) |
| 35 to 39 Minutes | 0 (0.0%) | 0 (0.0%) |
| 40 to 44 Minutes | 0 (0.0%) | 0 (0.0%) |
| 45 to 59 Minutes | 3 (15.8%) | 0 (0.0%) |
| 60 to 89 Minutes | 16 (84.2%) | 0 (0.0%) |
| 90 or more Minutes | 0 (0.0%) | 0 (0.0%) |
Time of Departure to Work by Sex in Sylvanite
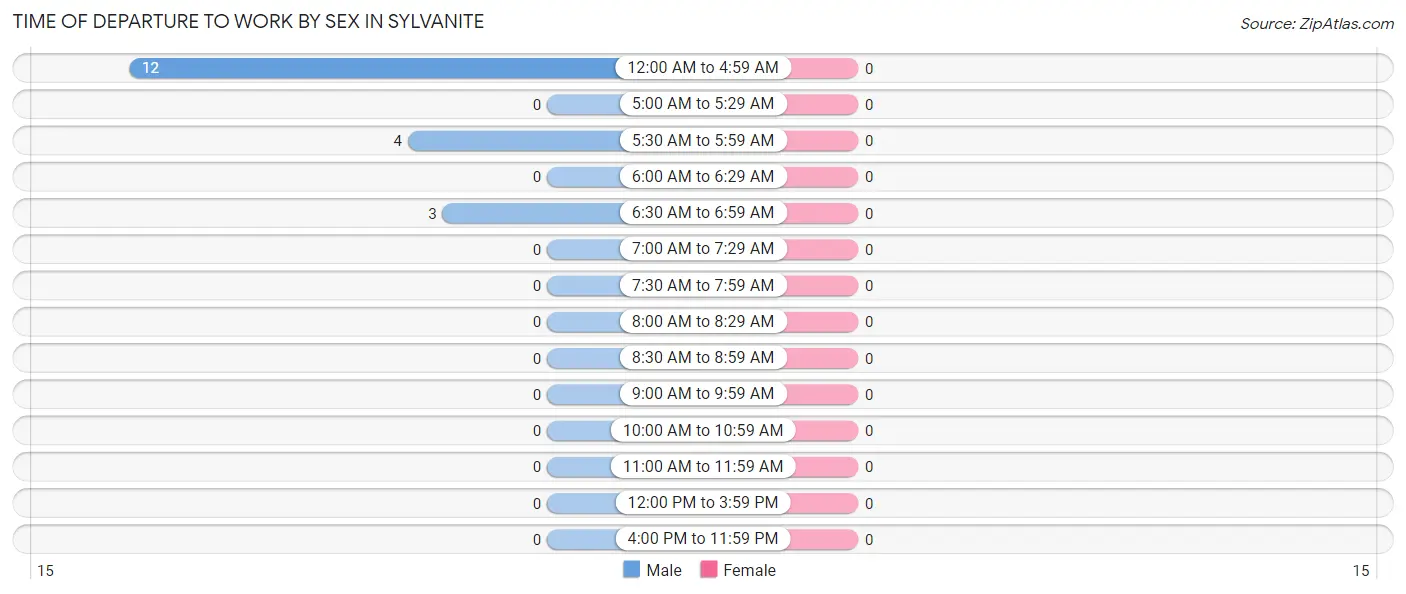
| Time of Departure | Male | Female |
| 12:00 AM to 4:59 AM | 12 (63.2%) | 0 (0.0%) |
| 5:00 AM to 5:29 AM | 0 (0.0%) | 0 (0.0%) |
| 5:30 AM to 5:59 AM | 4 (21.0%) | 0 (0.0%) |
| 6:00 AM to 6:29 AM | 0 (0.0%) | 0 (0.0%) |
| 6:30 AM to 6:59 AM | 3 (15.8%) | 0 (0.0%) |
| 7:00 AM to 7:29 AM | 0 (0.0%) | 0 (0.0%) |
| 7:30 AM to 7:59 AM | 0 (0.0%) | 0 (0.0%) |
| 8:00 AM to 8:29 AM | 0 (0.0%) | 0 (0.0%) |
| 8:30 AM to 8:59 AM | 0 (0.0%) | 0 (0.0%) |
| 9:00 AM to 9:59 AM | 0 (0.0%) | 0 (0.0%) |
| 10:00 AM to 10:59 AM | 0 (0.0%) | 0 (0.0%) |
| 11:00 AM to 11:59 AM | 0 (0.0%) | 0 (0.0%) |
| 12:00 PM to 3:59 PM | 0 (0.0%) | 0 (0.0%) |
| 4:00 PM to 11:59 PM | 0 (0.0%) | 0 (0.0%) |
| Total | 19 (100.0%) | 0 (0.0%) |
Housing Occupancy in Sylvanite
Occupancy by Ownership in Sylvanite
Of the total 53 dwellings in Sylvanite, owner-occupied units account for 36 (67.9%), while renter-occupied units make up 17 (32.1%).
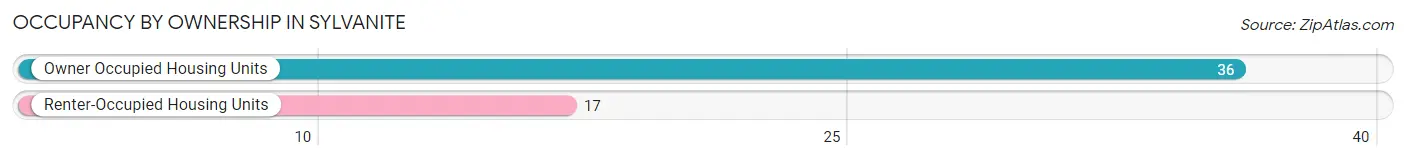
| Occupancy | # Housing Units | % Housing Units |
| Owner Occupied Housing Units | 36 | 67.9% |
| Renter-Occupied Housing Units | 17 | 32.1% |
| Total Occupied Housing Units | 53 | 100.0% |
Occupancy by Household Size in Sylvanite
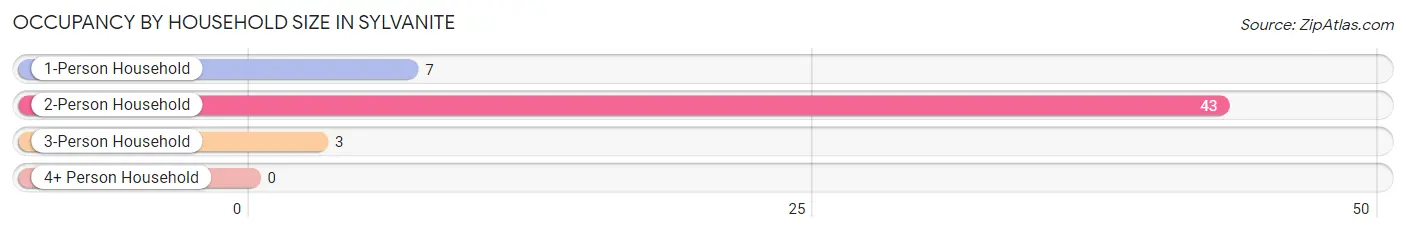
| Household Size | # Housing Units | % Housing Units |
| 1-Person Household | 7 | 13.2% |
| 2-Person Household | 43 | 81.1% |
| 3-Person Household | 3 | 5.7% |
| 4+ Person Household | 0 | 0.0% |
| Total Housing Units | 53 | 100.0% |
Occupancy by Ownership by Household Size in Sylvanite
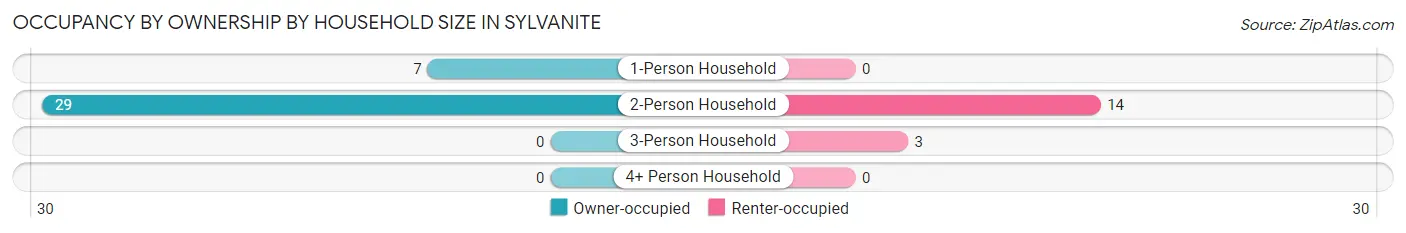
| Household Size | Owner-occupied | Renter-occupied |
| 1-Person Household | 7 (100.0%) | 0 (0.0%) |
| 2-Person Household | 29 (67.4%) | 14 (32.6%) |
| 3-Person Household | 0 (0.0%) | 3 (100.0%) |
| 4+ Person Household | 0 (0.0%) | 0 (0.0%) |
| Total Housing Units | 36 (67.9%) | 17 (32.1%) |
Occupancy by Educational Attainment in Sylvanite
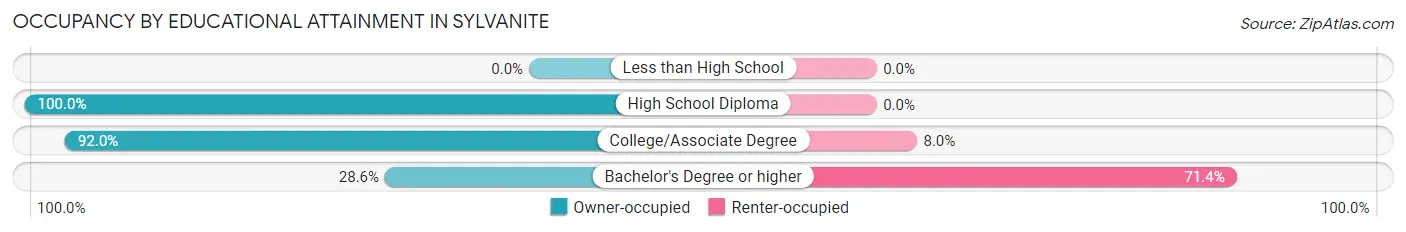
| Household Size | Owner-occupied | Renter-occupied |
| Less than High School | 0 (0.0%) | 0 (0.0%) |
| High School Diploma | 7 (100.0%) | 0 (0.0%) |
| College/Associate Degree | 23 (92.0%) | 2 (8.0%) |
| Bachelor's Degree or higher | 6 (28.6%) | 15 (71.4%) |
Occupancy by Age of Householder in Sylvanite
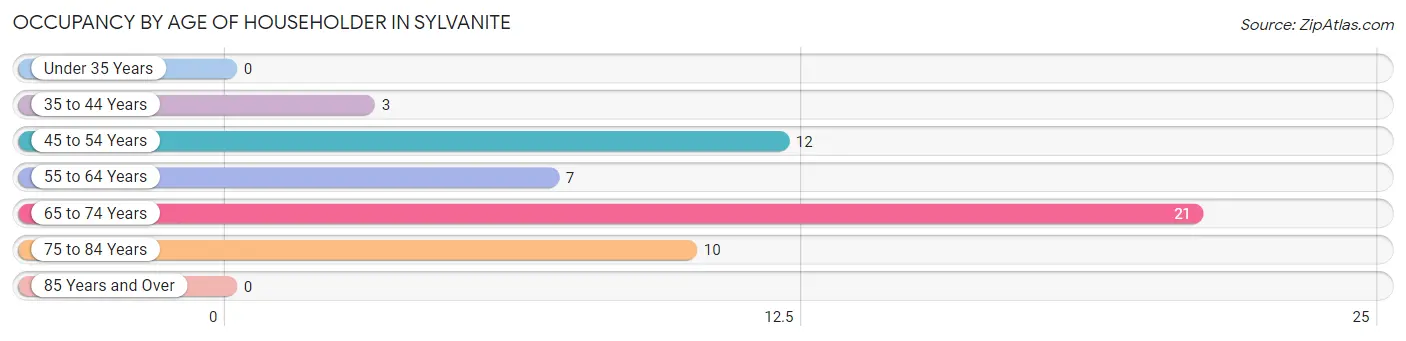
| Age Bracket | # Households | % Households |
| Under 35 Years | 0 | 0.0% |
| 35 to 44 Years | 3 | 5.7% |
| 45 to 54 Years | 12 | 22.6% |
| 55 to 64 Years | 7 | 13.2% |
| 65 to 74 Years | 21 | 39.6% |
| 75 to 84 Years | 10 | 18.9% |
| 85 Years and Over | 0 | 0.0% |
| Total | 53 | 100.0% |
Housing Finances in Sylvanite
Median Income by Occupancy in Sylvanite
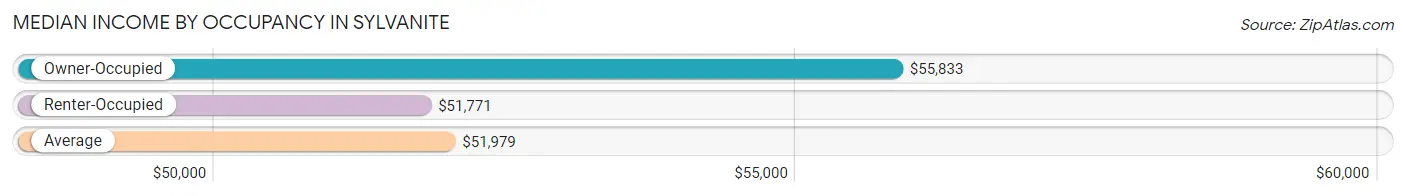
| Occupancy Type | # Households | Median Income |
| Owner-Occupied | 36 (67.9%) | $55,833 |
| Renter-Occupied | 17 (32.1%) | $51,771 |
| Average | 53 (100.0%) | $51,979 |
Occupancy by Householder Income Bracket in Sylvanite
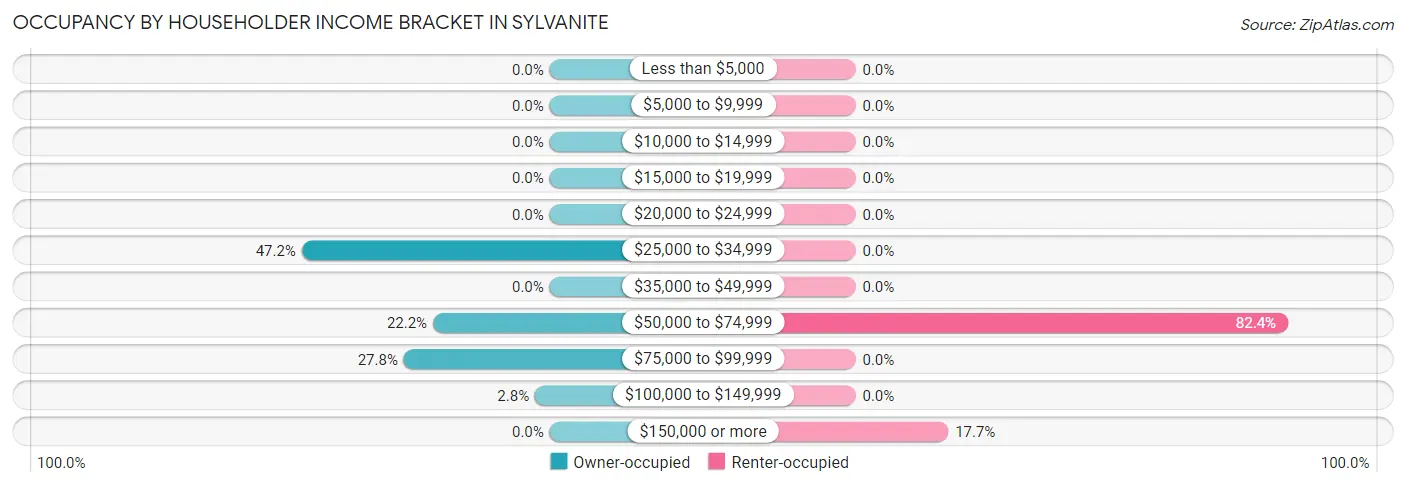
| Income Bracket | Owner-occupied | Renter-occupied |
| Less than $5,000 | 0 (0.0%) | 0 (0.0%) |
| $5,000 to $9,999 | 0 (0.0%) | 0 (0.0%) |
| $10,000 to $14,999 | 0 (0.0%) | 0 (0.0%) |
| $15,000 to $19,999 | 0 (0.0%) | 0 (0.0%) |
| $20,000 to $24,999 | 0 (0.0%) | 0 (0.0%) |
| $25,000 to $34,999 | 17 (47.2%) | 0 (0.0%) |
| $35,000 to $49,999 | 0 (0.0%) | 0 (0.0%) |
| $50,000 to $74,999 | 8 (22.2%) | 14 (82.4%) |
| $75,000 to $99,999 | 10 (27.8%) | 0 (0.0%) |
| $100,000 to $149,999 | 1 (2.8%) | 0 (0.0%) |
| $150,000 or more | 0 (0.0%) | 3 (17.6%) |
| Total | 36 (100.0%) | 17 (100.0%) |
Monthly Housing Cost Tiers in Sylvanite
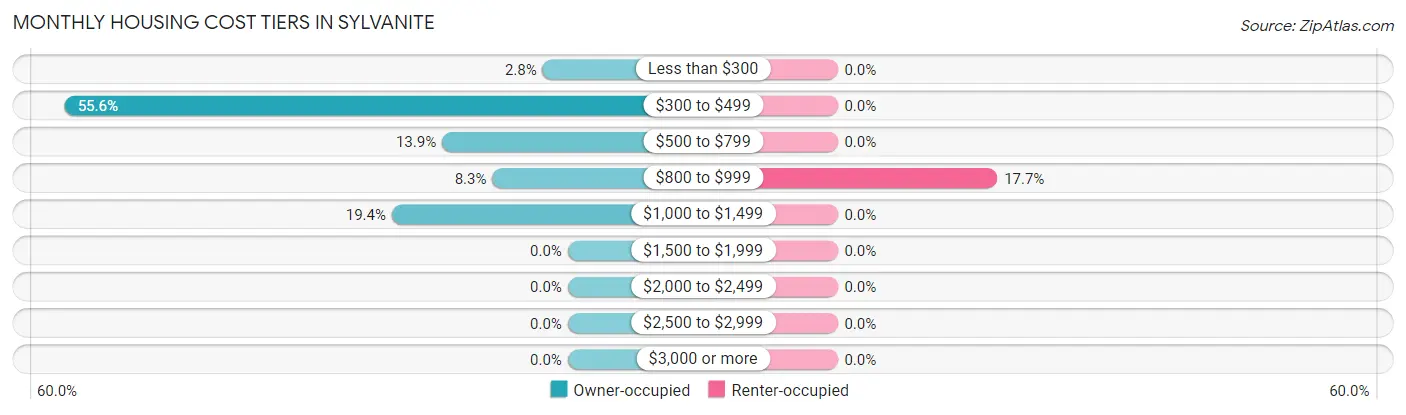
| Monthly Cost | Owner-occupied | Renter-occupied |
| Less than $300 | 1 (2.8%) | 0 (0.0%) |
| $300 to $499 | 20 (55.6%) | 0 (0.0%) |
| $500 to $799 | 5 (13.9%) | 0 (0.0%) |
| $800 to $999 | 3 (8.3%) | 3 (17.6%) |
| $1,000 to $1,499 | 7 (19.4%) | 0 (0.0%) |
| $1,500 to $1,999 | 0 (0.0%) | 0 (0.0%) |
| $2,000 to $2,499 | 0 (0.0%) | 0 (0.0%) |
| $2,500 to $2,999 | 0 (0.0%) | 0 (0.0%) |
| $3,000 or more | 0 (0.0%) | 0 (0.0%) |
| Total | 36 (100.0%) | 17 (100.0%) |
Physical Housing Characteristics in Sylvanite
Housing Structures in Sylvanite
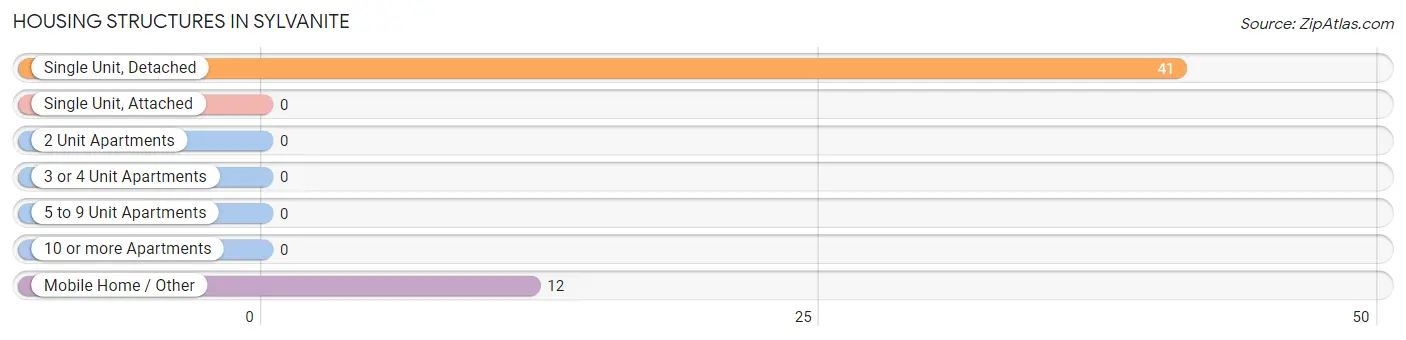
| Structure Type | # Housing Units | % Housing Units |
| Single Unit, Detached | 41 | 77.4% |
| Single Unit, Attached | 0 | 0.0% |
| 2 Unit Apartments | 0 | 0.0% |
| 3 or 4 Unit Apartments | 0 | 0.0% |
| 5 to 9 Unit Apartments | 0 | 0.0% |
| 10 or more Apartments | 0 | 0.0% |
| Mobile Home / Other | 12 | 22.6% |
| Total | 53 | 100.0% |
Housing Structures by Occupancy in Sylvanite
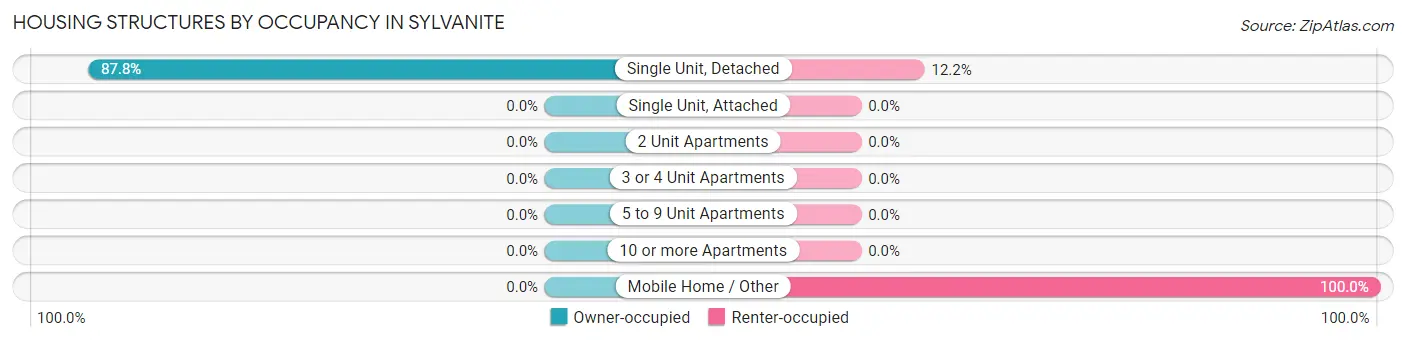
| Structure Type | Owner-occupied | Renter-occupied |
| Single Unit, Detached | 36 (87.8%) | 5 (12.2%) |
| Single Unit, Attached | 0 (0.0%) | 0 (0.0%) |
| 2 Unit Apartments | 0 (0.0%) | 0 (0.0%) |
| 3 or 4 Unit Apartments | 0 (0.0%) | 0 (0.0%) |
| 5 to 9 Unit Apartments | 0 (0.0%) | 0 (0.0%) |
| 10 or more Apartments | 0 (0.0%) | 0 (0.0%) |
| Mobile Home / Other | 0 (0.0%) | 12 (100.0%) |
| Total | 36 (67.9%) | 17 (32.1%) |
Housing Structures by Number of Rooms in Sylvanite
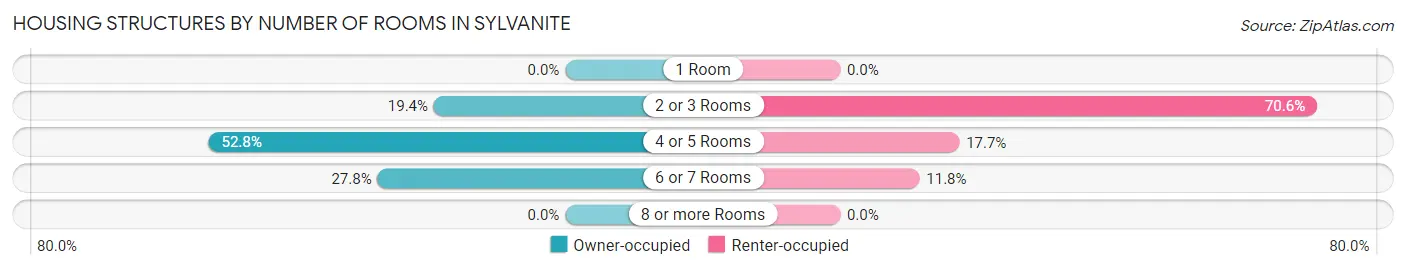
| Number of Rooms | Owner-occupied | Renter-occupied |
| 1 Room | 0 (0.0%) | 0 (0.0%) |
| 2 or 3 Rooms | 7 (19.4%) | 12 (70.6%) |
| 4 or 5 Rooms | 19 (52.8%) | 3 (17.6%) |
| 6 or 7 Rooms | 10 (27.8%) | 2 (11.8%) |
| 8 or more Rooms | 0 (0.0%) | 0 (0.0%) |
| Total | 36 (100.0%) | 17 (100.0%) |
Housing Structure by Heating Type in Sylvanite
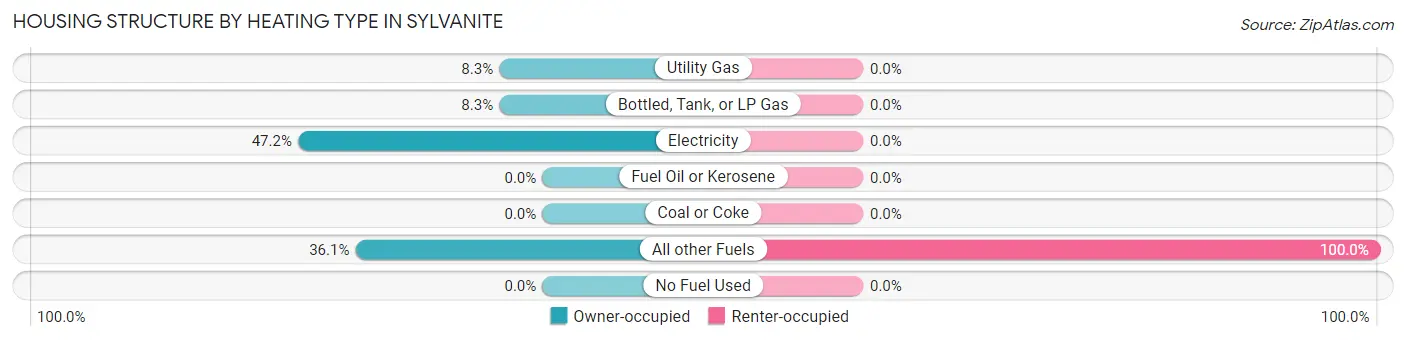
| Heating Type | Owner-occupied | Renter-occupied |
| Utility Gas | 3 (8.3%) | 0 (0.0%) |
| Bottled, Tank, or LP Gas | 3 (8.3%) | 0 (0.0%) |
| Electricity | 17 (47.2%) | 0 (0.0%) |
| Fuel Oil or Kerosene | 0 (0.0%) | 0 (0.0%) |
| Coal or Coke | 0 (0.0%) | 0 (0.0%) |
| All other Fuels | 13 (36.1%) | 17 (100.0%) |
| No Fuel Used | 0 (0.0%) | 0 (0.0%) |
| Total | 36 (100.0%) | 17 (100.0%) |
Household Vehicle Usage in Sylvanite
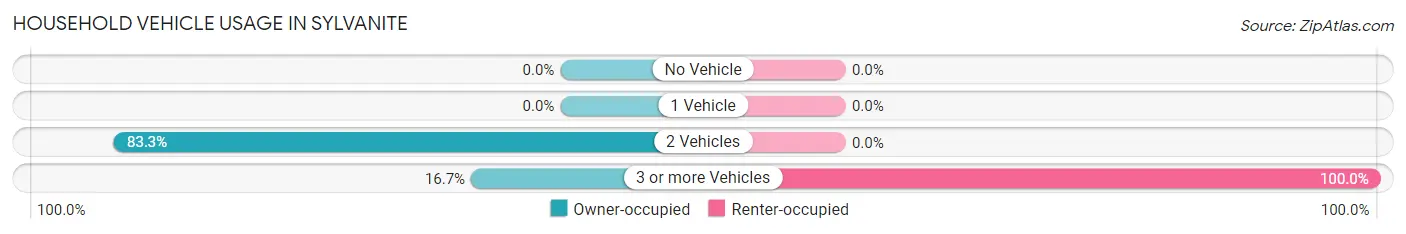
| Vehicles per Household | Owner-occupied | Renter-occupied |
| No Vehicle | 0 (0.0%) | 0 (0.0%) |
| 1 Vehicle | 0 (0.0%) | 0 (0.0%) |
| 2 Vehicles | 30 (83.3%) | 0 (0.0%) |
| 3 or more Vehicles | 6 (16.7%) | 17 (100.0%) |
| Total | 36 (100.0%) | 17 (100.0%) |
Real Estate & Mortgages in Sylvanite
Real Estate and Mortgage Overview in Sylvanite
| Characteristic | Without Mortgage | With Mortgage |
| Housing Units | 27 | 9 |
| Median Property Value | - | - |
| Median Household Income | $70,417 | $0 |
| Monthly Housing Costs | $456 | $0 |
| Real Estate Taxes | $1,917 | $0 |
Property Value by Mortgage Status in Sylvanite
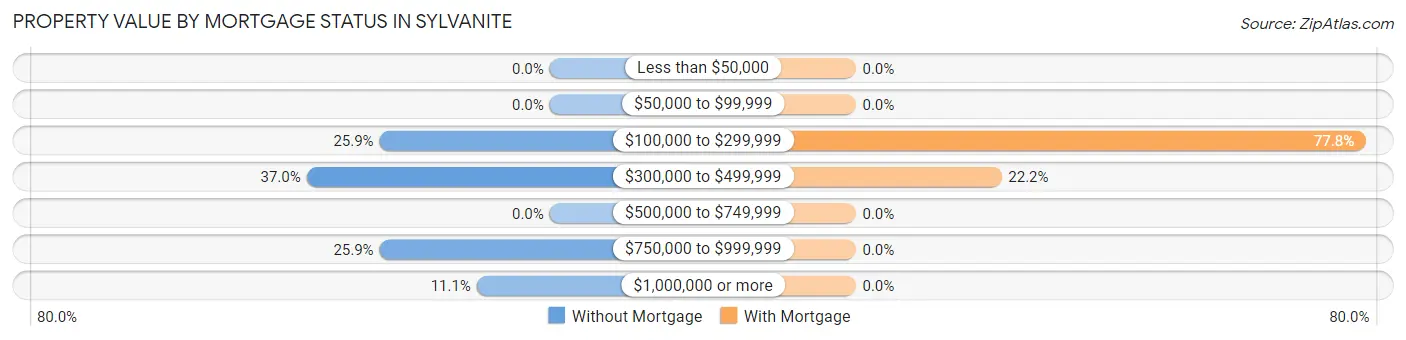
| Property Value | Without Mortgage | With Mortgage |
| Less than $50,000 | 0 (0.0%) | 0 (0.0%) |
| $50,000 to $99,999 | 0 (0.0%) | 0 (0.0%) |
| $100,000 to $299,999 | 7 (25.9%) | 7 (77.8%) |
| $300,000 to $499,999 | 10 (37.0%) | 2 (22.2%) |
| $500,000 to $749,999 | 0 (0.0%) | 0 (0.0%) |
| $750,000 to $999,999 | 7 (25.9%) | 0 (0.0%) |
| $1,000,000 or more | 3 (11.1%) | 0 (0.0%) |
| Total | 27 (100.0%) | 9 (100.0%) |
Household Income by Mortgage Status in Sylvanite
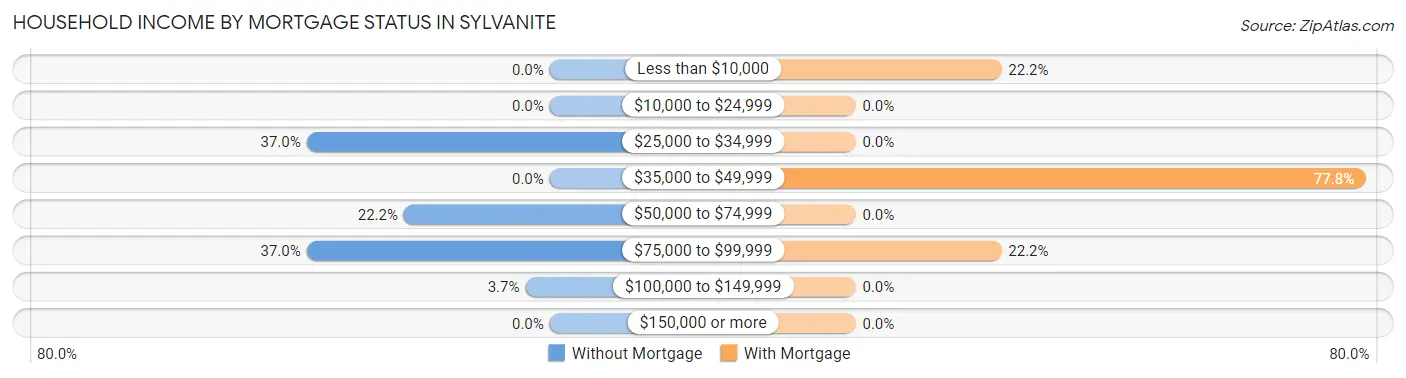
| Household Income | Without Mortgage | With Mortgage |
| Less than $10,000 | 0 (0.0%) | 2 (22.2%) |
| $10,000 to $24,999 | 0 (0.0%) | 0 (0.0%) |
| $25,000 to $34,999 | 10 (37.0%) | 0 (0.0%) |
| $35,000 to $49,999 | 0 (0.0%) | 7 (77.8%) |
| $50,000 to $74,999 | 6 (22.2%) | 0 (0.0%) |
| $75,000 to $99,999 | 10 (37.0%) | 2 (22.2%) |
| $100,000 to $149,999 | 1 (3.7%) | 0 (0.0%) |
| $150,000 or more | 0 (0.0%) | 0 (0.0%) |
| Total | 27 (100.0%) | 9 (100.0%) |
Property Value to Household Income Ratio in Sylvanite
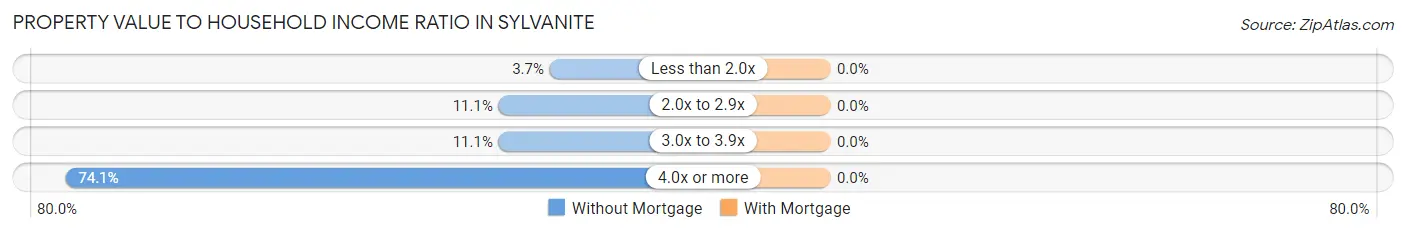
| Value-to-Income Ratio | Without Mortgage | With Mortgage |
| Less than 2.0x | 1 (3.7%) | 0 (0.0%) |
| 2.0x to 2.9x | 3 (11.1%) | 0 (0.0%) |
| 3.0x to 3.9x | 3 (11.1%) | 0 (0.0%) |
| 4.0x or more | 20 (74.1%) | 0 (0.0%) |
| Total | 27 (100.0%) | 9 (100.0%) |
Real Estate Taxes by Mortgage Status in Sylvanite
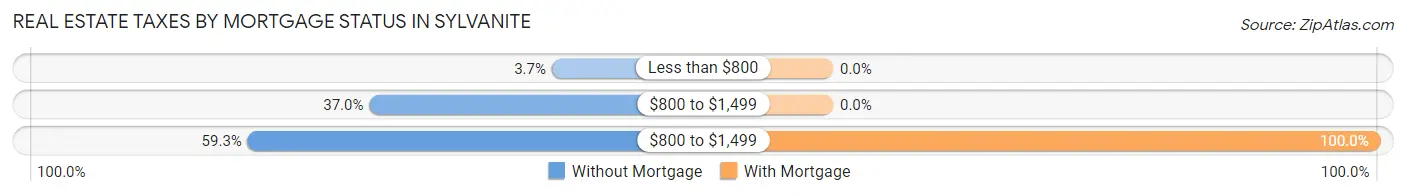
| Property Taxes | Without Mortgage | With Mortgage |
| Less than $800 | 1 (3.7%) | 0 (0.0%) |
| $800 to $1,499 | 10 (37.0%) | 0 (0.0%) |
| $800 to $1,499 | 16 (59.3%) | 9 (100.0%) |
| Total | 27 (100.0%) | 9 (100.0%) |
Health & Disability in Sylvanite
Health Insurance Coverage by Age in Sylvanite
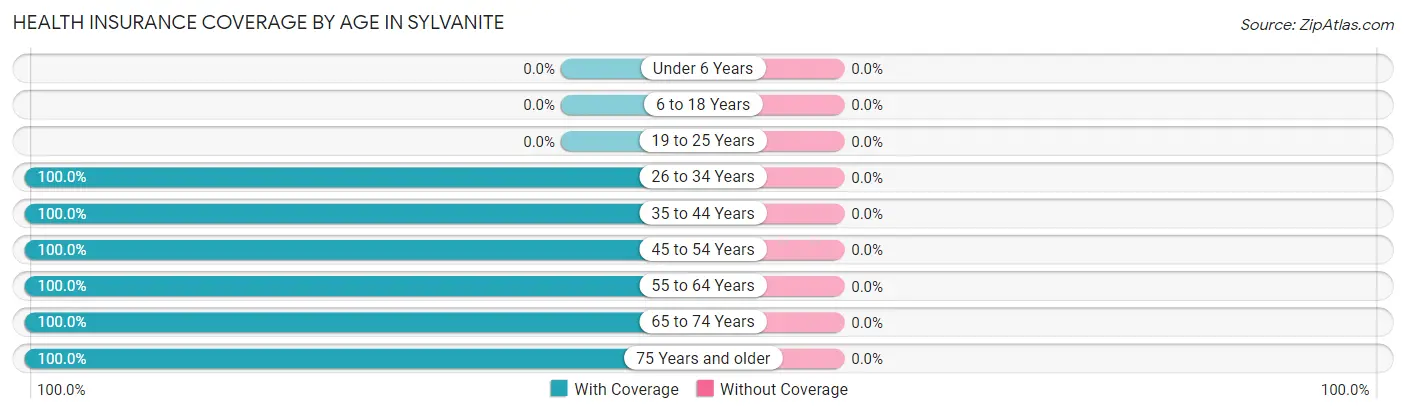
| Age Bracket | With Coverage | Without Coverage |
| Under 6 Years | 0 (0.0%) | 0 (0.0%) |
| 6 to 18 Years | 0 (0.0%) | 0 (0.0%) |
| 19 to 25 Years | 0 (0.0%) | 0 (0.0%) |
| 26 to 34 Years | 6 (100.0%) | 0 (0.0%) |
| 35 to 44 Years | 18 (100.0%) | 0 (0.0%) |
| 45 to 54 Years | 12 (100.0%) | 0 (0.0%) |
| 55 to 64 Years | 7 (100.0%) | 0 (0.0%) |
| 65 to 74 Years | 47 (100.0%) | 0 (0.0%) |
| 75 Years and older | 22 (100.0%) | 0 (0.0%) |
| Total | 112 (100.0%) | 0 (0.0%) |
Health Insurance Coverage by Citizenship Status in Sylvanite
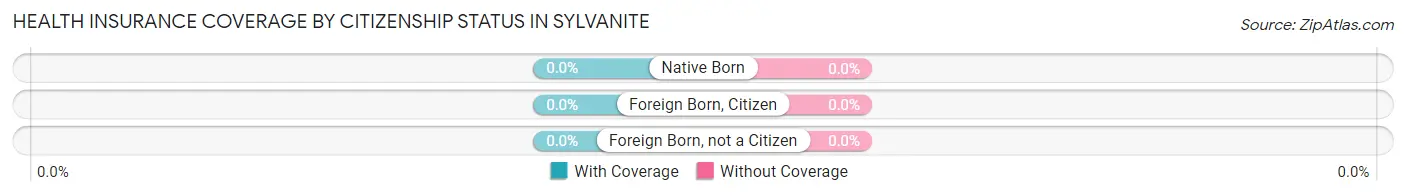
| Citizenship Status | With Coverage | Without Coverage |
| Native Born | 0 (0.0%) | 0 (0.0%) |
| Foreign Born, Citizen | 0 (0.0%) | 0 (0.0%) |
| Foreign Born, not a Citizen | 0 (0.0%) | 0 (0.0%) |
Health Insurance Coverage by Household Income in Sylvanite
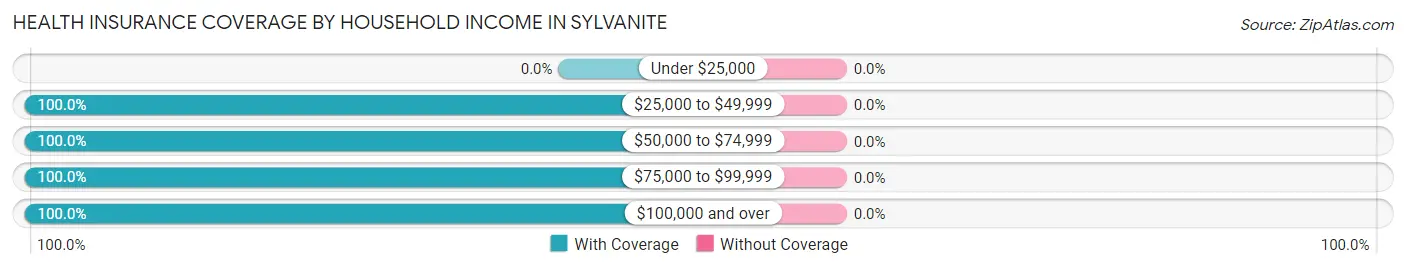
| Household Income | With Coverage | Without Coverage |
| Under $25,000 | 0 (0.0%) | 0 (0.0%) |
| $25,000 to $49,999 | 42 (100.0%) | 0 (0.0%) |
| $50,000 to $74,999 | 43 (100.0%) | 0 (0.0%) |
| $75,000 to $99,999 | 16 (100.0%) | 0 (0.0%) |
| $100,000 and over | 11 (100.0%) | 0 (0.0%) |
Public vs Private Health Insurance Coverage by Age in Sylvanite
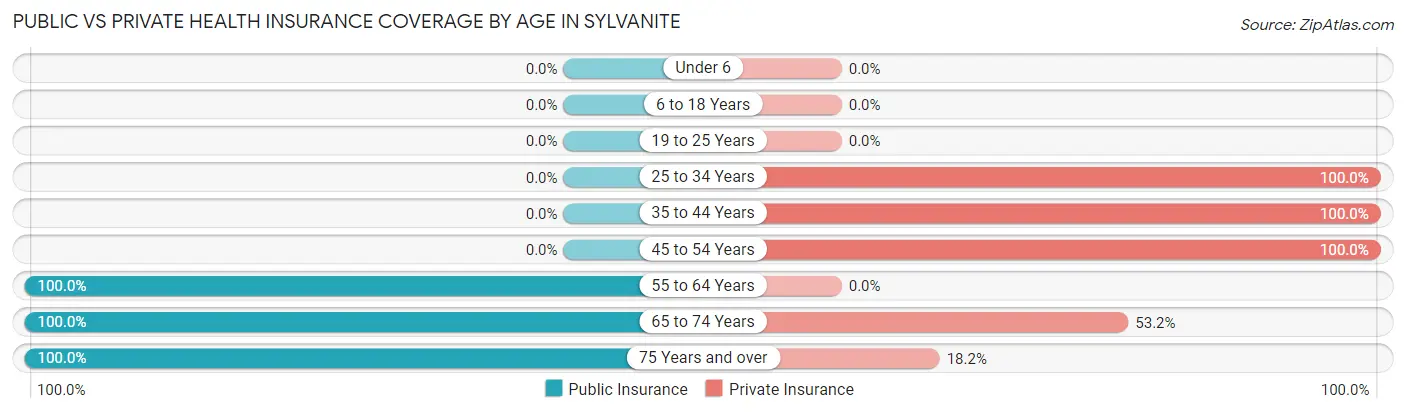
| Age Bracket | Public Insurance | Private Insurance |
| Under 6 | 0 (0.0%) | 0 (0.0%) |
| 6 to 18 Years | 0 (0.0%) | 0 (0.0%) |
| 19 to 25 Years | 0 (0.0%) | 0 (0.0%) |
| 25 to 34 Years | 0 (0.0%) | 6 (100.0%) |
| 35 to 44 Years | 0 (0.0%) | 18 (100.0%) |
| 45 to 54 Years | 0 (0.0%) | 12 (100.0%) |
| 55 to 64 Years | 7 (100.0%) | 0 (0.0%) |
| 65 to 74 Years | 47 (100.0%) | 25 (53.2%) |
| 75 Years and over | 22 (100.0%) | 4 (18.2%) |
| Total | 76 (67.9%) | 65 (58.0%) |
Disability Status by Sex by Age in Sylvanite
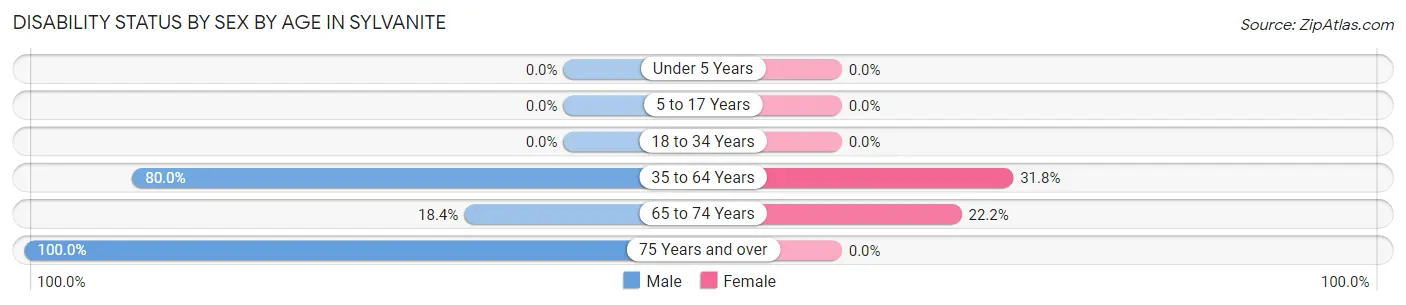
| Age Bracket | Male | Female |
| Under 5 Years | 0 (0.0%) | 0 (0.0%) |
| 5 to 17 Years | 0 (0.0%) | 0 (0.0%) |
| 18 to 34 Years | 0 (0.0%) | 0 (0.0%) |
| 35 to 64 Years | 12 (80.0%) | 7 (31.8%) |
| 65 to 74 Years | 7 (18.4%) | 2 (22.2%) |
| 75 Years and over | 10 (100.0%) | 0 (0.0%) |
Disability Class by Sex by Age in Sylvanite
Disability Class: Hearing Difficulty
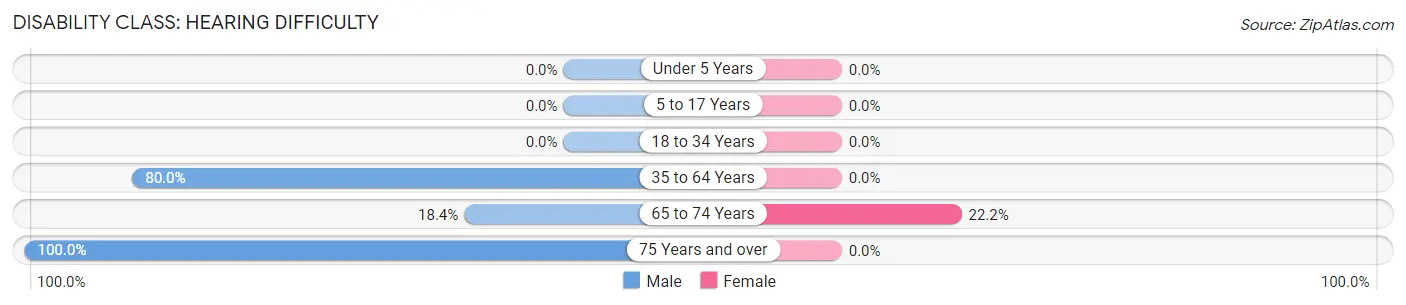
| Age Bracket | Male | Female |
| Under 5 Years | 0 (0.0%) | 0 (0.0%) |
| 5 to 17 Years | 0 (0.0%) | 0 (0.0%) |
| 18 to 34 Years | 0 (0.0%) | 0 (0.0%) |
| 35 to 64 Years | 12 (80.0%) | 0 (0.0%) |
| 65 to 74 Years | 7 (18.4%) | 2 (22.2%) |
| 75 Years and over | 10 (100.0%) | 0 (0.0%) |
Disability Class: Vision Difficulty
| Age Bracket | Male | Female |
| Under 5 Years | 0 (0.0%) | 0 (0.0%) |
| 5 to 17 Years | 0 (0.0%) | 0 (0.0%) |
| 18 to 34 Years | 0 (0.0%) | 0 (0.0%) |
| 35 to 64 Years | 0 (0.0%) | 0 (0.0%) |
| 65 to 74 Years | 0 (0.0%) | 0 (0.0%) |
| 75 Years and over | 0 (0.0%) | 0 (0.0%) |
Disability Class: Cognitive Difficulty
| Age Bracket | Male | Female |
| 5 to 17 Years | 0 (0.0%) | 0 (0.0%) |
| 18 to 34 Years | 0 (0.0%) | 0 (0.0%) |
| 35 to 64 Years | 0 (0.0%) | 0 (0.0%) |
| 65 to 74 Years | 0 (0.0%) | 0 (0.0%) |
| 75 Years and over | 0 (0.0%) | 0 (0.0%) |
Disability Class: Ambulatory Difficulty
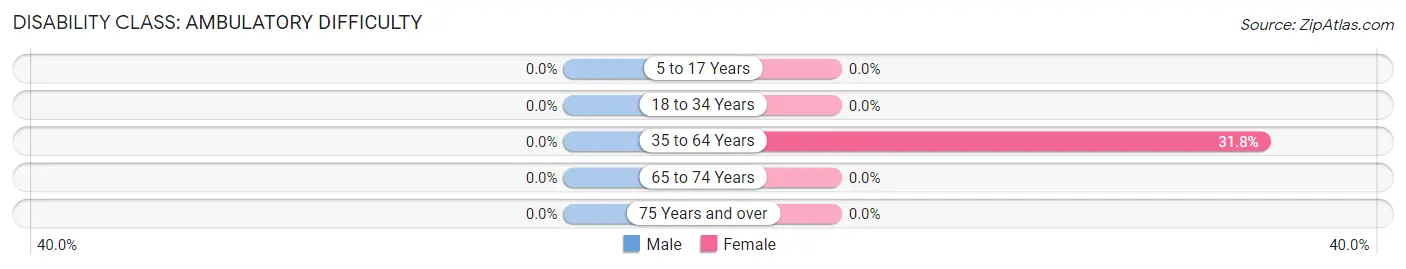
| Age Bracket | Male | Female |
| 5 to 17 Years | 0 (0.0%) | 0 (0.0%) |
| 18 to 34 Years | 0 (0.0%) | 0 (0.0%) |
| 35 to 64 Years | 0 (0.0%) | 7 (31.8%) |
| 65 to 74 Years | 0 (0.0%) | 0 (0.0%) |
| 75 Years and over | 0 (0.0%) | 0 (0.0%) |
Disability Class: Self-Care Difficulty

| Age Bracket | Male | Female |
| 5 to 17 Years | 0 (0.0%) | 0 (0.0%) |
| 18 to 34 Years | 0 (0.0%) | 0 (0.0%) |
| 35 to 64 Years | 0 (0.0%) | 0 (0.0%) |
| 65 to 74 Years | 0 (0.0%) | 0 (0.0%) |
| 75 Years and over | 0 (0.0%) | 0 (0.0%) |
Technology Access in Sylvanite
Computing Device Access in Sylvanite

| Device Type | # Households | % Households |
| Desktop or Laptop | 52 | 98.1% |
| Smartphone | 47 | 88.7% |
| Tablet | 42 | 79.2% |
| No Computing Device | 0 | 0.0% |
| Total | 53 | 100.0% |
Internet Access in Sylvanite
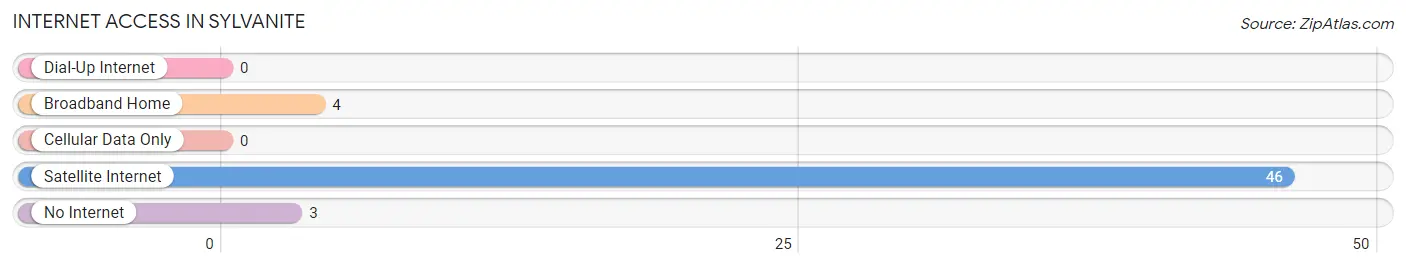
| Internet Type | # Households | % Households |
| Dial-Up Internet | 0 | 0.0% |
| Broadband Home | 4 | 7.5% |
| Cellular Data Only | 0 | 0.0% |
| Satellite Internet | 46 | 86.8% |
| No Internet | 3 | 5.7% |
| Total | 53 | 100.0% |
Sylvanite Summary
Sylvanite is a small unincorporated community located in the southeastern corner of Montana, in the county of Carbon. It is situated in the foothills of the Beartooth Mountains, approximately 20 miles south of Red Lodge. The town was founded in the late 1800s and has a population of approximately 200 people.
History
Sylvanite was founded in the late 1800s by a group of homesteaders who were drawn to the area by its rich soil and abundant wildlife. The town was named after the nearby Sylvanite Creek, which was named after the abundant sylvanite ore found in the area. The ore was used to make tools and weapons, and was also used to make jewelry.
The town grew slowly but steadily, and by the early 1900s it had become a bustling community with a population of around 500 people. The town was home to a variety of businesses, including a general store, a blacksmith, a saloon, and a hotel.
In the 1920s, the town was connected to the rest of the state by the newly constructed Yellowstone Highway. This allowed for increased trade and travel, and the town continued to grow.
In the 1950s, the town was connected to the rest of the state by the newly constructed Interstate 90. This allowed for increased trade and travel, and the town continued to grow.
Geography
Sylvanite is located in the southeastern corner of Montana, in the county of Carbon. It is situated in the foothills of the Beartooth Mountains, approximately 20 miles south of Red Lodge. The town is located at an elevation of 4,890 feet above sea level.
The town is surrounded by rolling hills and grasslands, and is home to a variety of wildlife, including deer, elk, and antelope. The nearby Sylvanite Creek is a popular spot for fishing and camping.
Economy
Sylvanite is a small, rural community with a limited economy. The town is home to a variety of small businesses, including a general store, a gas station, a restaurant, and a bar. The town is also home to a small sawmill, which provides employment for a handful of people.
The town is also home to a variety of small farms, which produce a variety of crops, including wheat, barley, and hay. The town is also home to a small ranch, which raises cattle and horses.
Demographics
As of the 2010 census, the population of Sylvanite was 200 people. The town is predominantly white, with a small Hispanic population. The median age of the population is 44 years old. The median household income is $37,500.
Conclusion
Sylvanite is a small, rural community located in the southeastern corner of Montana. The town was founded in the late 1800s and has a population of approximately 200 people. The town is home to a variety of small businesses, including a general store, a gas station, a restaurant, and a bar. The town is also home to a variety of small farms, which produce a variety of crops, including wheat, barley, and hay. The town is predominantly white, with a small Hispanic population. The median age of the population is 44 years old. The median household income is $37,500.
Common Questions
What is Per Capita Income in Sylvanite?
Per Capita income in Sylvanite is $31,156.
What is the Median Family Income in Sylvanite?
Median Family Income in Sylvanite is $51,042.
What is the Median Household income in Sylvanite?
Median Household Income in Sylvanite is $51,979.
What is Inequality or Gini Index in Sylvanite?
Inequality or Gini Index in Sylvanite is 0.28.
What is the Total Population of Sylvanite?
Total Population of Sylvanite is 112.
What is the Total Male Population of Sylvanite?
Total Male Population of Sylvanite is 67.
What is the Total Female Population of Sylvanite?
Total Female Population of Sylvanite is 45.
What is the Ratio of Males per 100 Females in Sylvanite?
There are 148.89 Males per 100 Females in Sylvanite.
What is the Ratio of Females per 100 Males in Sylvanite?
There are 67.16 Females per 100 Males in Sylvanite.
What is the Median Population Age in Sylvanite?
Median Population Age in Sylvanite is 68.0 Years.
What is the Average Family Size in Sylvanite
Average Family Size in Sylvanite is 2.2 People.
What is the Average Household Size in Sylvanite
Average Household Size in Sylvanite is 2.1 People.
How Large is the Labor Force in Sylvanite?
There are 31 People in the Labor Forcein in Sylvanite.
What is the Percentage of People in the Labor Force in Sylvanite?
27.7% of People are in the Labor Force in Sylvanite.