Lima, MT Map & Demographics
Lima Map
Lima Overview
$29,376
PER CAPITA INCOME
$39,306
AVG FAMILY INCOME
$47,250
AVG HOUSEHOLD INCOME
67.5%
WAGE / INCOME GAP [ % ]
32.5¢/ $1
WAGE / INCOME GAP [ $ ]
0.33
INEQUALITY / GINI INDEX
209
TOTAL POPULATION
113
MALE POPULATION
96
FEMALE POPULATION
117.71
MALES / 100 FEMALES
84.96
FEMALES / 100 MALES
52.8
MEDIAN AGE
2.4
AVG FAMILY SIZE
1.8
AVG HOUSEHOLD SIZE
74
LABOR FORCE [ PEOPLE ]
43.8%
PERCENT IN LABOR FORCE
Lima Zip Codes
Lima Area Codes
Income in Lima
Income Overview in Lima
Per Capita Income in Lima is $29,376, while median incomes of families and households are $39,306 and $47,250 respectively.
| Characteristic | Number | Measure |
| Per Capita Income | 209 | $29,376 |
| Median Family Income | 59 | $39,306 |
| Mean Family Income | 59 | $46,831 |
| Median Household Income | 117 | $47,250 |
| Mean Household Income | 117 | $53,164 |
| Income Deficit | 59 | $0 |
| Wage / Income Gap (%) | 209 | 67.53% |
| Wage / Income Gap ($) | 209 | 32.47¢ per $1 |
| Gini / Inequality Index | 209 | 0.33 |
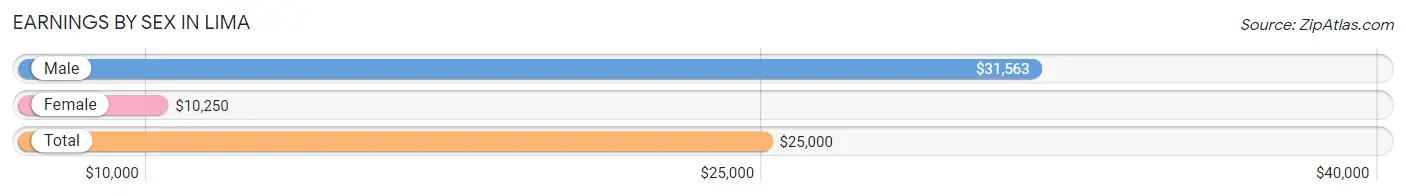
Earnings by Sex in Lima
Average Earnings in Lima are $25,000, $31,563 for men and $10,250 for women, a difference of 67.5%.
| Sex | Number | Average Earnings |
| Male | 61 (56.5%) | $31,563 |
| Female | 47 (43.5%) | $10,250 |
| Total | 108 (100.0%) | $25,000 |
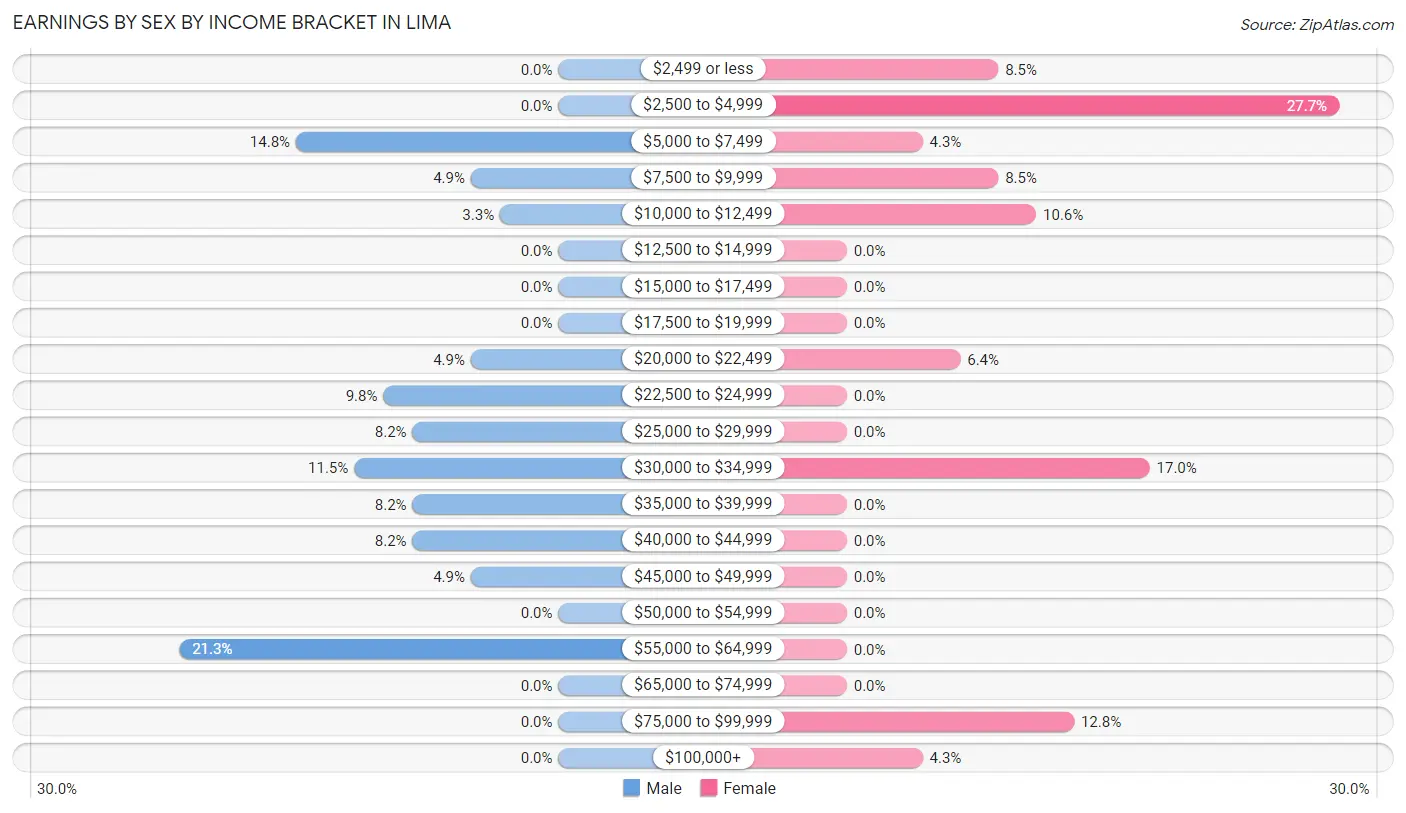
Earnings by Sex by Income Bracket in Lima
The most common earnings brackets in Lima are $55,000 to $64,999 for men (13 | 21.3%) and $2,500 to $4,999 for women (13 | 27.7%).
| Income | Male | Female |
| $2,499 or less | 0 (0.0%) | 4 (8.5%) |
| $2,500 to $4,999 | 0 (0.0%) | 13 (27.7%) |
| $5,000 to $7,499 | 9 (14.7%) | 2 (4.3%) |
| $7,500 to $9,999 | 3 (4.9%) | 4 (8.5%) |
| $10,000 to $12,499 | 2 (3.3%) | 5 (10.6%) |
| $12,500 to $14,999 | 0 (0.0%) | 0 (0.0%) |
| $15,000 to $17,499 | 0 (0.0%) | 0 (0.0%) |
| $17,500 to $19,999 | 0 (0.0%) | 0 (0.0%) |
| $20,000 to $22,499 | 3 (4.9%) | 3 (6.4%) |
| $22,500 to $24,999 | 6 (9.8%) | 0 (0.0%) |
| $25,000 to $29,999 | 5 (8.2%) | 0 (0.0%) |
| $30,000 to $34,999 | 7 (11.5%) | 8 (17.0%) |
| $35,000 to $39,999 | 5 (8.2%) | 0 (0.0%) |
| $40,000 to $44,999 | 5 (8.2%) | 0 (0.0%) |
| $45,000 to $49,999 | 3 (4.9%) | 0 (0.0%) |
| $50,000 to $54,999 | 0 (0.0%) | 0 (0.0%) |
| $55,000 to $64,999 | 13 (21.3%) | 0 (0.0%) |
| $65,000 to $74,999 | 0 (0.0%) | 0 (0.0%) |
| $75,000 to $99,999 | 0 (0.0%) | 6 (12.8%) |
| $100,000+ | 0 (0.0%) | 2 (4.3%) |
| Total | 61 (100.0%) | 47 (100.0%) |
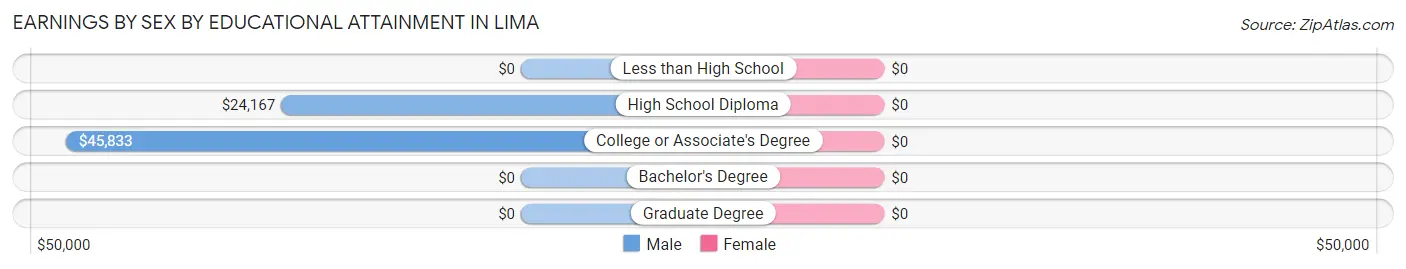
Earnings by Sex by Educational Attainment in Lima
| Educational Attainment | Male Income | Female Income |
| Less than High School | - | - |
| High School Diploma | $24,167 | $0 |
| College or Associate's Degree | $45,833 | $0 |
| Bachelor's Degree | - | - |
| Graduate Degree | - | - |
| Total | $31,250 | $0 |
Family Income in Lima
Family Income Brackets in Lima
According to the Lima family income data, there are 20 families falling into the $50,000 to $74,999 income range, which is the most common income bracket and makes up 33.9% of all families.
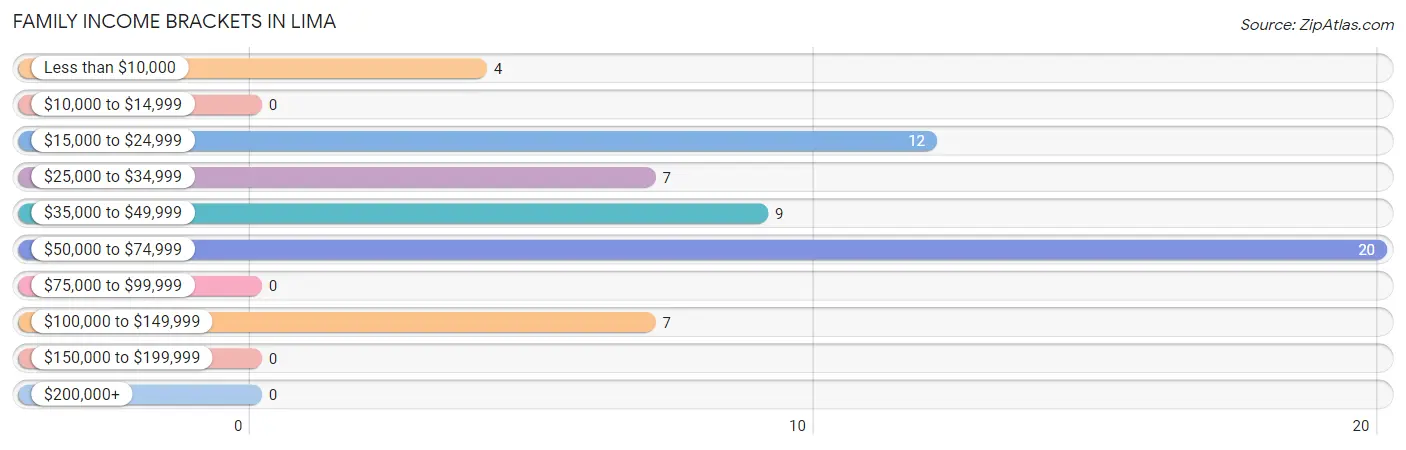
| Income Bracket | # Families | % Families |
| Less than $10,000 | 4 | 6.8% |
| $10,000 to $14,999 | 0 | 0.0% |
| $15,000 to $24,999 | 12 | 20.3% |
| $25,000 to $34,999 | 7 | 11.9% |
| $35,000 to $49,999 | 9 | 15.3% |
| $50,000 to $74,999 | 20 | 33.9% |
| $75,000 to $99,999 | 0 | 0.0% |
| $100,000 to $149,999 | 7 | 11.9% |
| $150,000 to $199,999 | 0 | 0.0% |
| $200,000+ | 0 | 0.0% |
Family Income by Famaliy Size in Lima
2-person families (50 | 84.8%) account for the highest median family income in Lima with $39,167 per family, while 2-person families (50 | 84.8%) have the highest median income of $19,584 per family member.
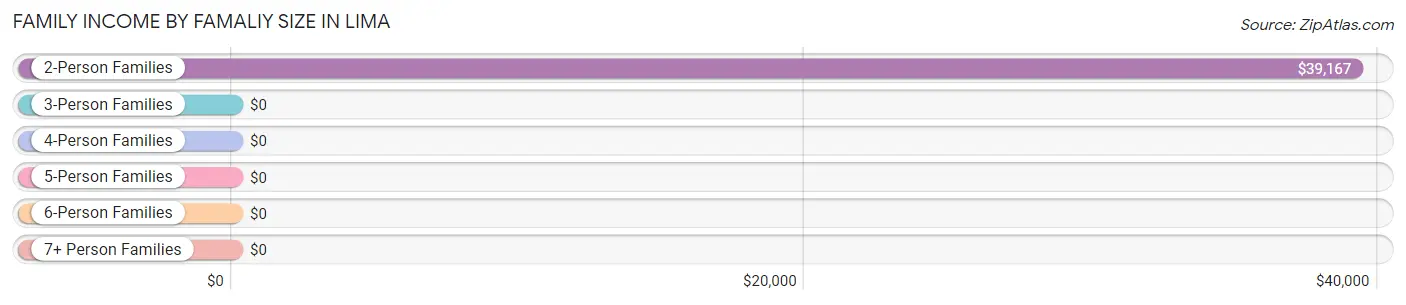
| Income Bracket | # Families | Median Income |
| 2-Person Families | 50 (84.8%) | $39,167 |
| 3-Person Families | 5 (8.5%) | $0 |
| 4-Person Families | 0 (0.0%) | $0 |
| 5-Person Families | 4 (6.8%) | $0 |
| 6-Person Families | 0 (0.0%) | $0 |
| 7+ Person Families | 0 (0.0%) | $0 |
| Total | 59 (100.0%) | $39,306 |
Family Income by Number of Earners in Lima
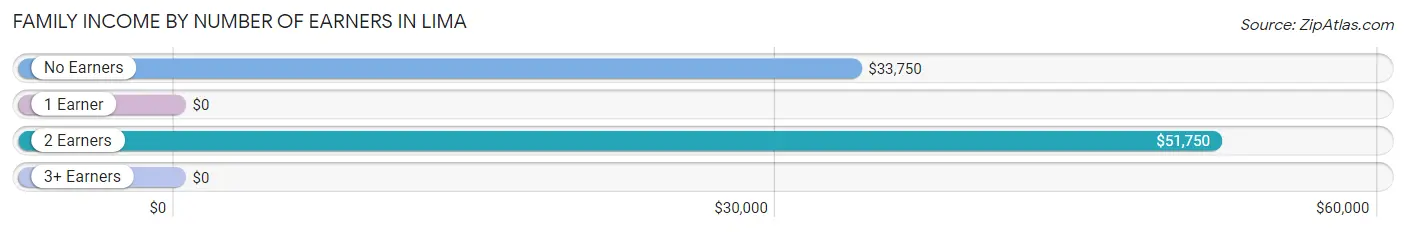
| Number of Earners | # Families | Median Income |
| No Earners | 14 (23.7%) | $33,750 |
| 1 Earner | 22 (37.3%) | $0 |
| 2 Earners | 23 (39.0%) | $51,750 |
| 3+ Earners | 0 (0.0%) | $0 |
| Total | 59 (100.0%) | $39,306 |
Household Income in Lima
Household Income Brackets in Lima
With 42 households falling in the category, the $50,000 to $74,999 income range is the most frequent in Lima, accounting for 35.9% of all households.
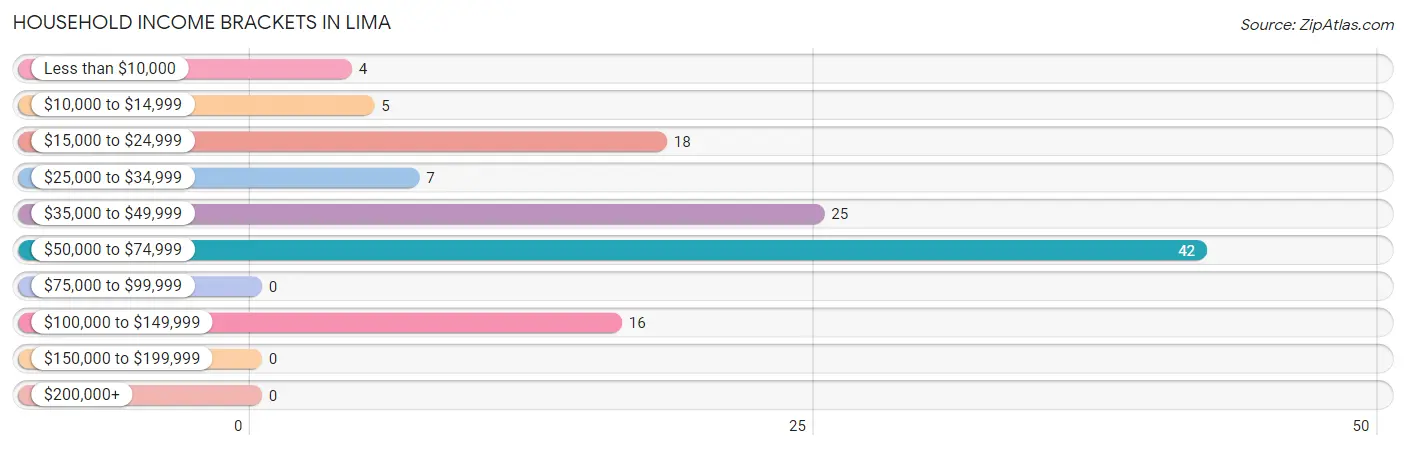
| Income Bracket | # Households | % Households |
| Less than $10,000 | 4 | 3.4% |
| $10,000 to $14,999 | 5 | 4.3% |
| $15,000 to $24,999 | 18 | 15.4% |
| $25,000 to $34,999 | 7 | 6.0% |
| $35,000 to $49,999 | 25 | 21.4% |
| $50,000 to $74,999 | 42 | 35.9% |
| $75,000 to $99,999 | 0 | 0.0% |
| $100,000 to $149,999 | 16 | 13.7% |
| $150,000 to $199,999 | 0 | 0.0% |
| $200,000+ | 0 | 0.0% |
Household Income by Householder Age in Lima
The median household income in Lima is $47,250, with the highest median household income of $58,438 found in the 45 to 64 years age bracket for the primary householder. A total of 39 households (33.3%) fall into this category. Meanwhile, the 25 to 44 years age bracket for the primary householder has the lowest median household income of $0, with 10 households (8.6%) in this group.
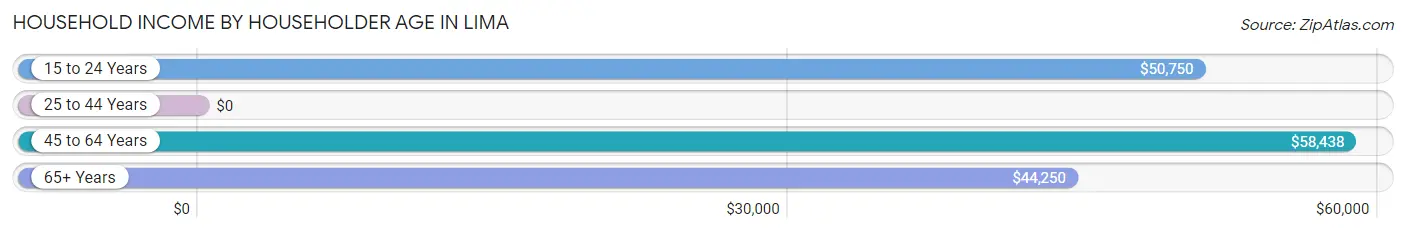
| Income Bracket | # Households | Median Income |
| 15 to 24 Years | 11 (9.4%) | $50,750 |
| 25 to 44 Years | 10 (8.6%) | $0 |
| 45 to 64 Years | 39 (33.3%) | $58,438 |
| 65+ Years | 57 (48.7%) | $44,250 |
| Total | 117 (100.0%) | $47,250 |
Poverty in Lima
Income Below Poverty by Sex and Age in Lima
With 24.8% poverty level for males and 24.0% for females among the residents of Lima, under 5 year old males and 6 to 11 year old females are the most vulnerable to poverty, with 18 males (100.0%) and 4 females (100.0%) in their respective age groups living below the poverty level.
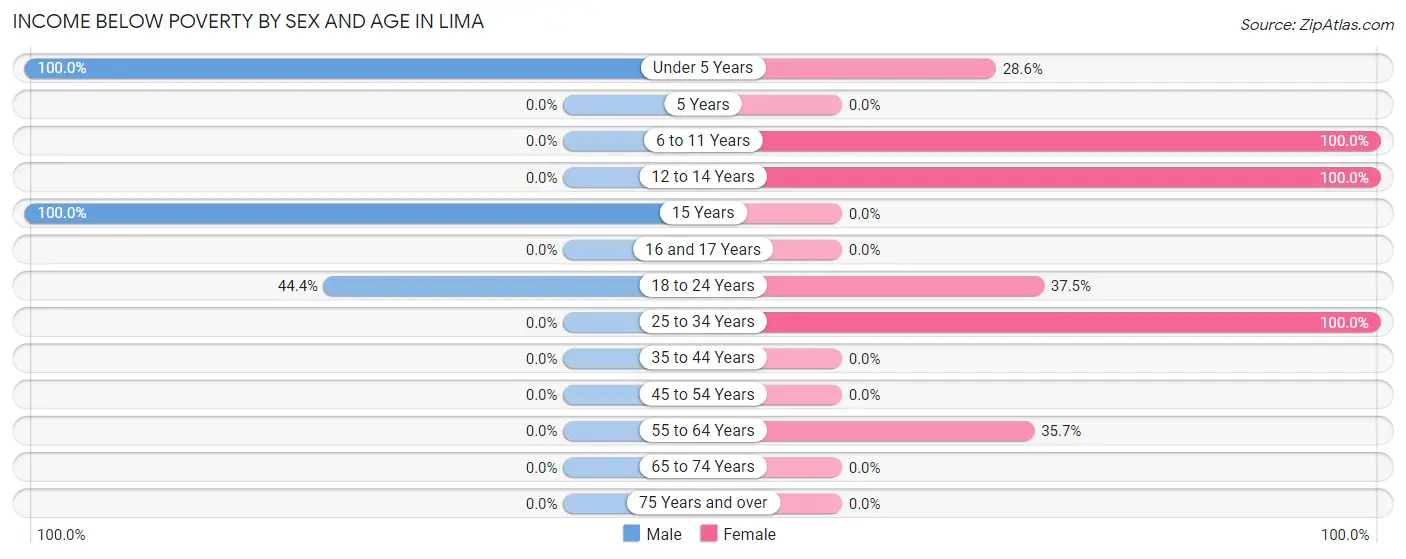
| Age Bracket | Male | Female |
| Under 5 Years | 18 (100.0%) | 2 (28.6%) |
| 5 Years | 0 (0.0%) | 0 (0.0%) |
| 6 to 11 Years | 0 (0.0%) | 4 (100.0%) |
| 12 to 14 Years | 0 (0.0%) | 5 (100.0%) |
| 15 Years | 6 (100.0%) | 0 (0.0%) |
| 16 and 17 Years | 0 (0.0%) | 0 (0.0%) |
| 18 to 24 Years | 4 (44.4%) | 3 (37.5%) |
| 25 to 34 Years | 0 (0.0%) | 4 (100.0%) |
| 35 to 44 Years | 0 (0.0%) | 0 (0.0%) |
| 45 to 54 Years | 0 (0.0%) | 0 (0.0%) |
| 55 to 64 Years | 0 (0.0%) | 5 (35.7%) |
| 65 to 74 Years | 0 (0.0%) | 0 (0.0%) |
| 75 Years and over | 0 (0.0%) | 0 (0.0%) |
| Total | 28 (24.8%) | 23 (24.0%) |
Income Above Poverty by Sex and Age in Lima
According to the poverty statistics in Lima, males aged 25 to 34 years and females aged 45 to 54 years are the age groups that are most secure financially, with 100.0% of males and 100.0% of females in these age groups living above the poverty line.
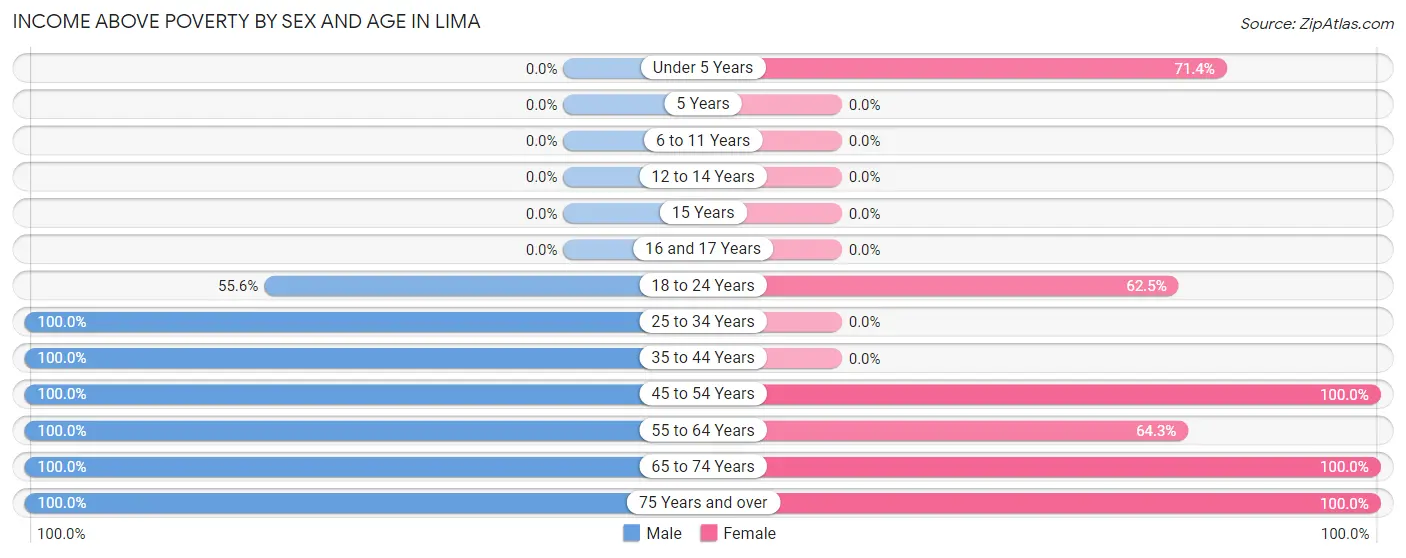
| Age Bracket | Male | Female |
| Under 5 Years | 0 (0.0%) | 5 (71.4%) |
| 5 Years | 0 (0.0%) | 0 (0.0%) |
| 6 to 11 Years | 0 (0.0%) | 0 (0.0%) |
| 12 to 14 Years | 0 (0.0%) | 0 (0.0%) |
| 15 Years | 0 (0.0%) | 0 (0.0%) |
| 16 and 17 Years | 0 (0.0%) | 0 (0.0%) |
| 18 to 24 Years | 5 (55.6%) | 5 (62.5%) |
| 25 to 34 Years | 9 (100.0%) | 0 (0.0%) |
| 35 to 44 Years | 5 (100.0%) | 0 (0.0%) |
| 45 to 54 Years | 16 (100.0%) | 15 (100.0%) |
| 55 to 64 Years | 9 (100.0%) | 9 (64.3%) |
| 65 to 74 Years | 27 (100.0%) | 23 (100.0%) |
| 75 Years and over | 14 (100.0%) | 16 (100.0%) |
| Total | 85 (75.2%) | 73 (76.0%) |
Income Below Poverty Among Married-Couple Families in Lima
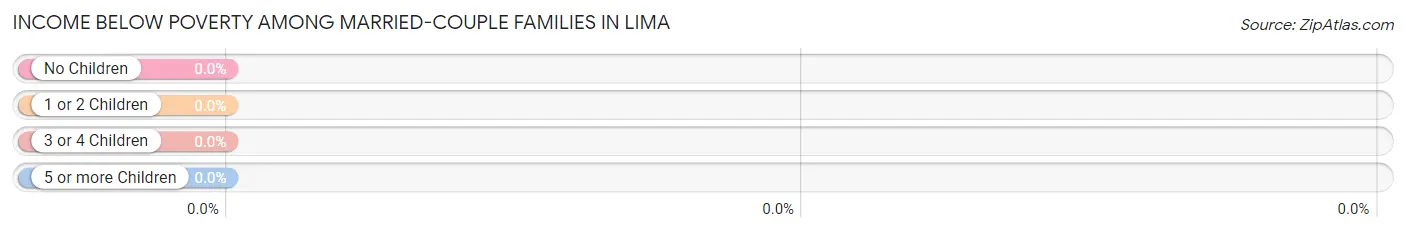
| Children | Above Poverty | Below Poverty |
| No Children | 46 (100.0%) | 0 (0.0%) |
| 1 or 2 Children | 5 (100.0%) | 0 (0.0%) |
| 3 or 4 Children | 0 (0.0%) | 0 (0.0%) |
| 5 or more Children | 0 (0.0%) | 0 (0.0%) |
| Total | 51 (100.0%) | 0 (0.0%) |
Income Below Poverty Among Single-Parent Households in Lima
According to the poverty data in Lima, 100.0% or 4 single-father households and 100.0% or 4 single-mother households are living below the poverty line. Among single-father households, those with 1 or 2 children have the highest poverty rate, with 4 households (100.0%) experiencing poverty. Likewise, among single-mother households, those with 3 or 4 children have the highest poverty rate, with 4 households (100.0%) falling below the poverty line.
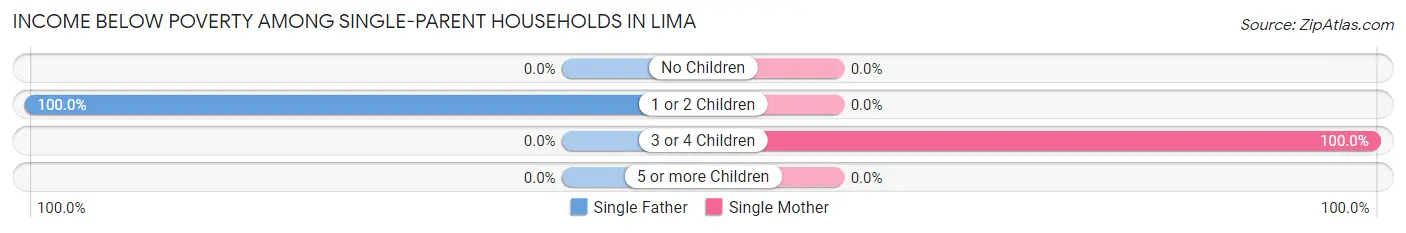
| Children | Single Father | Single Mother |
| No Children | 0 (0.0%) | 0 (0.0%) |
| 1 or 2 Children | 4 (100.0%) | 0 (0.0%) |
| 3 or 4 Children | 0 (0.0%) | 4 (100.0%) |
| 5 or more Children | 0 (0.0%) | 0 (0.0%) |
| Total | 4 (100.0%) | 4 (100.0%) |
Income Below Poverty Among Married-Couple vs Single-Parent Households in Lima
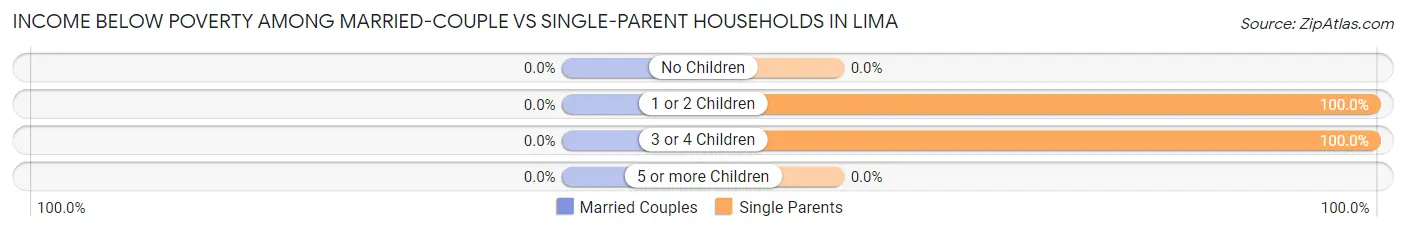
| Children | Married-Couple Families | Single-Parent Households |
| No Children | 0 (0.0%) | 0 (0.0%) |
| 1 or 2 Children | 0 (0.0%) | 4 (100.0%) |
| 3 or 4 Children | 0 (0.0%) | 4 (100.0%) |
| 5 or more Children | 0 (0.0%) | 0 (0.0%) |
| Total | 0 (0.0%) | 8 (100.0%) |
Race in Lima
The most populous races in Lima are White / Caucasian (204 | 97.6%), and Two or more Races (5 | 2.4%).
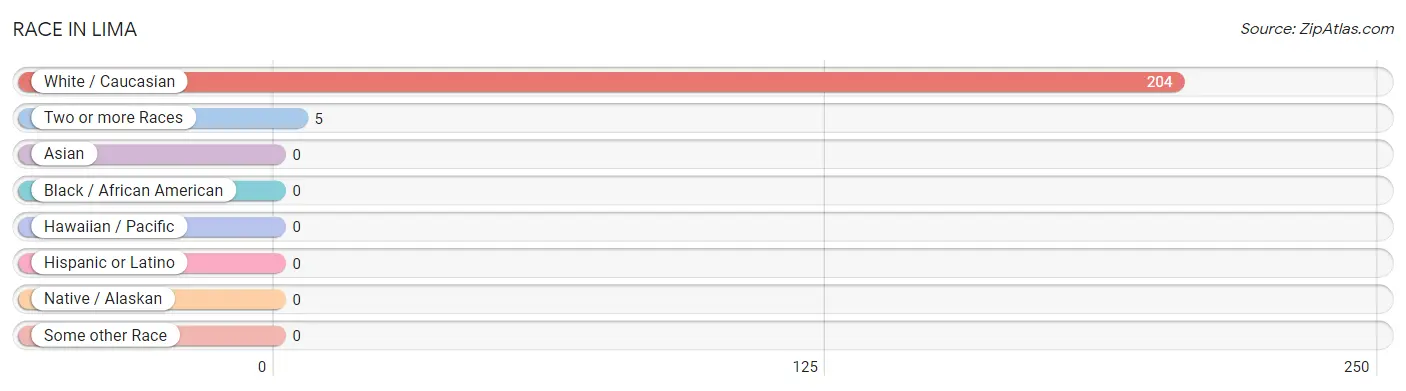
| Race | # Population | % Population |
| Asian | 0 | 0.0% |
| Black / African American | 0 | 0.0% |
| Hawaiian / Pacific | 0 | 0.0% |
| Hispanic or Latino | 0 | 0.0% |
| Native / Alaskan | 0 | 0.0% |
| White / Caucasian | 204 | 97.6% |
| Two or more Races | 5 | 2.4% |
| Some other Race | 0 | 0.0% |
| Total | 209 | 100.0% |
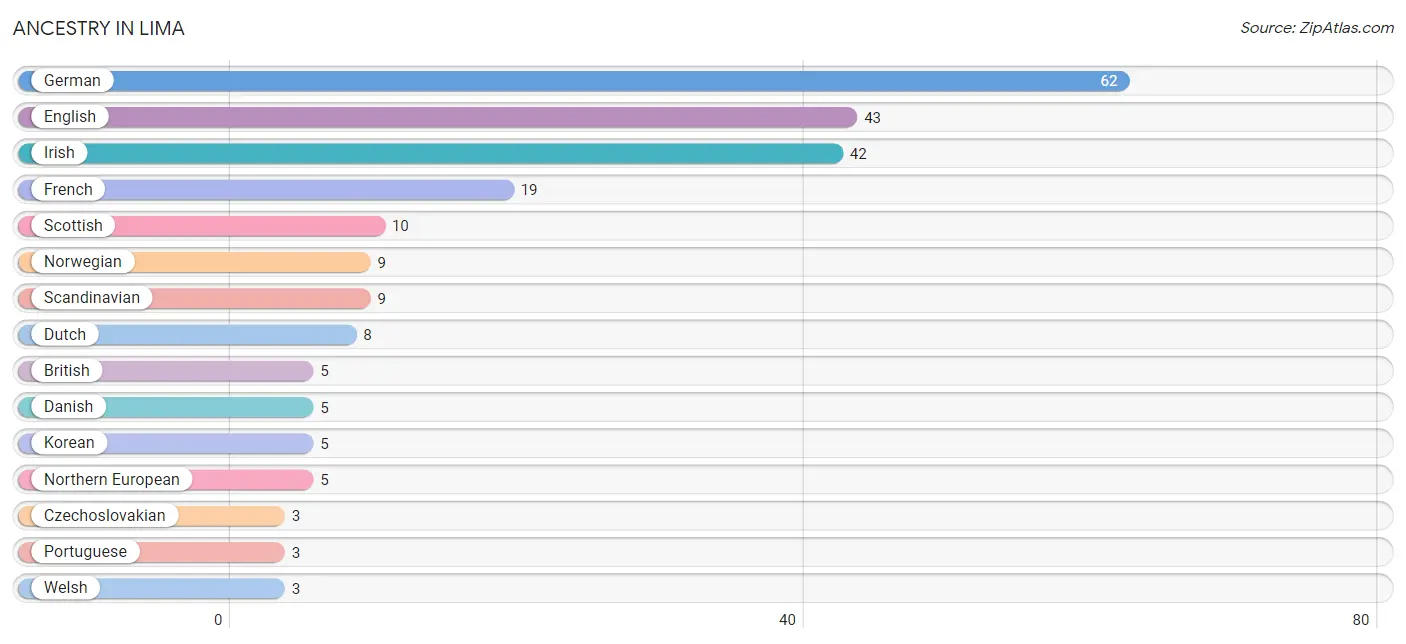
Ancestry in Lima
The most populous ancestries reported in Lima are German (62 | 29.7%), English (43 | 20.6%), Irish (42 | 20.1%), French (19 | 9.1%), and Scottish (10 | 4.8%), together accounting for 84.2% of all Lima residents.
| Ancestry | # Population | % Population |
| American | 2 | 1.0% |
| British | 5 | 2.4% |
| Czechoslovakian | 3 | 1.4% |
| Danish | 5 | 2.4% |
| Dutch | 8 | 3.8% |
| English | 43 | 20.6% |
| French | 19 | 9.1% |
| German | 62 | 29.7% |
| Irish | 42 | 20.1% |
| Korean | 5 | 2.4% |
| Northern European | 5 | 2.4% |
| Norwegian | 9 | 4.3% |
| Polish | 2 | 1.0% |
| Portuguese | 3 | 1.4% |
| Scandinavian | 9 | 4.3% |
| Scottish | 10 | 4.8% |
| Welsh | 3 | 1.4% | View All 17 Rows |
Immigrants in Lima

| Immigration Origin | # Population | % Population | View All 0 Rows |
Sex and Age in Lima
Sex and Age in Lima
The most populous age groups in Lima are Under 5 Years (18 | 15.9%) for men and 70 to 74 Years (13 | 13.5%) for women.
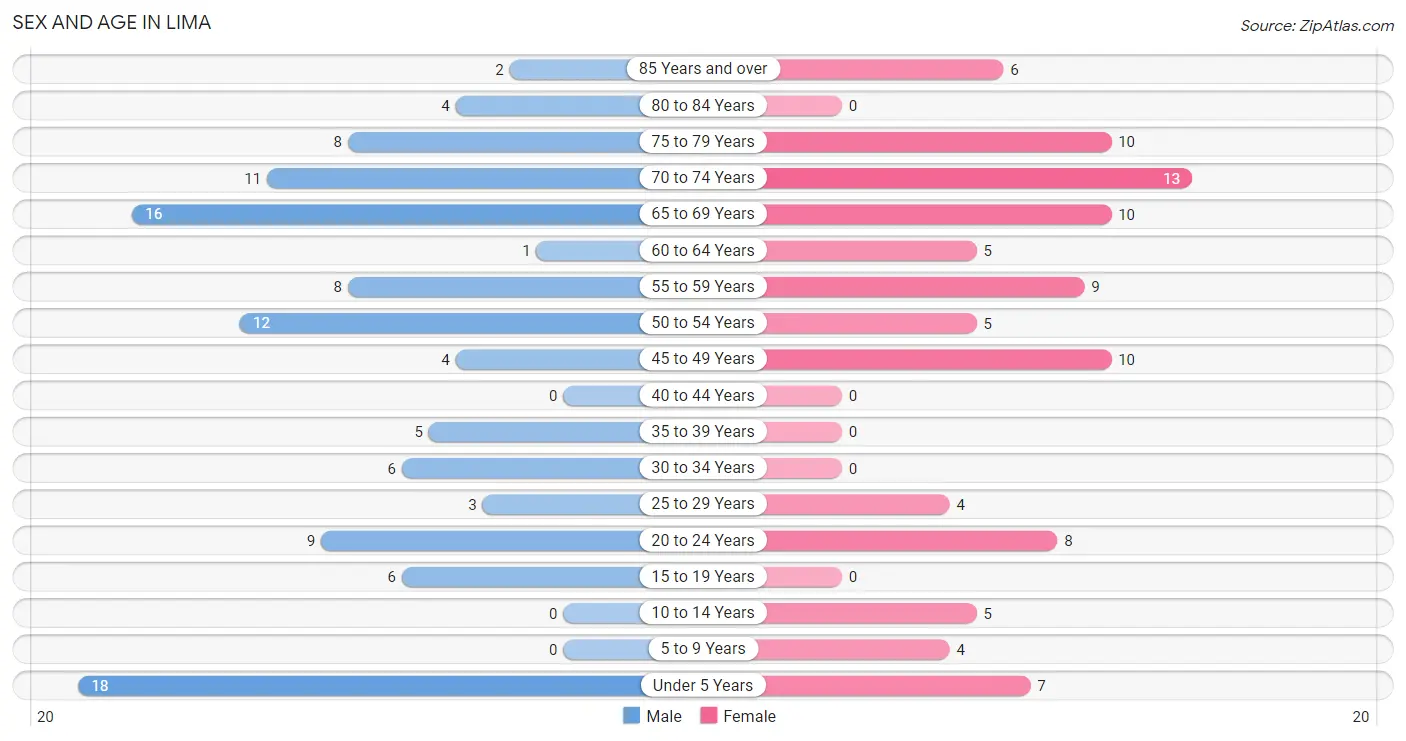
| Age Bracket | Male | Female |
| Under 5 Years | 18 (15.9%) | 7 (7.3%) |
| 5 to 9 Years | 0 (0.0%) | 4 (4.2%) |
| 10 to 14 Years | 0 (0.0%) | 5 (5.2%) |
| 15 to 19 Years | 6 (5.3%) | 0 (0.0%) |
| 20 to 24 Years | 9 (8.0%) | 8 (8.3%) |
| 25 to 29 Years | 3 (2.6%) | 4 (4.2%) |
| 30 to 34 Years | 6 (5.3%) | 0 (0.0%) |
| 35 to 39 Years | 5 (4.4%) | 0 (0.0%) |
| 40 to 44 Years | 0 (0.0%) | 0 (0.0%) |
| 45 to 49 Years | 4 (3.5%) | 10 (10.4%) |
| 50 to 54 Years | 12 (10.6%) | 5 (5.2%) |
| 55 to 59 Years | 8 (7.1%) | 9 (9.4%) |
| 60 to 64 Years | 1 (0.9%) | 5 (5.2%) |
| 65 to 69 Years | 16 (14.2%) | 10 (10.4%) |
| 70 to 74 Years | 11 (9.7%) | 13 (13.5%) |
| 75 to 79 Years | 8 (7.1%) | 10 (10.4%) |
| 80 to 84 Years | 4 (3.5%) | 0 (0.0%) |
| 85 Years and over | 2 (1.8%) | 6 (6.2%) |
| Total | 113 (100.0%) | 96 (100.0%) |
Families and Households in Lima
Median Family Size in Lima
The median family size in Lima is 2.42 persons per family, with single female/mother families (4 | 6.8%) accounting for the largest median family size of 9.25 persons per family. On the other hand, single male/father families (4 | 6.8%) represent the smallest median family size with 1.50 persons per family.
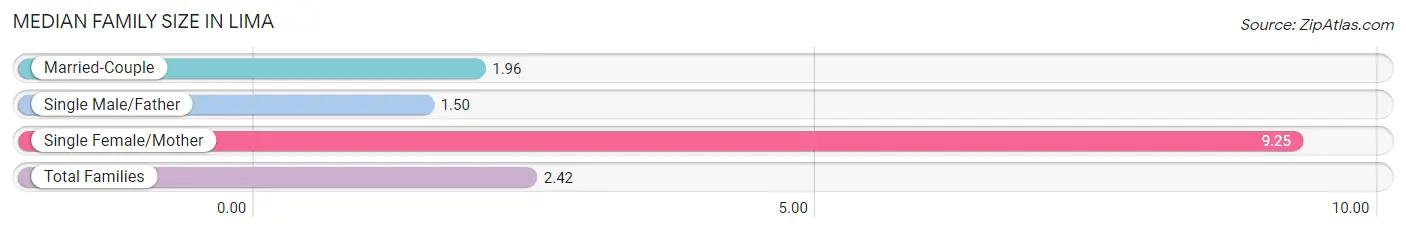
| Family Type | # Families | Family Size |
| Married-Couple | 51 (86.4%) | 1.96 |
| Single Male/Father | 4 (6.8%) | 1.50 |
| Single Female/Mother | 4 (6.8%) | 9.25 |
| Total Families | 59 (100.0%) | 2.42 |
Median Household Size in Lima
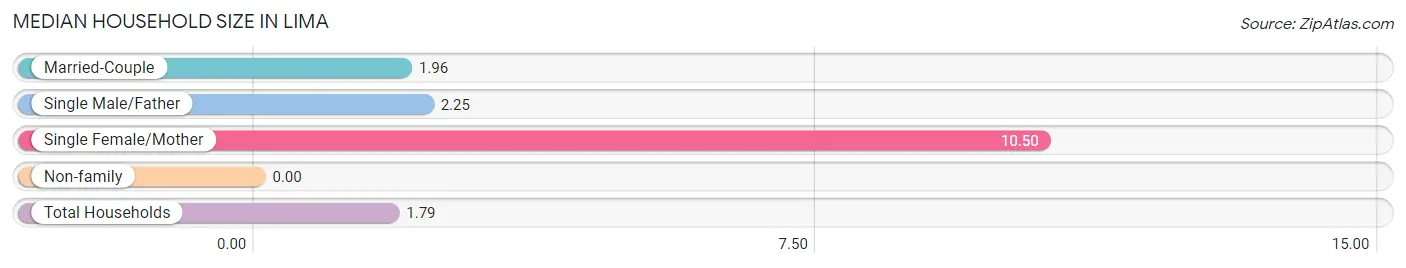
| Household Type | # Households | Household Size |
| Married-Couple | 51 (43.6%) | 1.96 |
| Single Male/Father | 4 (3.4%) | 2.25 |
| Single Female/Mother | 4 (3.4%) | 10.50 |
| Non-family | 58 (49.6%) | - |
| Total Households | 117 (100.0%) | 1.79 |
Household Size by Marriage Status in Lima
Out of a total of 117 households in Lima, 59 (50.4%) are family households, while 58 (49.6%) are nonfamily households. The most numerous type of family households are 2-person households, comprising 46, and the most common type of nonfamily households are 1-person households, comprising 58.
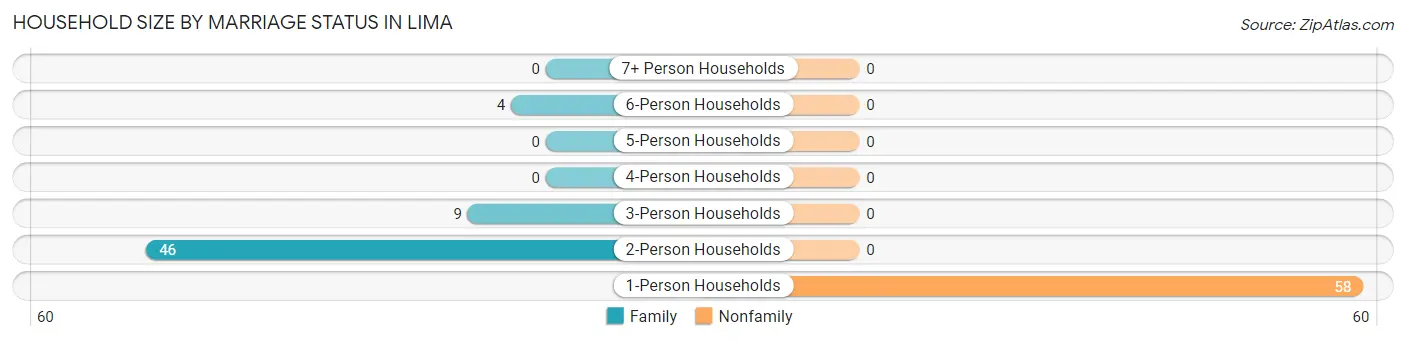
| Household Size | Family Households | Nonfamily Households |
| 1-Person Households | - | 58 (49.6%) |
| 2-Person Households | 46 (39.3%) | 0 (0.0%) |
| 3-Person Households | 9 (7.7%) | 0 (0.0%) |
| 4-Person Households | 0 (0.0%) | 0 (0.0%) |
| 5-Person Households | 0 (0.0%) | 0 (0.0%) |
| 6-Person Households | 4 (3.4%) | 0 (0.0%) |
| 7+ Person Households | 0 (0.0%) | 0 (0.0%) |
| Total | 59 (50.4%) | 58 (49.6%) |
Female Fertility in Lima
Fertility by Age in Lima
Average fertility rate in Lima is 222.0 births per 1,000 women. Women in the age bracket of 20 to 34 years have the highest fertility rate with 500.0 births per 1,000 women. Women in the age bracket of 20 to 34 years acount for 100.0% of all women with births.
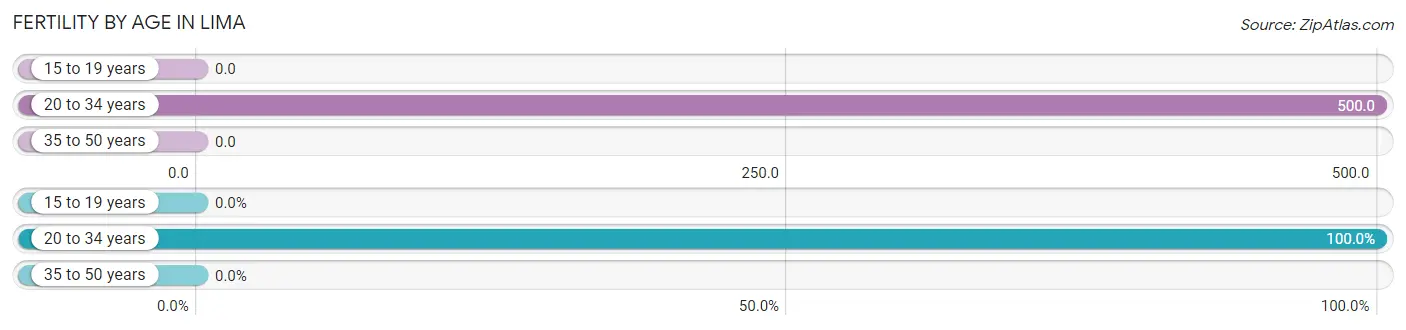
| Age Bracket | Women with Births | Births / 1,000 Women |
| 15 to 19 years | 0 (0.0%) | 0.0 |
| 20 to 34 years | 6 (100.0%) | 500.0 |
| 35 to 50 years | 0 (0.0%) | 0.0 |
| Total | 6 (100.0%) | 222.0 |
Fertility by Age by Marriage Status in Lima
50.0% of women with births (6) in Lima are married. The highest percentage of unmarried women with births falls into 20 to 34 years age bracket with 50.0% of them unmarried at the time of birth, while the lowest percentage of unmarried women with births belong to 20 to 34 years age bracket with 50.0% of them unmarried.
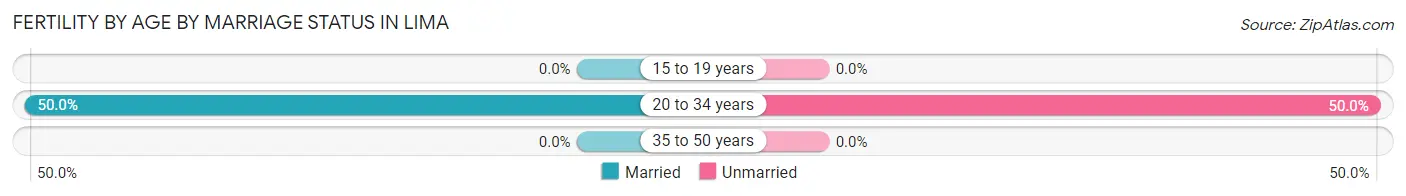
| Age Bracket | Married | Unmarried |
| 15 to 19 years | 0 (0.0%) | 0 (0.0%) |
| 20 to 34 years | 3 (50.0%) | 3 (50.0%) |
| 35 to 50 years | 0 (0.0%) | 0 (0.0%) |
| Total | 3 (50.0%) | 3 (50.0%) |
Fertility by Education in Lima
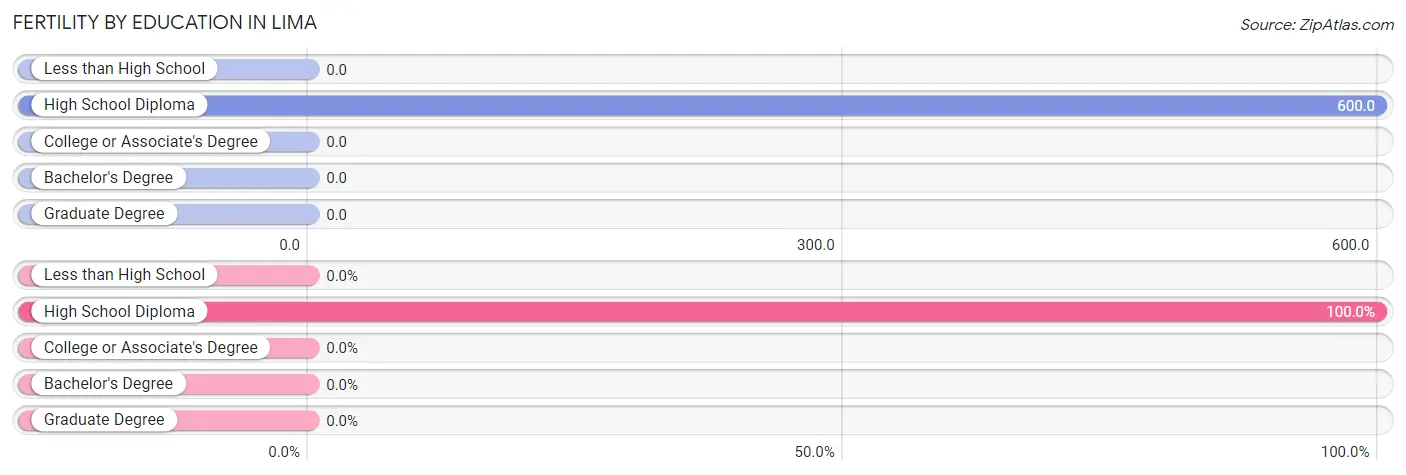
| Educational Attainment | Women with Births | Births / 1,000 Women |
| Less than High School | 0 (0.0%) | 0.0 |
| High School Diploma | 6 (100.0%) | 600.0 |
| College or Associate's Degree | 0 (0.0%) | 0.0 |
| Bachelor's Degree | 0 (0.0%) | 0.0 |
| Graduate Degree | 0 (0.0%) | 0.0 |
| Total | 6 (100.0%) | 222.0 |
Fertility by Education by Marriage Status in Lima
50.0% of women with births in Lima are unmarried. Women with the educational attainment of high school diploma are most likely to be married with 50.0% of them married at childbirth, while women with the educational attainment of high school diploma are least likely to be married with 50.0% of them unmarried at childbirth.
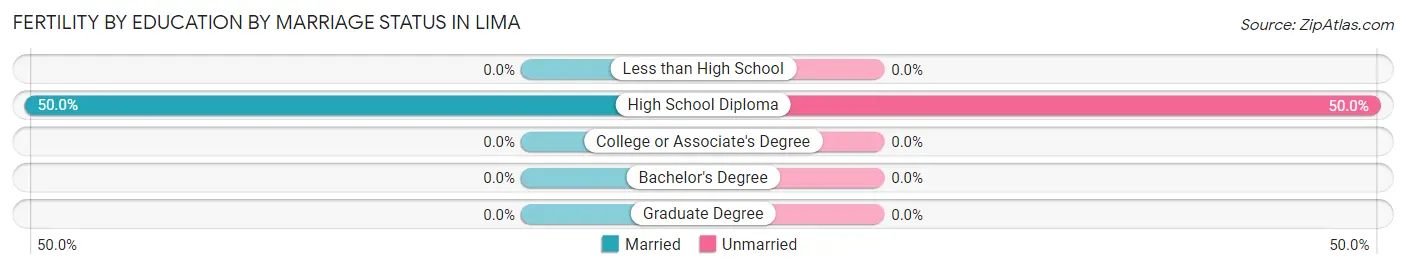
| Educational Attainment | Married | Unmarried |
| Less than High School | 0 (0.0%) | 0 (0.0%) |
| High School Diploma | 3 (50.0%) | 3 (50.0%) |
| College or Associate's Degree | 0 (0.0%) | 0 (0.0%) |
| Bachelor's Degree | 0 (0.0%) | 0 (0.0%) |
| Graduate Degree | 0 (0.0%) | 0 (0.0%) |
| Total | 3 (50.0%) | 3 (50.0%) |
Employment Characteristics in Lima
Employment by Class of Employer in Lima
Among the 74 employed individuals in Lima, private company employees (27 | 36.5%), state government employees (25 | 33.8%), and local government employees (9 | 12.2%) make up the most common classes of employment.

| Employer Class | # Employees | % Employees |
| Private Company Employees | 27 | 36.5% |
| Self-Employed (Incorporated) | 1 | 1.3% |
| Self-Employed (Not Incorporated) | 7 | 9.5% |
| Not-for-profit Organizations | 0 | 0.0% |
| Local Government Employees | 9 | 12.2% |
| State Government Employees | 25 | 33.8% |
| Federal Government Employees | 5 | 6.8% |
| Unpaid Family Workers | 0 | 0.0% |
| Total | 74 | 100.0% |
Employment Status by Age in Lima
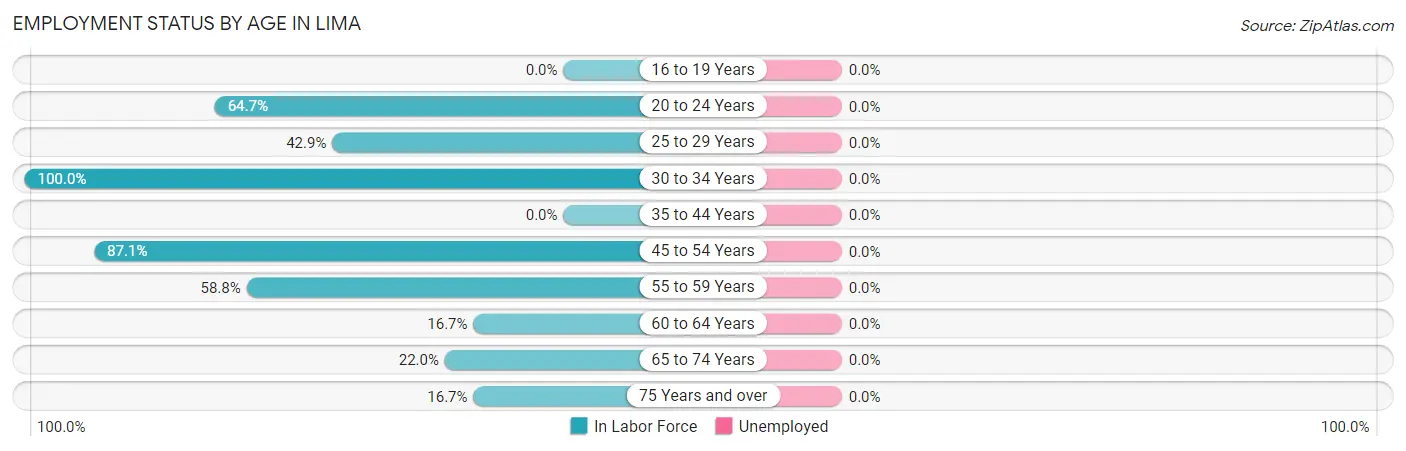
| Age Bracket | In Labor Force | Unemployed |
| 16 to 19 Years | 0 (0.0%) | 0 (0.0%) |
| 20 to 24 Years | 11 (64.7%) | 0 (0.0%) |
| 25 to 29 Years | 3 (42.9%) | 0 (0.0%) |
| 30 to 34 Years | 6 (100.0%) | 0 (0.0%) |
| 35 to 44 Years | 0 (0.0%) | 0 (0.0%) |
| 45 to 54 Years | 27 (87.1%) | 0 (0.0%) |
| 55 to 59 Years | 10 (58.8%) | 0 (0.0%) |
| 60 to 64 Years | 1 (16.7%) | 0 (0.0%) |
| 65 to 74 Years | 11 (22.0%) | 0 (0.0%) |
| 75 Years and over | 5 (16.7%) | 0 (0.0%) |
| Total | 74 (43.8%) | 0 (0.0%) |
Employment Status by Educational Attainment in Lima
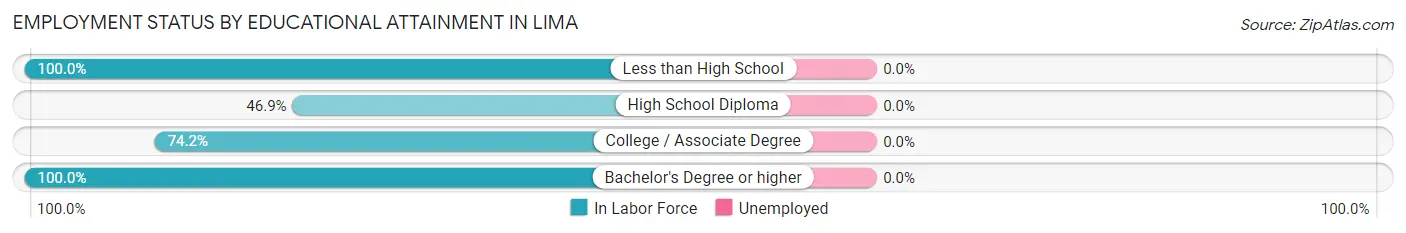
| Educational Attainment | In Labor Force | Unemployed |
| Less than High School | 3 (100.0%) | 0 (0.0%) |
| High School Diploma | 15 (46.9%) | 0 (0.0%) |
| College / Associate Degree | 23 (74.2%) | 0 (0.0%) |
| Bachelor's Degree or higher | 6 (100.0%) | 0 (0.0%) |
| Total | 47 (65.3%) | 0 (0.0%) |
Employment Occupations by Sex in Lima
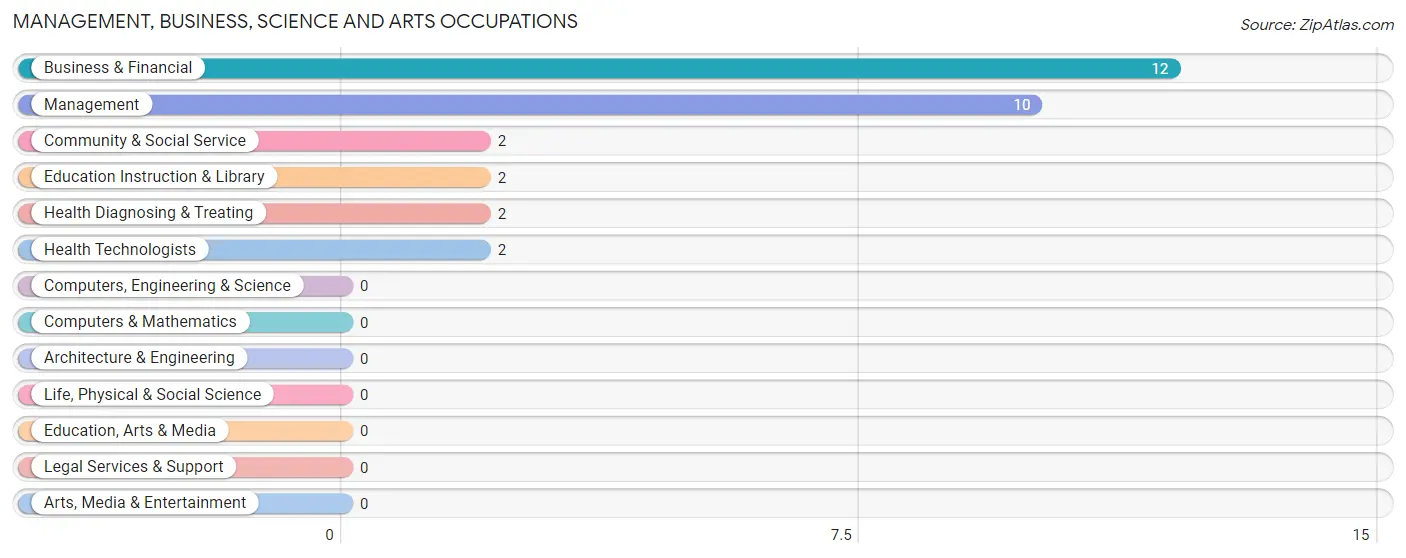
Management, Business, Science and Arts Occupations
The most common Management, Business, Science and Arts occupations in Lima are Business & Financial (12 | 16.2%), Management (10 | 13.5%), Community & Social Service (2 | 2.7%), Education Instruction & Library (2 | 2.7%), and Health Diagnosing & Treating (2 | 2.7%).
Management, Business, Science and Arts Occupations by Sex
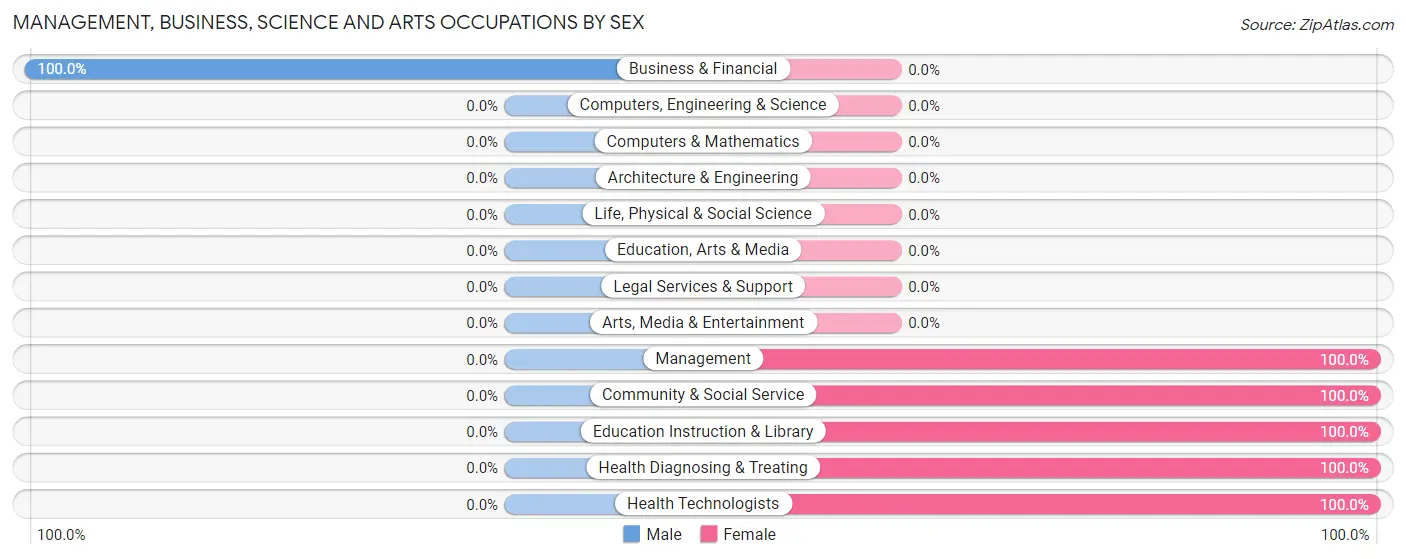
| Occupation | Male | Female |
| Management | 0 (0.0%) | 10 (100.0%) |
| Business & Financial | 12 (100.0%) | 0 (0.0%) |
| Computers, Engineering & Science | 0 (0.0%) | 0 (0.0%) |
| Computers & Mathematics | 0 (0.0%) | 0 (0.0%) |
| Architecture & Engineering | 0 (0.0%) | 0 (0.0%) |
| Life, Physical & Social Science | 0 (0.0%) | 0 (0.0%) |
| Community & Social Service | 0 (0.0%) | 2 (100.0%) |
| Education, Arts & Media | 0 (0.0%) | 0 (0.0%) |
| Legal Services & Support | 0 (0.0%) | 0 (0.0%) |
| Education Instruction & Library | 0 (0.0%) | 2 (100.0%) |
| Arts, Media & Entertainment | 0 (0.0%) | 0 (0.0%) |
| Health Diagnosing & Treating | 0 (0.0%) | 2 (100.0%) |
| Health Technologists | 0 (0.0%) | 2 (100.0%) |
| Total (Category) | 12 (46.2%) | 14 (53.8%) |
| Total (Overall) | 41 (55.4%) | 33 (44.6%) |
Services Occupations
The most common Services occupations in Lima are Food Preparation & Serving (6 | 8.1%), and Cleaning & Maintenance (6 | 8.1%).
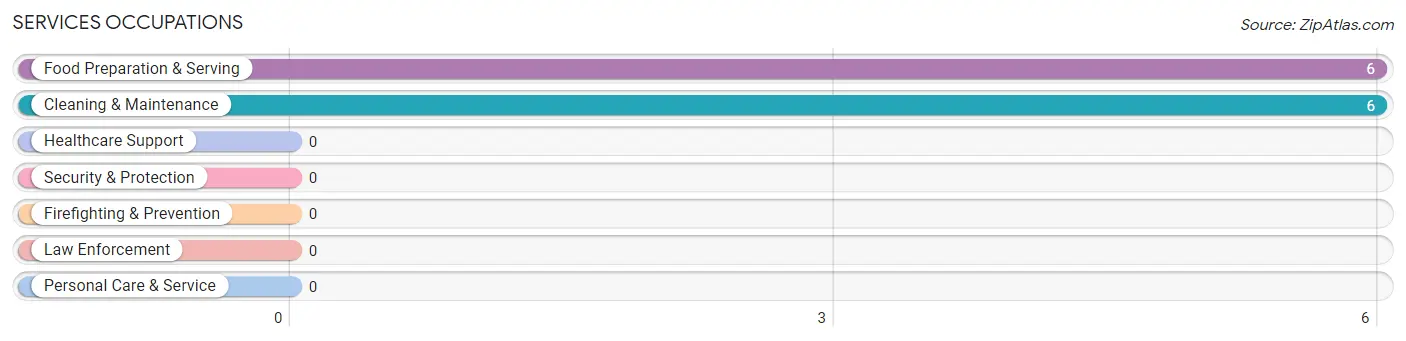
Services Occupations by Sex
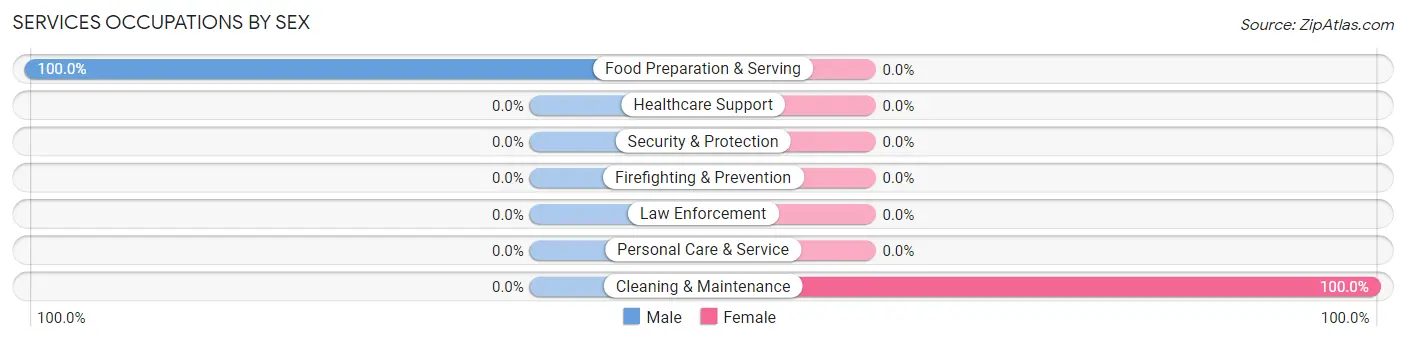
| Occupation | Male | Female |
| Healthcare Support | 0 (0.0%) | 0 (0.0%) |
| Security & Protection | 0 (0.0%) | 0 (0.0%) |
| Firefighting & Prevention | 0 (0.0%) | 0 (0.0%) |
| Law Enforcement | 0 (0.0%) | 0 (0.0%) |
| Food Preparation & Serving | 6 (100.0%) | 0 (0.0%) |
| Cleaning & Maintenance | 0 (0.0%) | 6 (100.0%) |
| Personal Care & Service | 0 (0.0%) | 0 (0.0%) |
| Total (Category) | 6 (50.0%) | 6 (50.0%) |
| Total (Overall) | 41 (55.4%) | 33 (44.6%) |
Sales and Office Occupations
The most common Sales and Office occupations in Lima are Office & Administration (9 | 12.2%), and Sales & Related (4 | 5.4%).

Sales and Office Occupations by Sex

| Occupation | Male | Female |
| Sales & Related | 0 (0.0%) | 4 (100.0%) |
| Office & Administration | 0 (0.0%) | 9 (100.0%) |
| Total (Category) | 0 (0.0%) | 13 (100.0%) |
| Total (Overall) | 41 (55.4%) | 33 (44.6%) |
Natural Resources, Construction and Maintenance Occupations
The most common Natural Resources, Construction and Maintenance occupations in Lima are Construction & Extraction (13 | 17.6%), and Installation, Maintenance & Repair (4 | 5.4%).
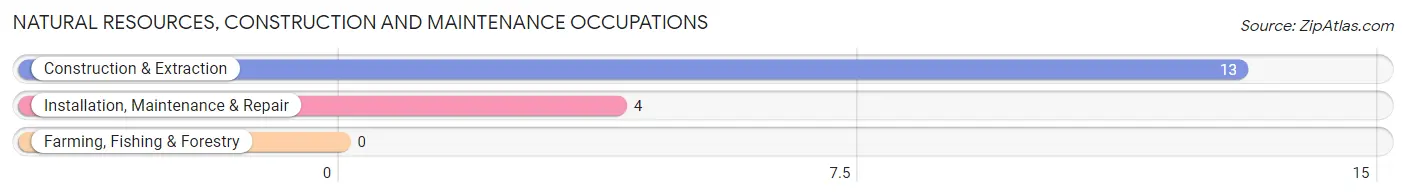
Natural Resources, Construction and Maintenance Occupations by Sex
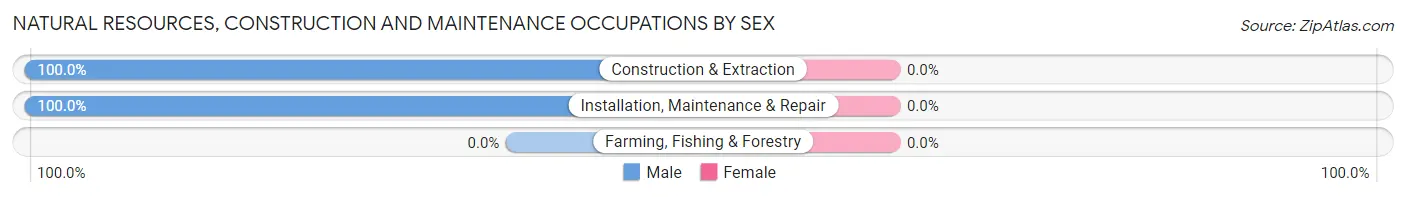
| Occupation | Male | Female |
| Farming, Fishing & Forestry | 0 (0.0%) | 0 (0.0%) |
| Construction & Extraction | 13 (100.0%) | 0 (0.0%) |
| Installation, Maintenance & Repair | 4 (100.0%) | 0 (0.0%) |
| Total (Category) | 17 (100.0%) | 0 (0.0%) |
| Total (Overall) | 41 (55.4%) | 33 (44.6%) |
Production, Transportation and Moving Occupations
The most common Production, Transportation and Moving occupations in Lima are , and Material Moving (6 | 8.1%).
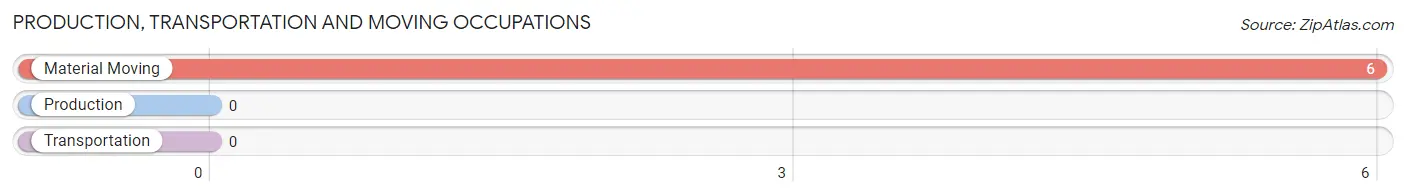
Production, Transportation and Moving Occupations by Sex
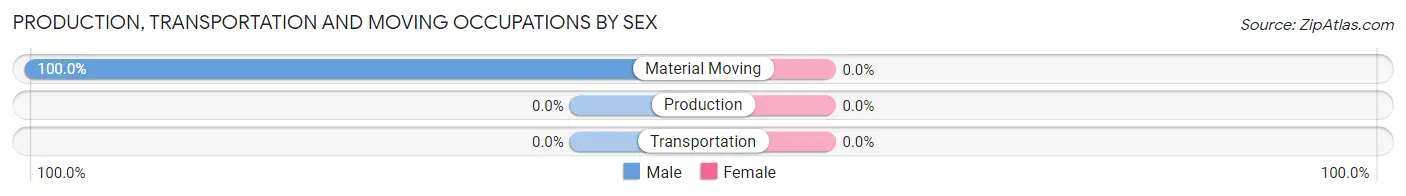
| Occupation | Male | Female |
| Production | 0 (0.0%) | 0 (0.0%) |
| Transportation | 0 (0.0%) | 0 (0.0%) |
| Material Moving | 6 (100.0%) | 0 (0.0%) |
| Total (Category) | 6 (100.0%) | 0 (0.0%) |
| Total (Overall) | 41 (55.4%) | 33 (44.6%) |
Employment Industries by Sex in Lima
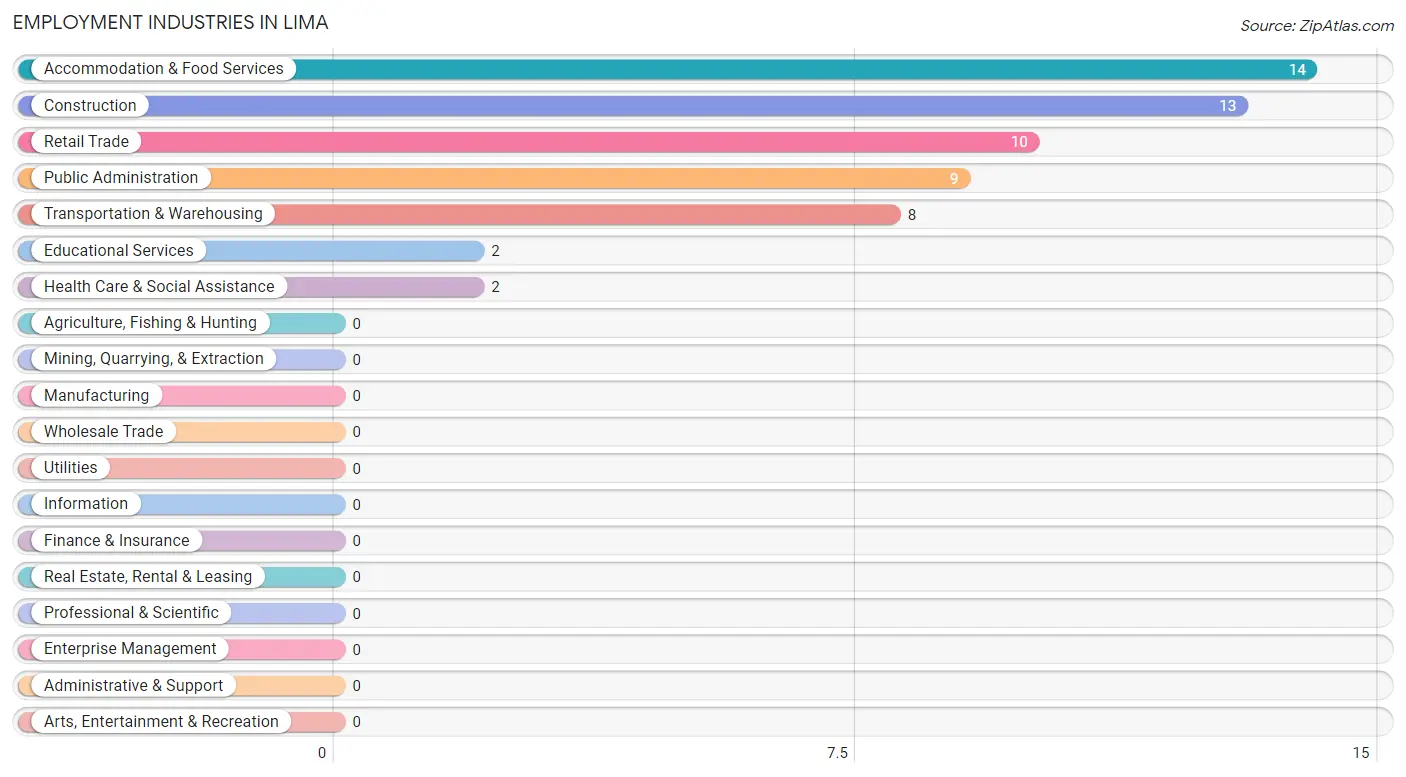
Employment Industries in Lima
The major employment industries in Lima include Accommodation & Food Services (14 | 18.9%), Construction (13 | 17.6%), Retail Trade (10 | 13.5%), Public Administration (9 | 12.2%), and Transportation & Warehousing (8 | 10.8%).
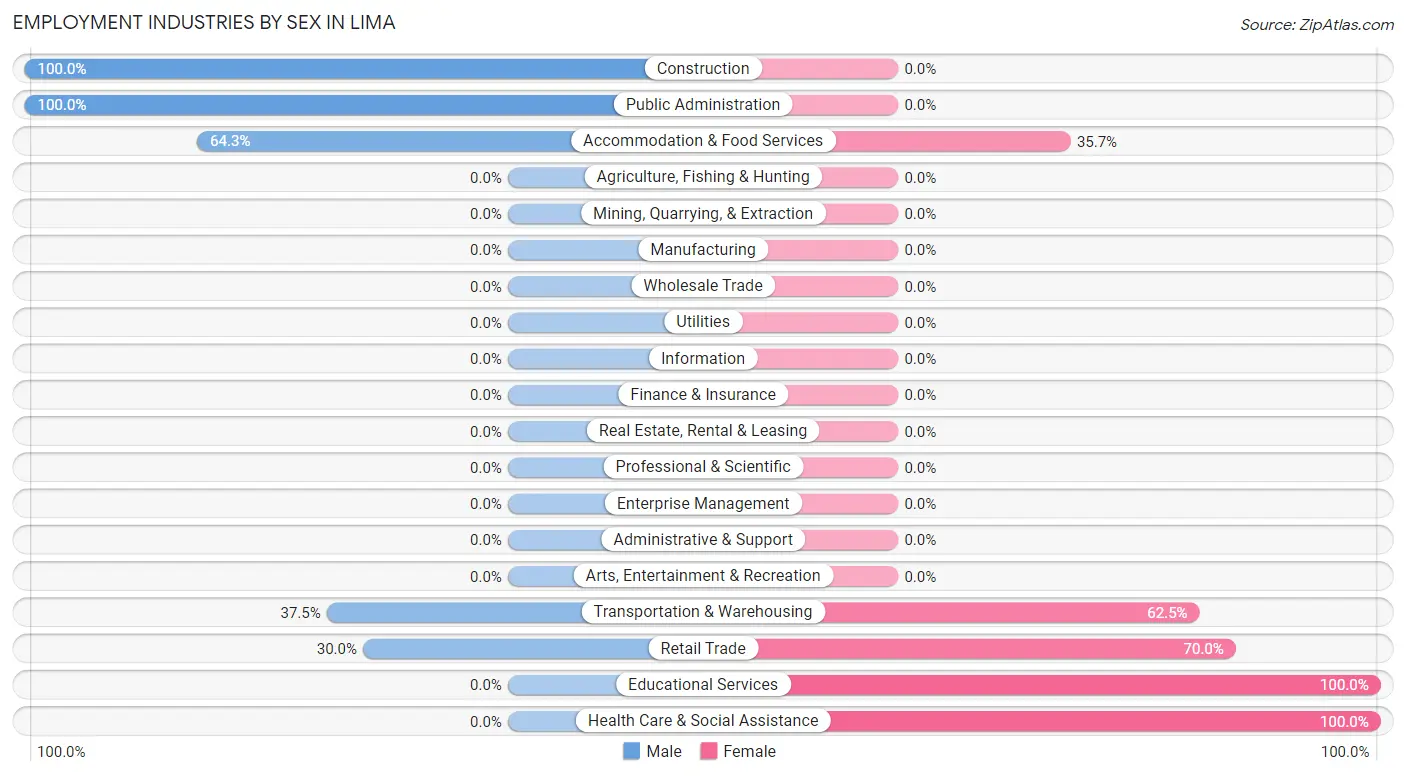
Employment Industries by Sex in Lima
The Lima industries that see more men than women are Construction (100.0%), Public Administration (100.0%), and Accommodation & Food Services (64.3%), whereas the industries that tend to have a higher number of women are Educational Services (100.0%), Health Care & Social Assistance (100.0%), and Retail Trade (70.0%).
| Industry | Male | Female |
| Agriculture, Fishing & Hunting | 0 (0.0%) | 0 (0.0%) |
| Mining, Quarrying, & Extraction | 0 (0.0%) | 0 (0.0%) |
| Construction | 13 (100.0%) | 0 (0.0%) |
| Manufacturing | 0 (0.0%) | 0 (0.0%) |
| Wholesale Trade | 0 (0.0%) | 0 (0.0%) |
| Retail Trade | 3 (30.0%) | 7 (70.0%) |
| Transportation & Warehousing | 3 (37.5%) | 5 (62.5%) |
| Utilities | 0 (0.0%) | 0 (0.0%) |
| Information | 0 (0.0%) | 0 (0.0%) |
| Finance & Insurance | 0 (0.0%) | 0 (0.0%) |
| Real Estate, Rental & Leasing | 0 (0.0%) | 0 (0.0%) |
| Professional & Scientific | 0 (0.0%) | 0 (0.0%) |
| Enterprise Management | 0 (0.0%) | 0 (0.0%) |
| Administrative & Support | 0 (0.0%) | 0 (0.0%) |
| Educational Services | 0 (0.0%) | 2 (100.0%) |
| Health Care & Social Assistance | 0 (0.0%) | 2 (100.0%) |
| Arts, Entertainment & Recreation | 0 (0.0%) | 0 (0.0%) |
| Accommodation & Food Services | 9 (64.3%) | 5 (35.7%) |
| Public Administration | 9 (100.0%) | 0 (0.0%) |
| Total | 41 (55.4%) | 33 (44.6%) |
Education in Lima
School Enrollment in Lima
| School Level | # Students | % Students |
| Nursery / Preschool | 0 | 0.0% |
| Kindergarten | 0 | 0.0% |
| Elementary School | 0 | 0.0% |
| Middle School | 0 | 0.0% |
| High School | 0 | 0.0% |
| College / Undergraduate | 0 | 0.0% |
| Graduate / Professional | 0 | 0.0% |
| Total | 0 | 0.0% |
School Enrollment by Age by Funding Source in Lima
| Age Bracket | Public School | Private School |
| 3 to 4 Year Olds | 0 (0.0%) | 0 (0.0%) |
| 5 to 9 Year Old | 0 (0.0%) | 0 (0.0%) |
| 10 to 14 Year Olds | 0 (0.0%) | 0 (0.0%) |
| 15 to 17 Year Olds | 0 (0.0%) | 0 (0.0%) |
| 18 to 19 Year Olds | 0 (0.0%) | 0 (0.0%) |
| 20 to 24 Year Olds | 0 (0.0%) | 0 (0.0%) |
| 25 to 34 Year Olds | 0 (0.0%) | 0 (0.0%) |
| 35 Years and over | 0 (0.0%) | 0 (0.0%) |
| Total | 0 (0.0%) | 0 (0.0%) |
Educational Attainment by Field of Study in Lima
Business (11 | 45.8%), arts & humanities (6 | 25.0%), bio, nature & agricultural (4 | 16.7%), and education (3 | 12.5%) are the most common fields of study among 24 individuals in Lima who have obtained a bachelor's degree or higher.
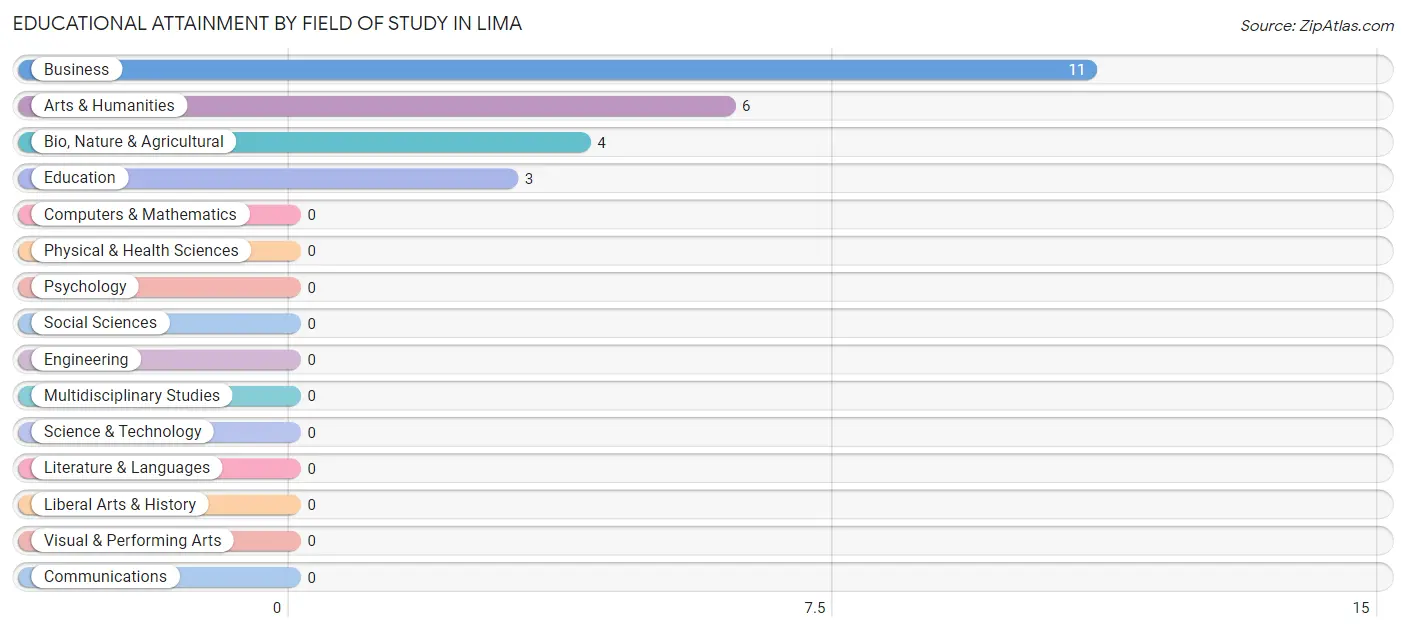
| Field of Study | # Graduates | % Graduates |
| Computers & Mathematics | 0 | 0.0% |
| Bio, Nature & Agricultural | 4 | 16.7% |
| Physical & Health Sciences | 0 | 0.0% |
| Psychology | 0 | 0.0% |
| Social Sciences | 0 | 0.0% |
| Engineering | 0 | 0.0% |
| Multidisciplinary Studies | 0 | 0.0% |
| Science & Technology | 0 | 0.0% |
| Business | 11 | 45.8% |
| Education | 3 | 12.5% |
| Literature & Languages | 0 | 0.0% |
| Liberal Arts & History | 0 | 0.0% |
| Visual & Performing Arts | 0 | 0.0% |
| Communications | 0 | 0.0% |
| Arts & Humanities | 6 | 25.0% |
| Total | 24 | 100.0% |
Transportation & Commute in Lima
Vehicle Availability by Sex in Lima
The most prevalent vehicle ownership categories in Lima are males with 3 vehicles (17, accounting for 41.5%) and females with 3 vehicles (11, making up 51.5%).
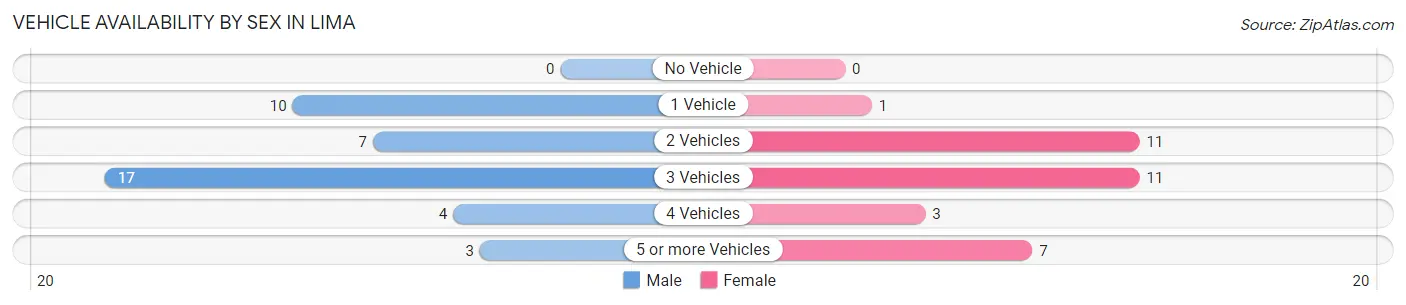
| Vehicles Available | Male | Female |
| No Vehicle | 0 (0.0%) | 0 (0.0%) |
| 1 Vehicle | 10 (24.4%) | 1 (3.0%) |
| 2 Vehicles | 7 (17.1%) | 11 (33.3%) |
| 3 Vehicles | 17 (41.5%) | 11 (33.3%) |
| 4 Vehicles | 4 (9.8%) | 3 (9.1%) |
| 5 or more Vehicles | 3 (7.3%) | 7 (21.2%) |
| Total | 41 (100.0%) | 33 (100.0%) |
Commute Time in Lima
The most frequently occuring commute durations in Lima are less than 5 minutes (39 commuters, 55.7%), 5 to 9 minutes (10 commuters, 14.3%), and 10 to 14 minutes (7 commuters, 10.0%).
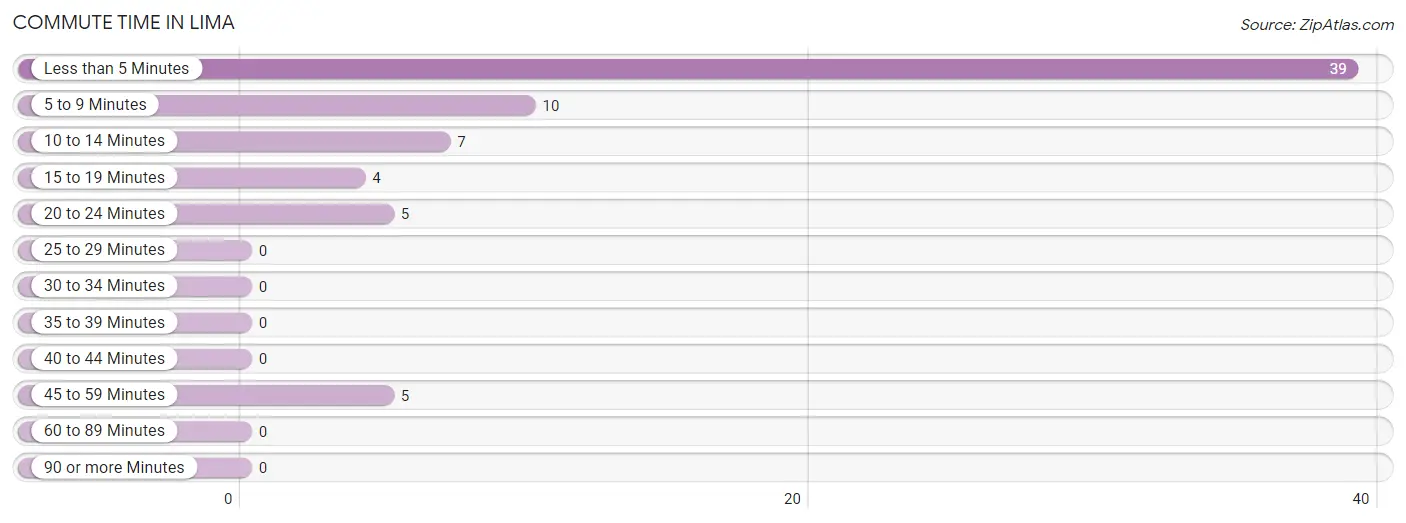
| Commute Time | # Commuters | % Commuters |
| Less than 5 Minutes | 39 | 55.7% |
| 5 to 9 Minutes | 10 | 14.3% |
| 10 to 14 Minutes | 7 | 10.0% |
| 15 to 19 Minutes | 4 | 5.7% |
| 20 to 24 Minutes | 5 | 7.1% |
| 25 to 29 Minutes | 0 | 0.0% |
| 30 to 34 Minutes | 0 | 0.0% |
| 35 to 39 Minutes | 0 | 0.0% |
| 40 to 44 Minutes | 0 | 0.0% |
| 45 to 59 Minutes | 5 | 7.1% |
| 60 to 89 Minutes | 0 | 0.0% |
| 90 or more Minutes | 0 | 0.0% |
Commute Time by Sex in Lima
The most common commute times in Lima are less than 5 minutes (34 commuters, 91.9%) for males and 5 to 9 minutes (7 commuters, 21.2%) for females.
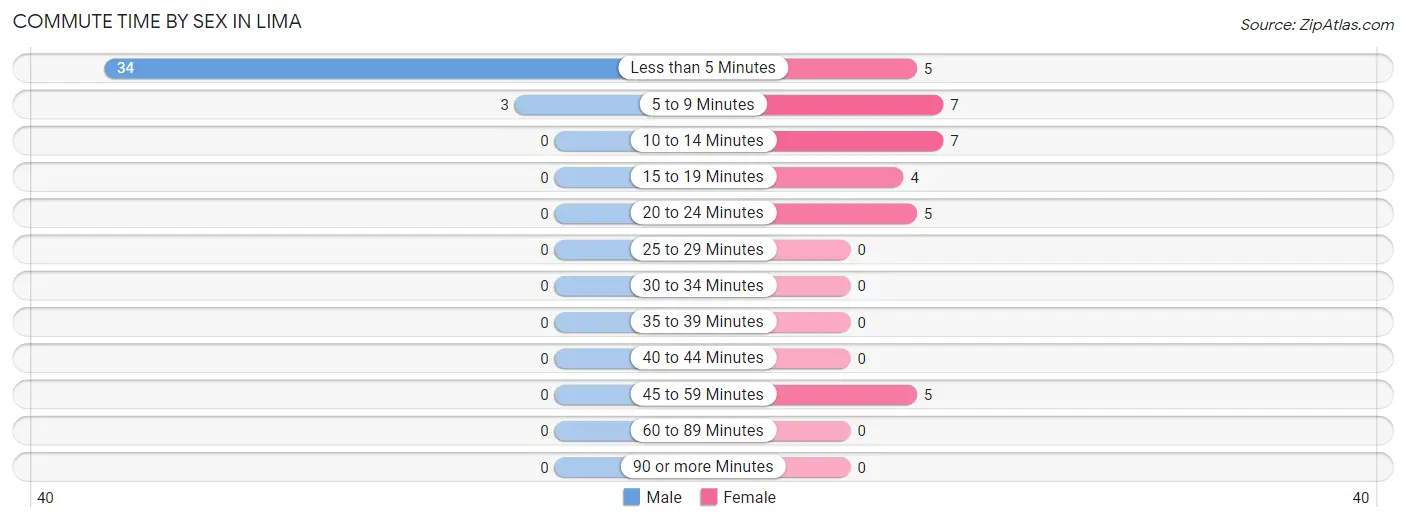
| Commute Time | Male | Female |
| Less than 5 Minutes | 34 (91.9%) | 5 (15.1%) |
| 5 to 9 Minutes | 3 (8.1%) | 7 (21.2%) |
| 10 to 14 Minutes | 0 (0.0%) | 7 (21.2%) |
| 15 to 19 Minutes | 0 (0.0%) | 4 (12.1%) |
| 20 to 24 Minutes | 0 (0.0%) | 5 (15.1%) |
| 25 to 29 Minutes | 0 (0.0%) | 0 (0.0%) |
| 30 to 34 Minutes | 0 (0.0%) | 0 (0.0%) |
| 35 to 39 Minutes | 0 (0.0%) | 0 (0.0%) |
| 40 to 44 Minutes | 0 (0.0%) | 0 (0.0%) |
| 45 to 59 Minutes | 0 (0.0%) | 5 (15.1%) |
| 60 to 89 Minutes | 0 (0.0%) | 0 (0.0%) |
| 90 or more Minutes | 0 (0.0%) | 0 (0.0%) |
Time of Departure to Work by Sex in Lima
The most frequent times of departure to work in Lima are 6:00 AM to 6:29 AM (10, 27.0%) for males and 8:30 AM to 8:59 AM (7, 21.2%) for females.
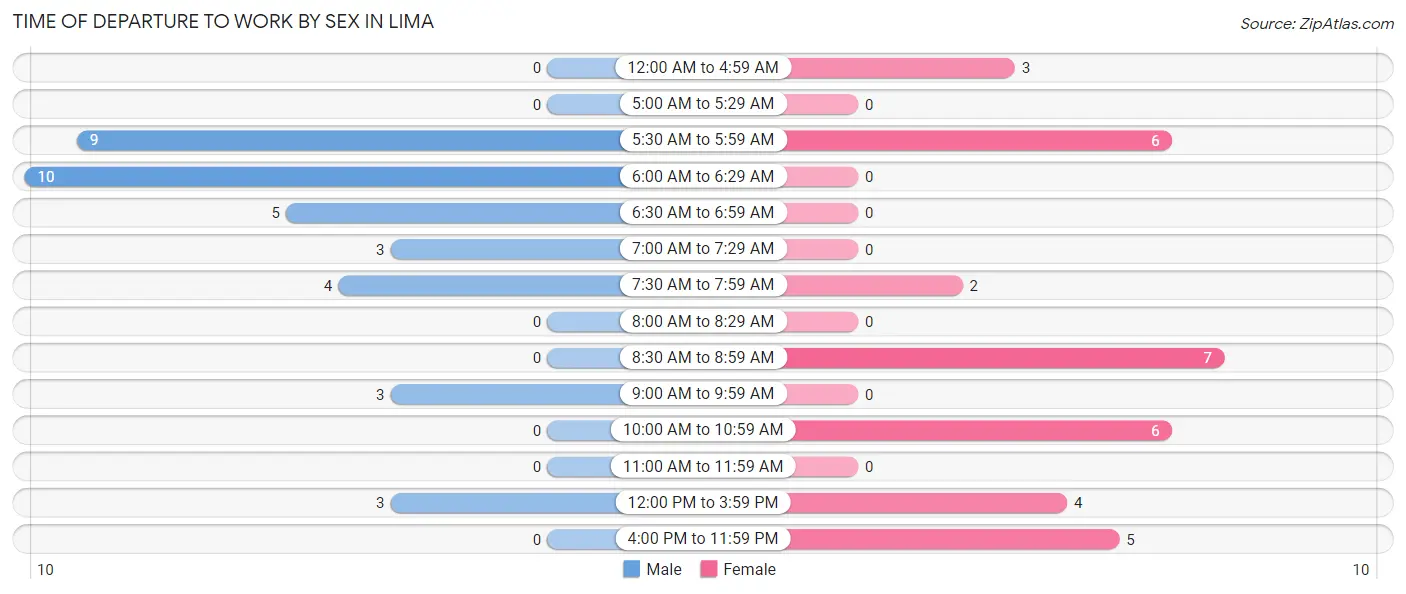
| Time of Departure | Male | Female |
| 12:00 AM to 4:59 AM | 0 (0.0%) | 3 (9.1%) |
| 5:00 AM to 5:29 AM | 0 (0.0%) | 0 (0.0%) |
| 5:30 AM to 5:59 AM | 9 (24.3%) | 6 (18.2%) |
| 6:00 AM to 6:29 AM | 10 (27.0%) | 0 (0.0%) |
| 6:30 AM to 6:59 AM | 5 (13.5%) | 0 (0.0%) |
| 7:00 AM to 7:29 AM | 3 (8.1%) | 0 (0.0%) |
| 7:30 AM to 7:59 AM | 4 (10.8%) | 2 (6.1%) |
| 8:00 AM to 8:29 AM | 0 (0.0%) | 0 (0.0%) |
| 8:30 AM to 8:59 AM | 0 (0.0%) | 7 (21.2%) |
| 9:00 AM to 9:59 AM | 3 (8.1%) | 0 (0.0%) |
| 10:00 AM to 10:59 AM | 0 (0.0%) | 6 (18.2%) |
| 11:00 AM to 11:59 AM | 0 (0.0%) | 0 (0.0%) |
| 12:00 PM to 3:59 PM | 3 (8.1%) | 4 (12.1%) |
| 4:00 PM to 11:59 PM | 0 (0.0%) | 5 (15.1%) |
| Total | 37 (100.0%) | 33 (100.0%) |
Housing Occupancy in Lima
Occupancy by Ownership in Lima
Of the total 117 dwellings in Lima, owner-occupied units account for 101 (86.3%), while renter-occupied units make up 16 (13.7%).
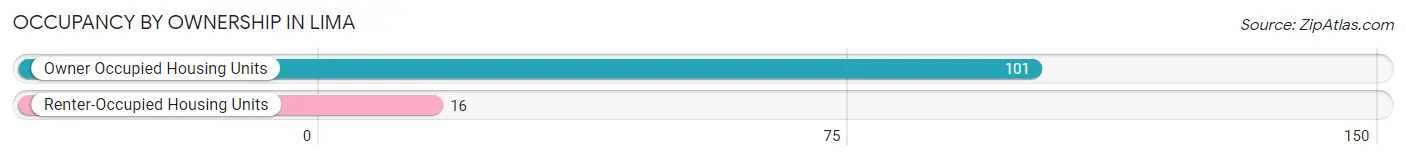
| Occupancy | # Housing Units | % Housing Units |
| Owner Occupied Housing Units | 101 | 86.3% |
| Renter-Occupied Housing Units | 16 | 13.7% |
| Total Occupied Housing Units | 117 | 100.0% |
Occupancy by Household Size in Lima
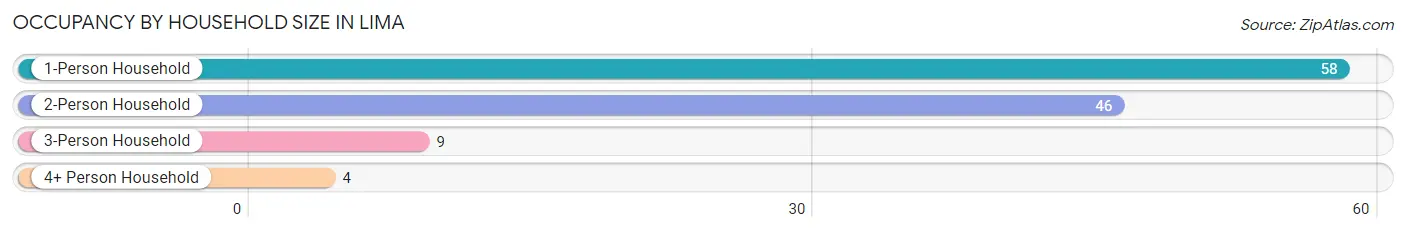
| Household Size | # Housing Units | % Housing Units |
| 1-Person Household | 58 | 49.6% |
| 2-Person Household | 46 | 39.3% |
| 3-Person Household | 9 | 7.7% |
| 4+ Person Household | 4 | 3.4% |
| Total Housing Units | 117 | 100.0% |
Occupancy by Ownership by Household Size in Lima
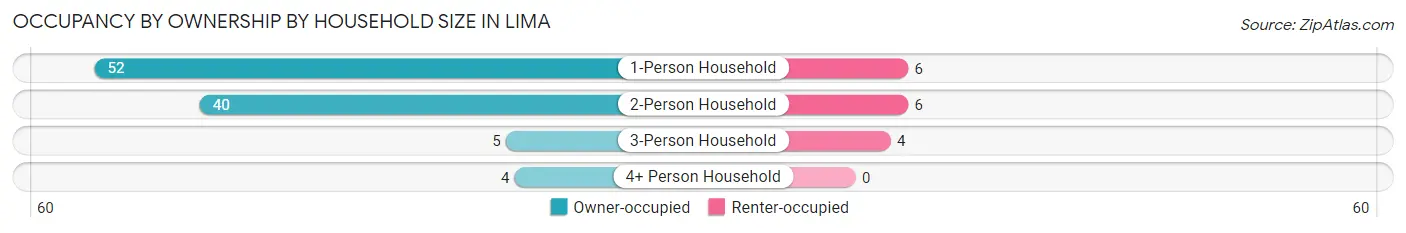
| Household Size | Owner-occupied | Renter-occupied |
| 1-Person Household | 52 (89.7%) | 6 (10.3%) |
| 2-Person Household | 40 (87.0%) | 6 (13.0%) |
| 3-Person Household | 5 (55.6%) | 4 (44.4%) |
| 4+ Person Household | 4 (100.0%) | 0 (0.0%) |
| Total Housing Units | 101 (86.3%) | 16 (13.7%) |
Occupancy by Educational Attainment in Lima
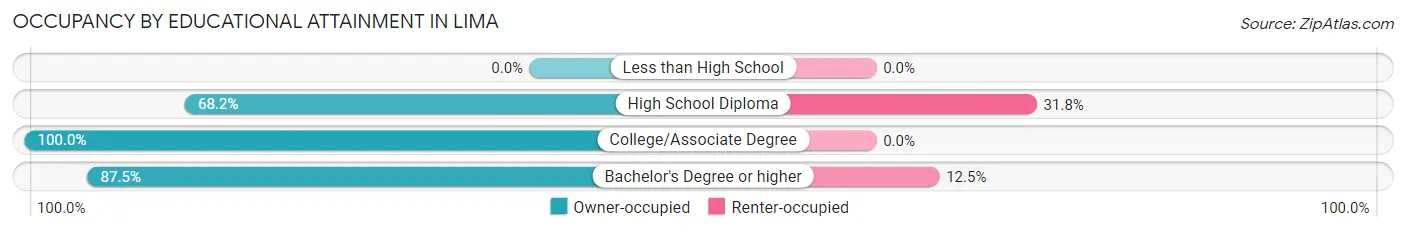
| Household Size | Owner-occupied | Renter-occupied |
| Less than High School | 0 (0.0%) | 0 (0.0%) |
| High School Diploma | 30 (68.2%) | 14 (31.8%) |
| College/Associate Degree | 57 (100.0%) | 0 (0.0%) |
| Bachelor's Degree or higher | 14 (87.5%) | 2 (12.5%) |
Occupancy by Age of Householder in Lima
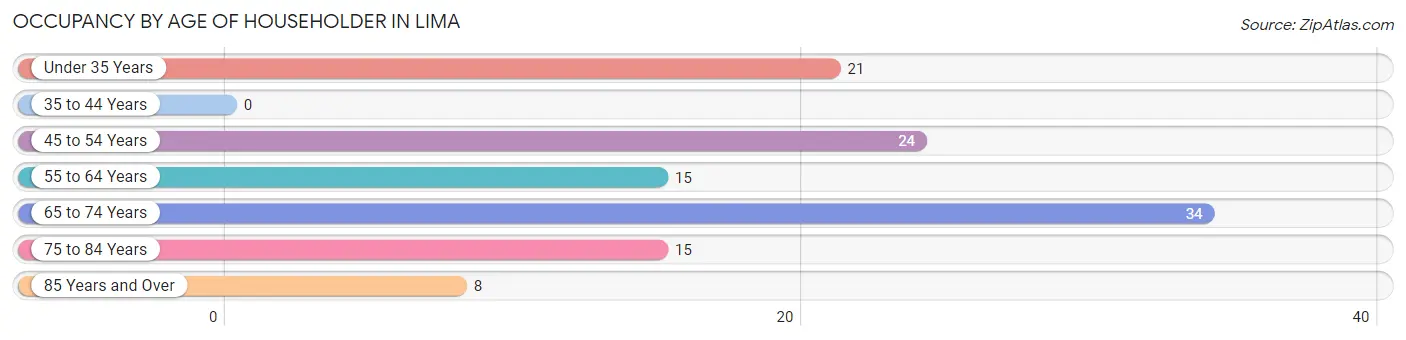
| Age Bracket | # Households | % Households |
| Under 35 Years | 21 | 17.9% |
| 35 to 44 Years | 0 | 0.0% |
| 45 to 54 Years | 24 | 20.5% |
| 55 to 64 Years | 15 | 12.8% |
| 65 to 74 Years | 34 | 29.1% |
| 75 to 84 Years | 15 | 12.8% |
| 85 Years and Over | 8 | 6.8% |
| Total | 117 | 100.0% |
Housing Finances in Lima
Median Income by Occupancy in Lima
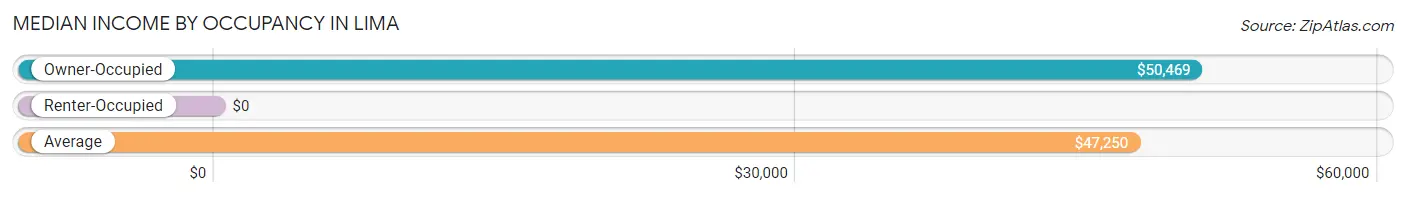
| Occupancy Type | # Households | Median Income |
| Owner-Occupied | 101 (86.3%) | $50,469 |
| Renter-Occupied | 16 (13.7%) | $0 |
| Average | 117 (100.0%) | $47,250 |
Occupancy by Householder Income Bracket in Lima
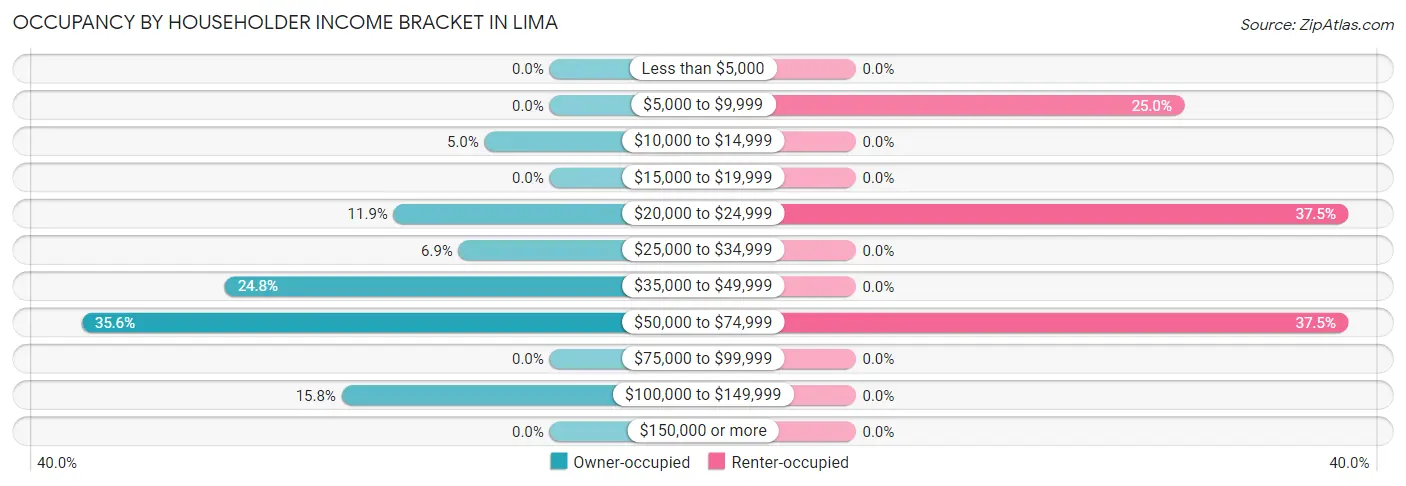
| Income Bracket | Owner-occupied | Renter-occupied |
| Less than $5,000 | 0 (0.0%) | 0 (0.0%) |
| $5,000 to $9,999 | 0 (0.0%) | 4 (25.0%) |
| $10,000 to $14,999 | 5 (5.0%) | 0 (0.0%) |
| $15,000 to $19,999 | 0 (0.0%) | 0 (0.0%) |
| $20,000 to $24,999 | 12 (11.9%) | 6 (37.5%) |
| $25,000 to $34,999 | 7 (6.9%) | 0 (0.0%) |
| $35,000 to $49,999 | 25 (24.7%) | 0 (0.0%) |
| $50,000 to $74,999 | 36 (35.6%) | 6 (37.5%) |
| $75,000 to $99,999 | 0 (0.0%) | 0 (0.0%) |
| $100,000 to $149,999 | 16 (15.8%) | 0 (0.0%) |
| $150,000 or more | 0 (0.0%) | 0 (0.0%) |
| Total | 101 (100.0%) | 16 (100.0%) |
Monthly Housing Cost Tiers in Lima
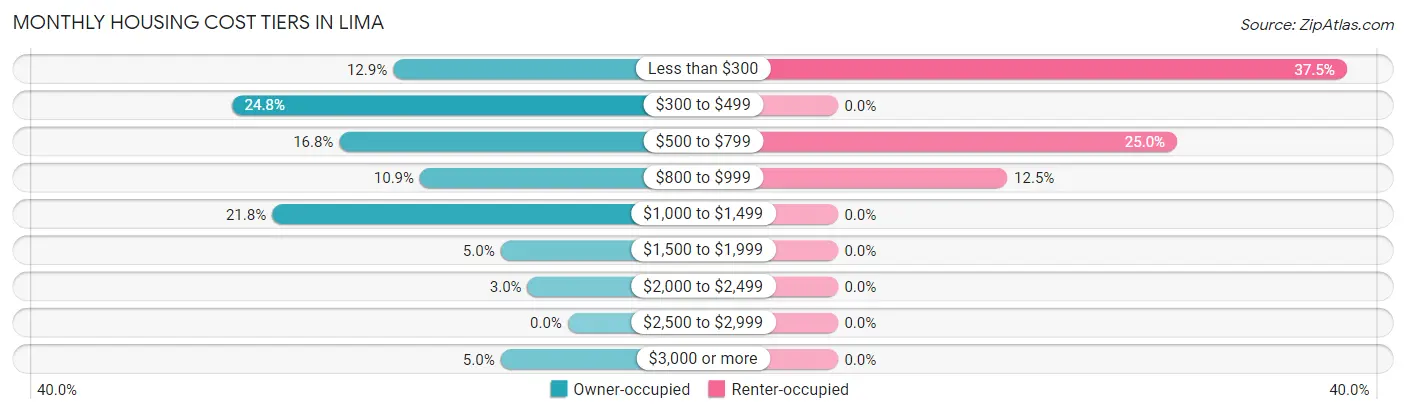
| Monthly Cost | Owner-occupied | Renter-occupied |
| Less than $300 | 13 (12.9%) | 6 (37.5%) |
| $300 to $499 | 25 (24.7%) | 0 (0.0%) |
| $500 to $799 | 17 (16.8%) | 4 (25.0%) |
| $800 to $999 | 11 (10.9%) | 2 (12.5%) |
| $1,000 to $1,499 | 22 (21.8%) | 0 (0.0%) |
| $1,500 to $1,999 | 5 (5.0%) | 0 (0.0%) |
| $2,000 to $2,499 | 3 (3.0%) | 0 (0.0%) |
| $2,500 to $2,999 | 0 (0.0%) | 0 (0.0%) |
| $3,000 or more | 5 (5.0%) | 0 (0.0%) |
| Total | 101 (100.0%) | 16 (100.0%) |
Physical Housing Characteristics in Lima
Housing Structures in Lima
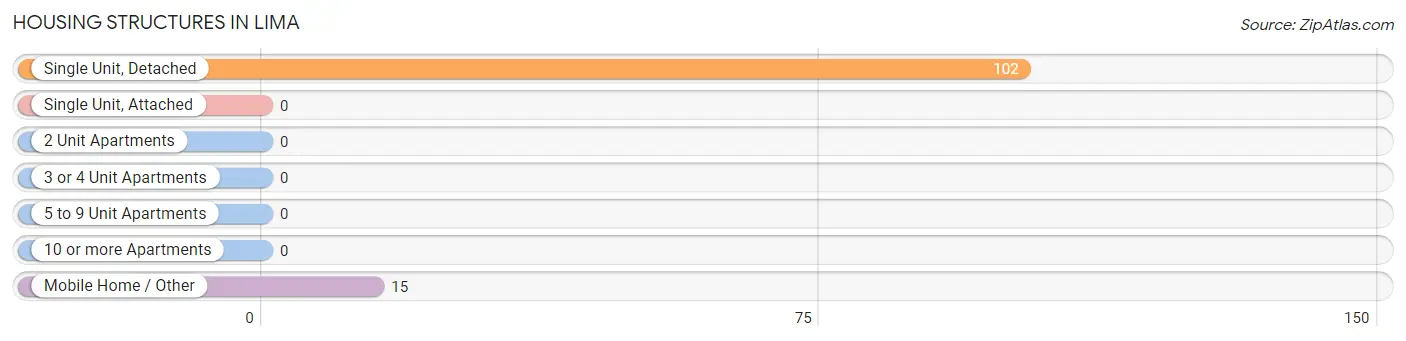
| Structure Type | # Housing Units | % Housing Units |
| Single Unit, Detached | 102 | 87.2% |
| Single Unit, Attached | 0 | 0.0% |
| 2 Unit Apartments | 0 | 0.0% |
| 3 or 4 Unit Apartments | 0 | 0.0% |
| 5 to 9 Unit Apartments | 0 | 0.0% |
| 10 or more Apartments | 0 | 0.0% |
| Mobile Home / Other | 15 | 12.8% |
| Total | 117 | 100.0% |
Housing Structures by Occupancy in Lima
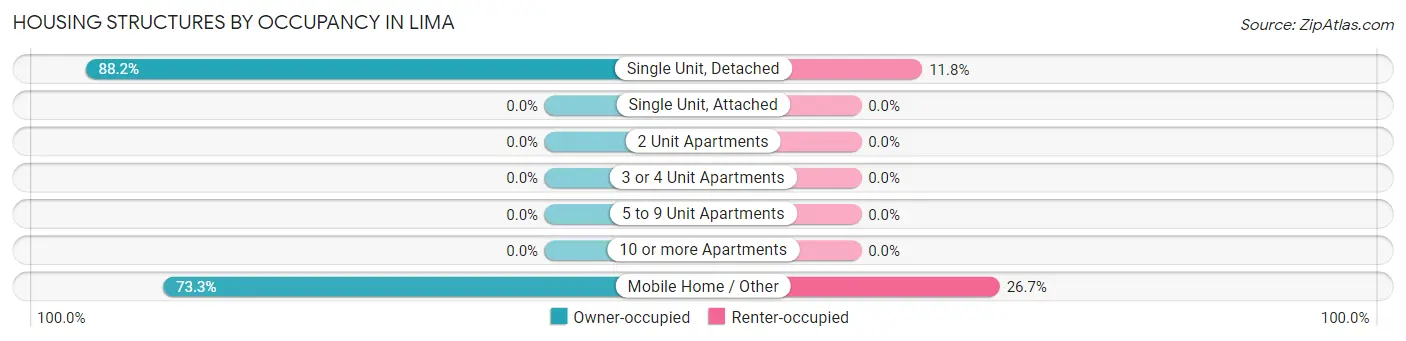
| Structure Type | Owner-occupied | Renter-occupied |
| Single Unit, Detached | 90 (88.2%) | 12 (11.8%) |
| Single Unit, Attached | 0 (0.0%) | 0 (0.0%) |
| 2 Unit Apartments | 0 (0.0%) | 0 (0.0%) |
| 3 or 4 Unit Apartments | 0 (0.0%) | 0 (0.0%) |
| 5 to 9 Unit Apartments | 0 (0.0%) | 0 (0.0%) |
| 10 or more Apartments | 0 (0.0%) | 0 (0.0%) |
| Mobile Home / Other | 11 (73.3%) | 4 (26.7%) |
| Total | 101 (86.3%) | 16 (13.7%) |
Housing Structures by Number of Rooms in Lima
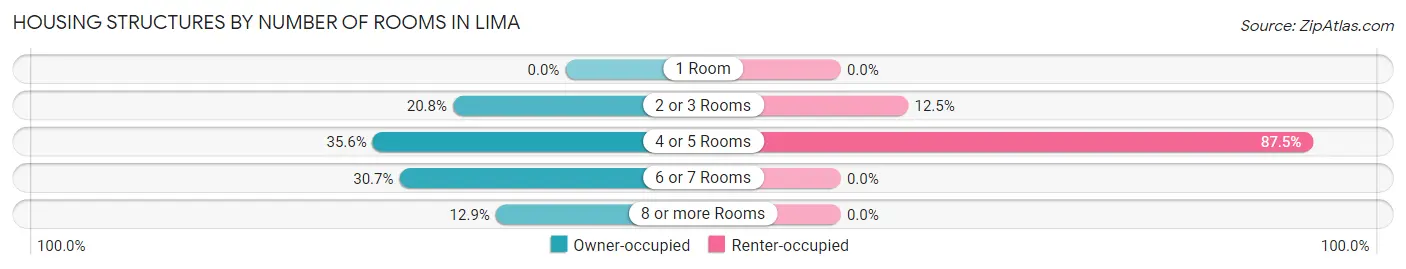
| Number of Rooms | Owner-occupied | Renter-occupied |
| 1 Room | 0 (0.0%) | 0 (0.0%) |
| 2 or 3 Rooms | 21 (20.8%) | 2 (12.5%) |
| 4 or 5 Rooms | 36 (35.6%) | 14 (87.5%) |
| 6 or 7 Rooms | 31 (30.7%) | 0 (0.0%) |
| 8 or more Rooms | 13 (12.9%) | 0 (0.0%) |
| Total | 101 (100.0%) | 16 (100.0%) |
Housing Structure by Heating Type in Lima
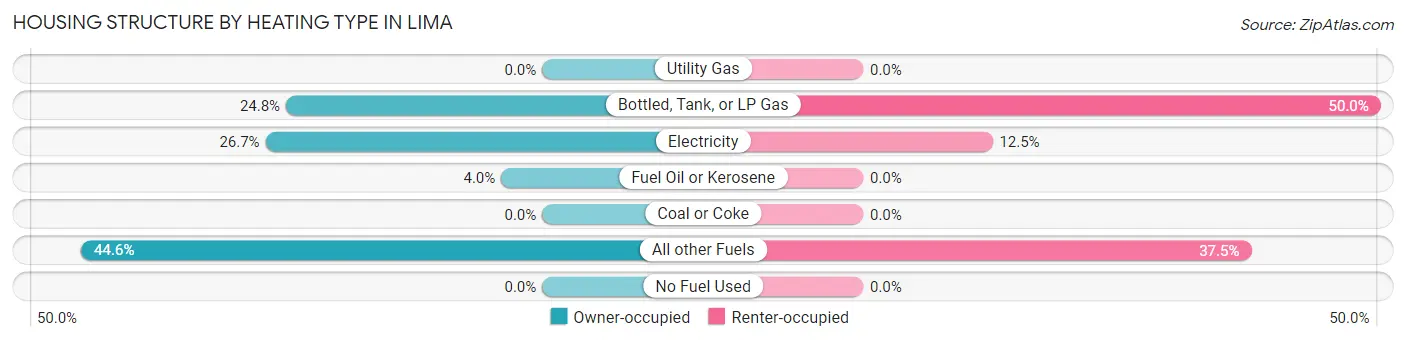
| Heating Type | Owner-occupied | Renter-occupied |
| Utility Gas | 0 (0.0%) | 0 (0.0%) |
| Bottled, Tank, or LP Gas | 25 (24.7%) | 8 (50.0%) |
| Electricity | 27 (26.7%) | 2 (12.5%) |
| Fuel Oil or Kerosene | 4 (4.0%) | 0 (0.0%) |
| Coal or Coke | 0 (0.0%) | 0 (0.0%) |
| All other Fuels | 45 (44.6%) | 6 (37.5%) |
| No Fuel Used | 0 (0.0%) | 0 (0.0%) |
| Total | 101 (100.0%) | 16 (100.0%) |
Household Vehicle Usage in Lima
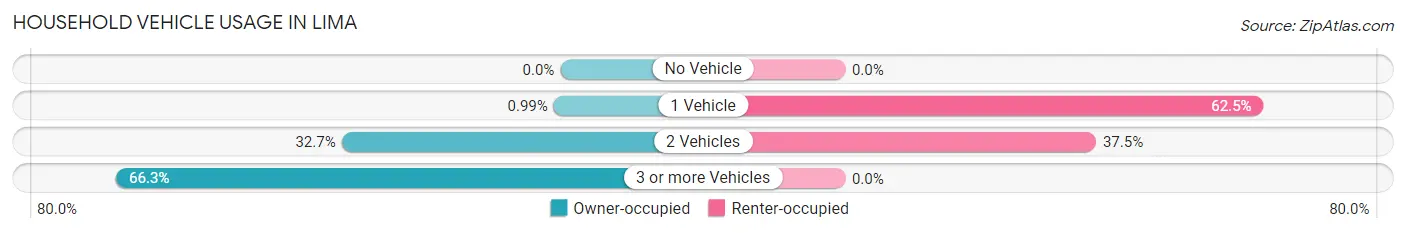
| Vehicles per Household | Owner-occupied | Renter-occupied |
| No Vehicle | 0 (0.0%) | 0 (0.0%) |
| 1 Vehicle | 1 (1.0%) | 10 (62.5%) |
| 2 Vehicles | 33 (32.7%) | 6 (37.5%) |
| 3 or more Vehicles | 67 (66.3%) | 0 (0.0%) |
| Total | 101 (100.0%) | 16 (100.0%) |
Real Estate & Mortgages in Lima
Real Estate and Mortgage Overview in Lima
| Characteristic | Without Mortgage | With Mortgage |
| Housing Units | 47 | 54 |
| Median Property Value | - | - |
| Median Household Income | $46,750 | $0 |
| Monthly Housing Costs | $415 | $5 |
| Real Estate Taxes | $910 | $0 |
Property Value by Mortgage Status in Lima
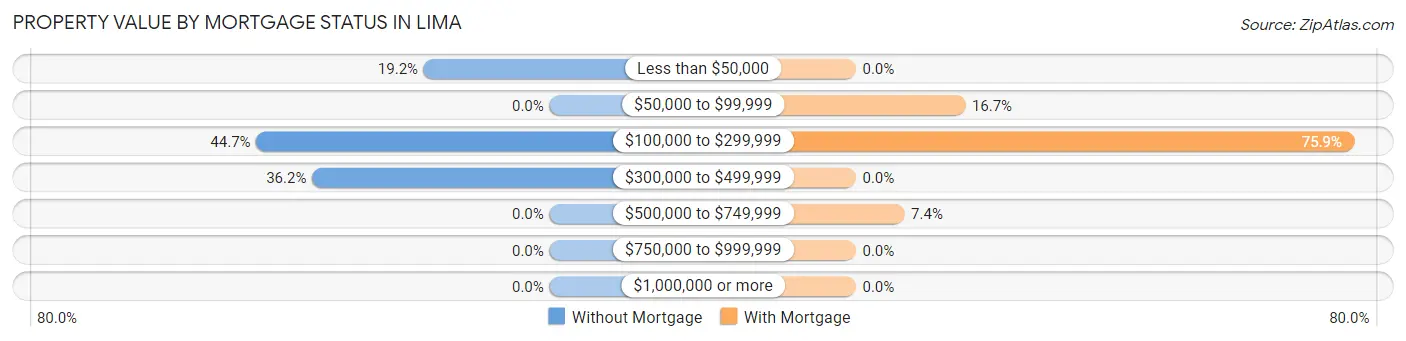
| Property Value | Without Mortgage | With Mortgage |
| Less than $50,000 | 9 (19.2%) | 0 (0.0%) |
| $50,000 to $99,999 | 0 (0.0%) | 9 (16.7%) |
| $100,000 to $299,999 | 21 (44.7%) | 41 (75.9%) |
| $300,000 to $499,999 | 17 (36.2%) | 0 (0.0%) |
| $500,000 to $749,999 | 0 (0.0%) | 4 (7.4%) |
| $750,000 to $999,999 | 0 (0.0%) | 0 (0.0%) |
| $1,000,000 or more | 0 (0.0%) | 0 (0.0%) |
| Total | 47 (100.0%) | 54 (100.0%) |
Household Income by Mortgage Status in Lima
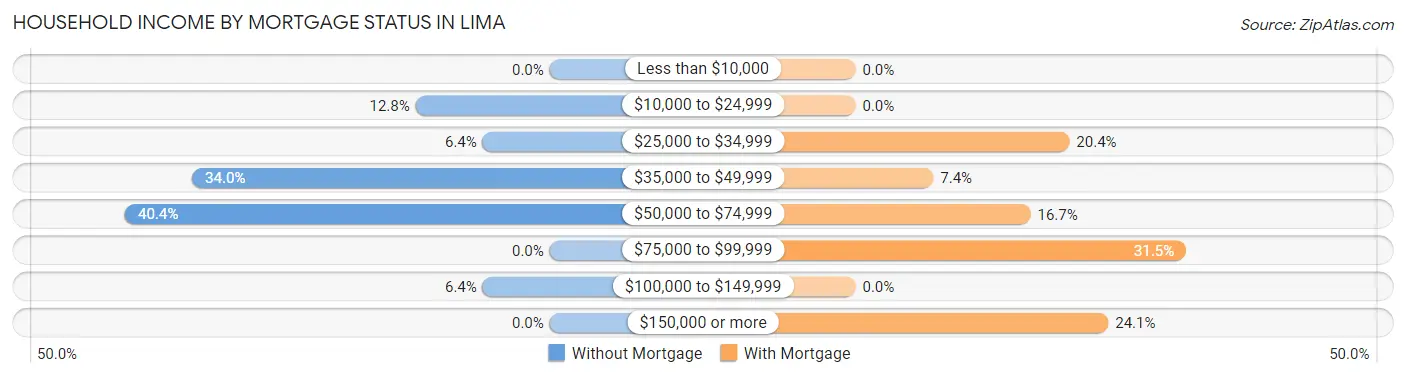
| Household Income | Without Mortgage | With Mortgage |
| Less than $10,000 | 0 (0.0%) | 0 (0.0%) |
| $10,000 to $24,999 | 6 (12.8%) | 0 (0.0%) |
| $25,000 to $34,999 | 3 (6.4%) | 11 (20.4%) |
| $35,000 to $49,999 | 16 (34.0%) | 4 (7.4%) |
| $50,000 to $74,999 | 19 (40.4%) | 9 (16.7%) |
| $75,000 to $99,999 | 0 (0.0%) | 17 (31.5%) |
| $100,000 to $149,999 | 3 (6.4%) | 0 (0.0%) |
| $150,000 or more | 0 (0.0%) | 13 (24.1%) |
| Total | 47 (100.0%) | 54 (100.0%) |
Property Value to Household Income Ratio in Lima
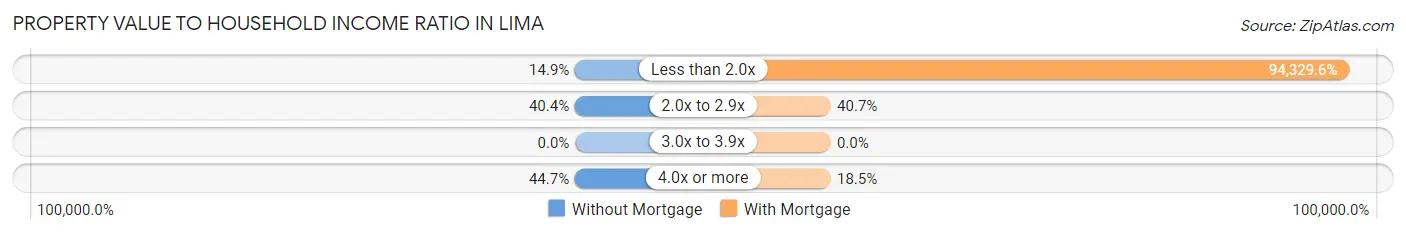
| Value-to-Income Ratio | Without Mortgage | With Mortgage |
| Less than 2.0x | 7 (14.9%) | 50,938 (94,329.6%) |
| 2.0x to 2.9x | 19 (40.4%) | 22 (40.7%) |
| 3.0x to 3.9x | 0 (0.0%) | 0 (0.0%) |
| 4.0x or more | 21 (44.7%) | 10 (18.5%) |
| Total | 47 (100.0%) | 54 (100.0%) |
Real Estate Taxes by Mortgage Status in Lima
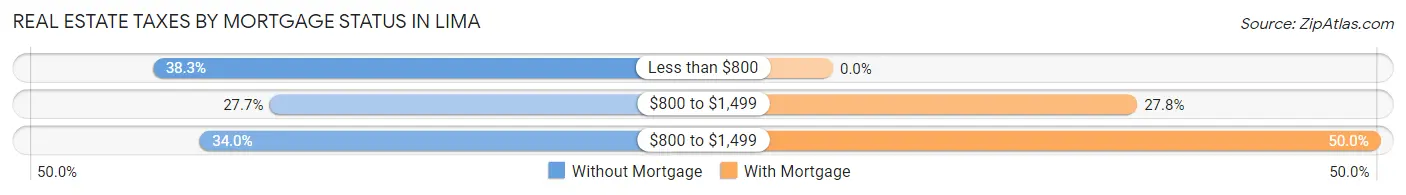
| Property Taxes | Without Mortgage | With Mortgage |
| Less than $800 | 18 (38.3%) | 0 (0.0%) |
| $800 to $1,499 | 13 (27.7%) | 15 (27.8%) |
| $800 to $1,499 | 16 (34.0%) | 27 (50.0%) |
| Total | 47 (100.0%) | 54 (100.0%) |
Health & Disability in Lima
Health Insurance Coverage by Age in Lima
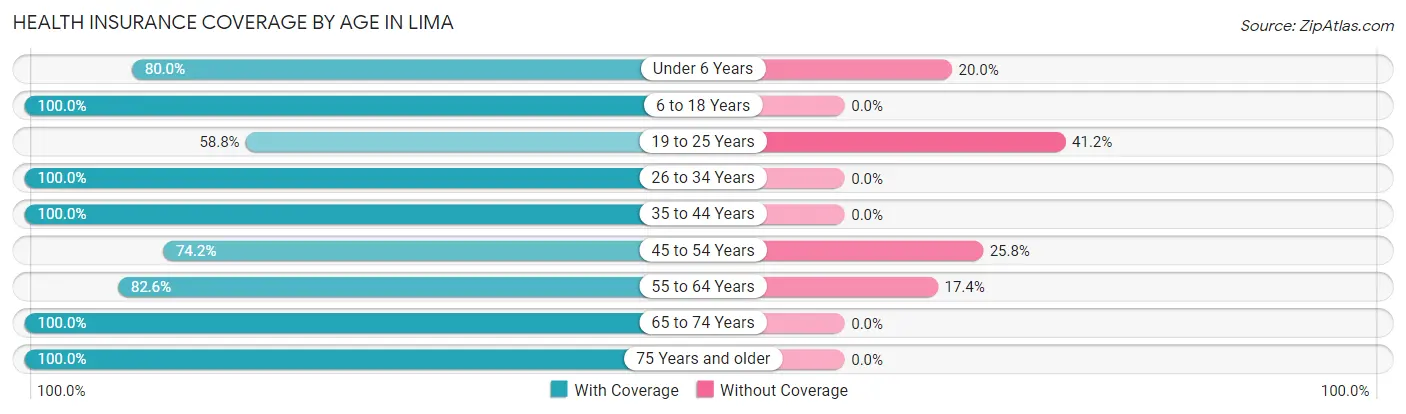
| Age Bracket | With Coverage | Without Coverage |
| Under 6 Years | 20 (80.0%) | 5 (20.0%) |
| 6 to 18 Years | 15 (100.0%) | 0 (0.0%) |
| 19 to 25 Years | 10 (58.8%) | 7 (41.2%) |
| 26 to 34 Years | 13 (100.0%) | 0 (0.0%) |
| 35 to 44 Years | 5 (100.0%) | 0 (0.0%) |
| 45 to 54 Years | 23 (74.2%) | 8 (25.8%) |
| 55 to 64 Years | 19 (82.6%) | 4 (17.4%) |
| 65 to 74 Years | 50 (100.0%) | 0 (0.0%) |
| 75 Years and older | 30 (100.0%) | 0 (0.0%) |
| Total | 185 (88.5%) | 24 (11.5%) |
Health Insurance Coverage by Citizenship Status in Lima
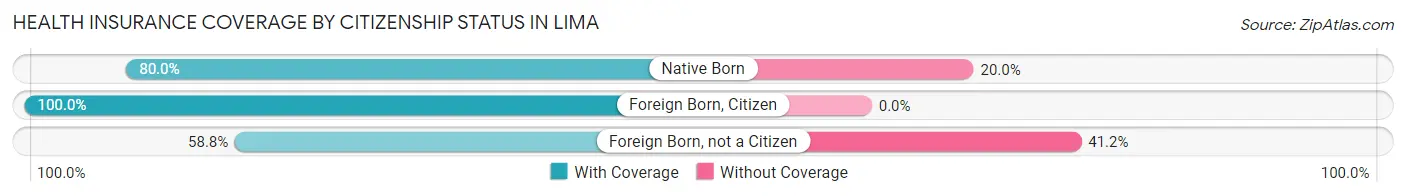
| Citizenship Status | With Coverage | Without Coverage |
| Native Born | 20 (80.0%) | 5 (20.0%) |
| Foreign Born, Citizen | 15 (100.0%) | 0 (0.0%) |
| Foreign Born, not a Citizen | 10 (58.8%) | 7 (41.2%) |
Health Insurance Coverage by Household Income in Lima
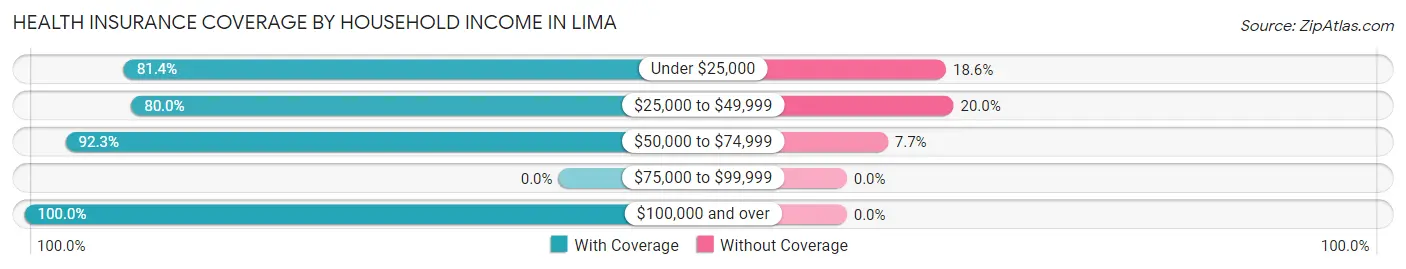
| Household Income | With Coverage | Without Coverage |
| Under $25,000 | 35 (81.4%) | 8 (18.6%) |
| $25,000 to $49,999 | 32 (80.0%) | 8 (20.0%) |
| $50,000 to $74,999 | 96 (92.3%) | 8 (7.7%) |
| $75,000 to $99,999 | 0 (0.0%) | 0 (0.0%) |
| $100,000 and over | 22 (100.0%) | 0 (0.0%) |
Public vs Private Health Insurance Coverage by Age in Lima
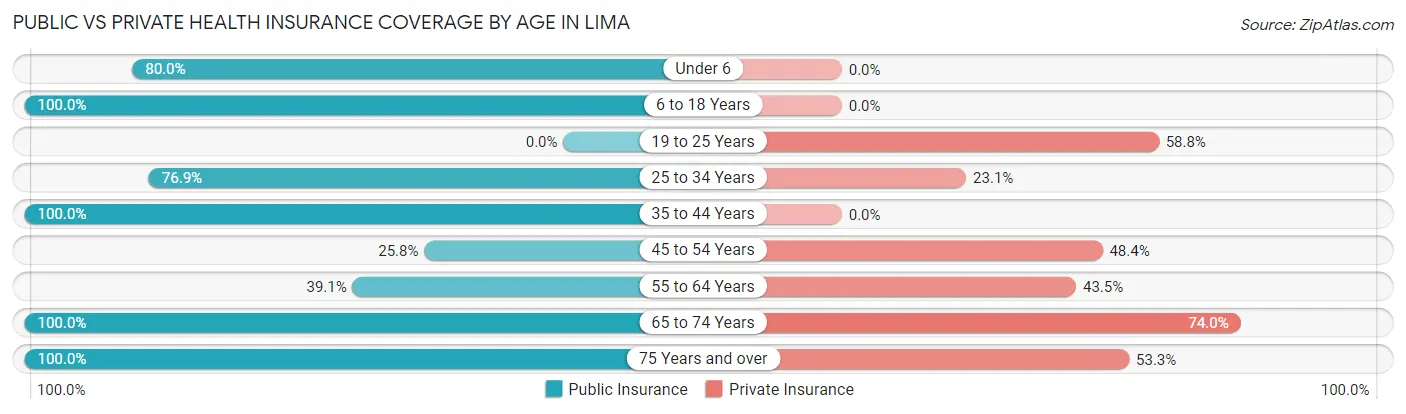
| Age Bracket | Public Insurance | Private Insurance |
| Under 6 | 20 (80.0%) | 0 (0.0%) |
| 6 to 18 Years | 15 (100.0%) | 0 (0.0%) |
| 19 to 25 Years | 0 (0.0%) | 10 (58.8%) |
| 25 to 34 Years | 10 (76.9%) | 3 (23.1%) |
| 35 to 44 Years | 5 (100.0%) | 0 (0.0%) |
| 45 to 54 Years | 8 (25.8%) | 15 (48.4%) |
| 55 to 64 Years | 9 (39.1%) | 10 (43.5%) |
| 65 to 74 Years | 50 (100.0%) | 37 (74.0%) |
| 75 Years and over | 30 (100.0%) | 16 (53.3%) |
| Total | 147 (70.3%) | 91 (43.5%) |
Disability Status by Sex by Age in Lima
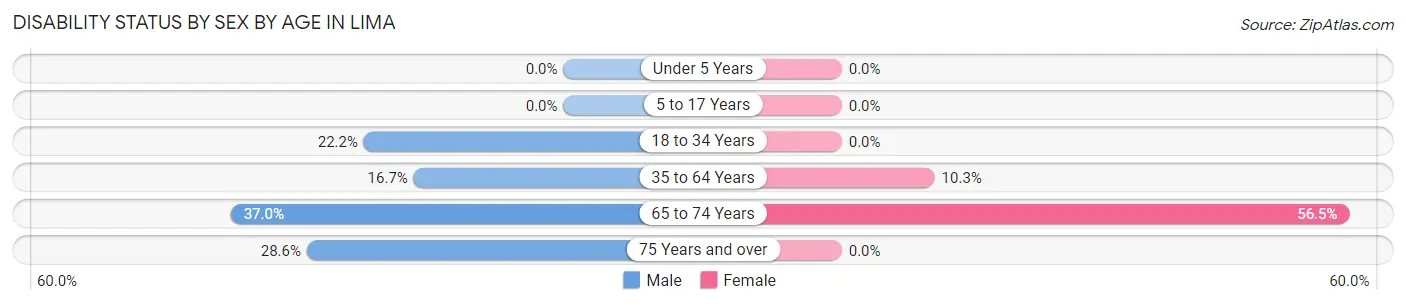
| Age Bracket | Male | Female |
| Under 5 Years | 0 (0.0%) | 0 (0.0%) |
| 5 to 17 Years | 0 (0.0%) | 0 (0.0%) |
| 18 to 34 Years | 4 (22.2%) | 0 (0.0%) |
| 35 to 64 Years | 5 (16.7%) | 3 (10.3%) |
| 65 to 74 Years | 10 (37.0%) | 13 (56.5%) |
| 75 Years and over | 4 (28.6%) | 0 (0.0%) |
Disability Class by Sex by Age in Lima
Disability Class: Hearing Difficulty
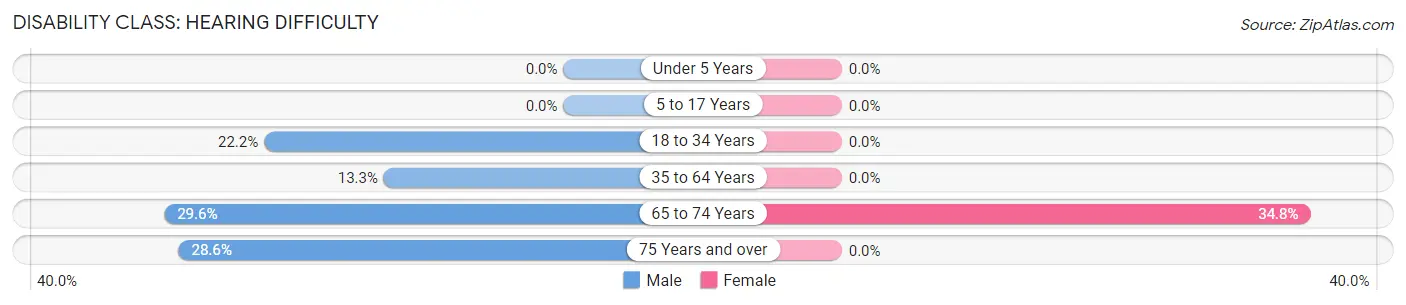
| Age Bracket | Male | Female |
| Under 5 Years | 0 (0.0%) | 0 (0.0%) |
| 5 to 17 Years | 0 (0.0%) | 0 (0.0%) |
| 18 to 34 Years | 4 (22.2%) | 0 (0.0%) |
| 35 to 64 Years | 4 (13.3%) | 0 (0.0%) |
| 65 to 74 Years | 8 (29.6%) | 8 (34.8%) |
| 75 Years and over | 4 (28.6%) | 0 (0.0%) |
Disability Class: Vision Difficulty
| Age Bracket | Male | Female |
| Under 5 Years | 0 (0.0%) | 0 (0.0%) |
| 5 to 17 Years | 0 (0.0%) | 0 (0.0%) |
| 18 to 34 Years | 0 (0.0%) | 0 (0.0%) |
| 35 to 64 Years | 0 (0.0%) | 0 (0.0%) |
| 65 to 74 Years | 0 (0.0%) | 0 (0.0%) |
| 75 Years and over | 0 (0.0%) | 0 (0.0%) |
Disability Class: Cognitive Difficulty
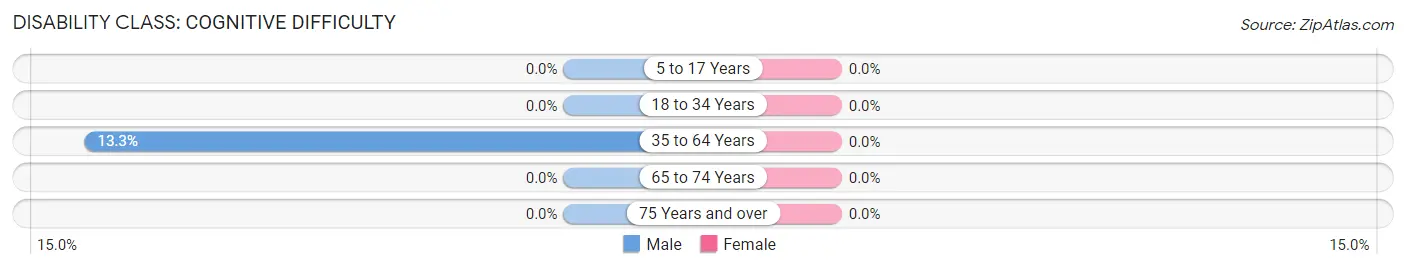
| Age Bracket | Male | Female |
| 5 to 17 Years | 0 (0.0%) | 0 (0.0%) |
| 18 to 34 Years | 0 (0.0%) | 0 (0.0%) |
| 35 to 64 Years | 4 (13.3%) | 0 (0.0%) |
| 65 to 74 Years | 0 (0.0%) | 0 (0.0%) |
| 75 Years and over | 0 (0.0%) | 0 (0.0%) |
Disability Class: Ambulatory Difficulty
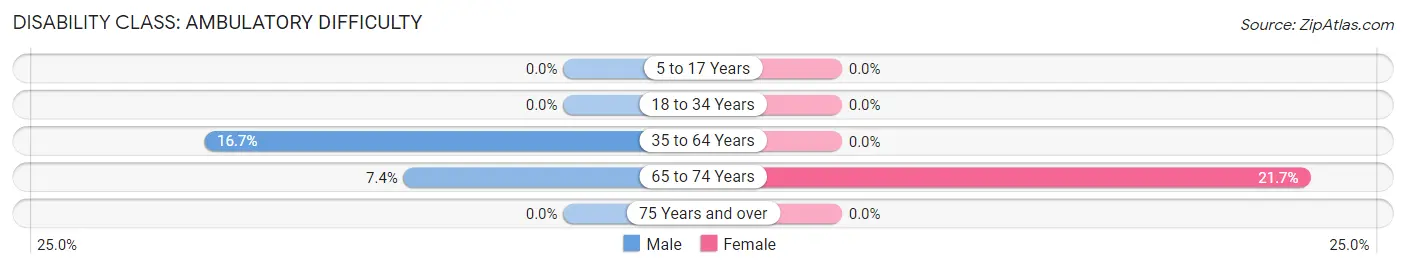
| Age Bracket | Male | Female |
| 5 to 17 Years | 0 (0.0%) | 0 (0.0%) |
| 18 to 34 Years | 0 (0.0%) | 0 (0.0%) |
| 35 to 64 Years | 5 (16.7%) | 0 (0.0%) |
| 65 to 74 Years | 2 (7.4%) | 5 (21.7%) |
| 75 Years and over | 0 (0.0%) | 0 (0.0%) |
Disability Class: Self-Care Difficulty
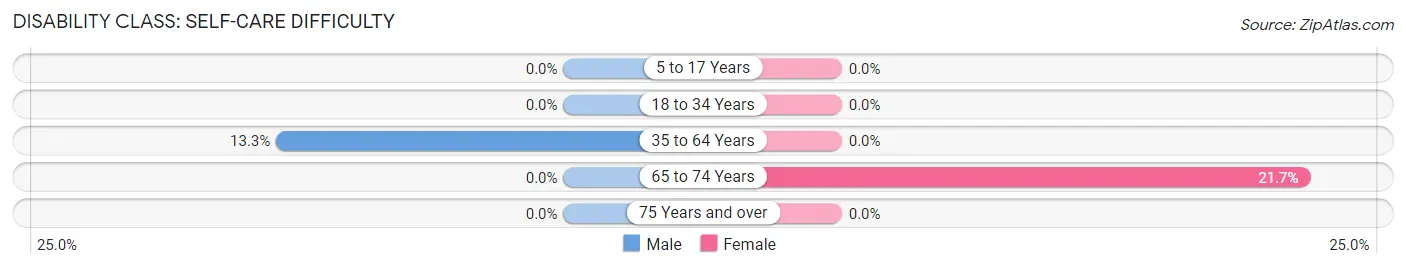
| Age Bracket | Male | Female |
| 5 to 17 Years | 0 (0.0%) | 0 (0.0%) |
| 18 to 34 Years | 0 (0.0%) | 0 (0.0%) |
| 35 to 64 Years | 4 (13.3%) | 0 (0.0%) |
| 65 to 74 Years | 0 (0.0%) | 5 (21.7%) |
| 75 Years and over | 0 (0.0%) | 0 (0.0%) |
Technology Access in Lima
Computing Device Access in Lima
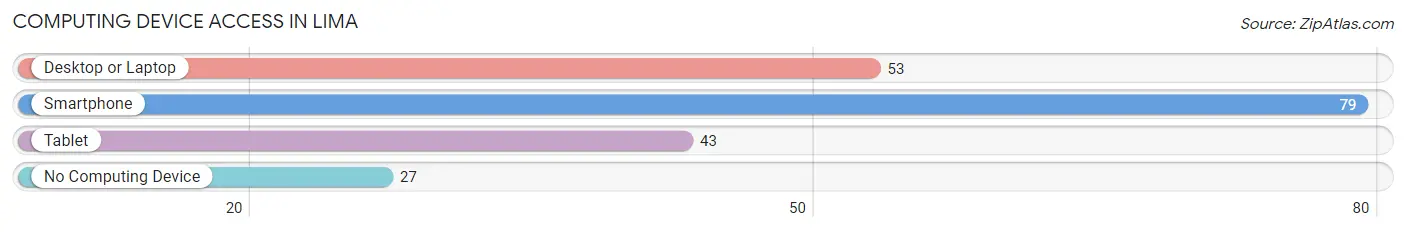
| Device Type | # Households | % Households |
| Desktop or Laptop | 53 | 45.3% |
| Smartphone | 79 | 67.5% |
| Tablet | 43 | 36.7% |
| No Computing Device | 27 | 23.1% |
| Total | 117 | 100.0% |
Internet Access in Lima
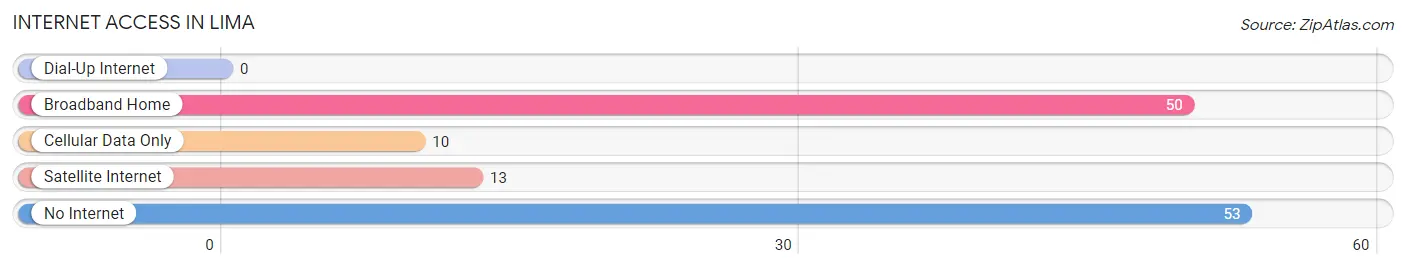
| Internet Type | # Households | % Households |
| Dial-Up Internet | 0 | 0.0% |
| Broadband Home | 50 | 42.7% |
| Cellular Data Only | 10 | 8.6% |
| Satellite Internet | 13 | 11.1% |
| No Internet | 53 | 45.3% |
| Total | 117 | 100.0% |
Lima Summary
Lima is a small town located in the state of Montana, United States. It is situated in the south-central part of the state, in the foothills of the Rocky Mountains. The town is located in the county of Beaverhead, and is part of the Dillon Micropolitan Statistical Area. As of the 2010 census, the population of Lima was 545.
History
The area around Lima was first settled in the late 1800s by ranchers and farmers. The town was officially founded in 1883, when the Northern Pacific Railroad built a line through the area. The town was named after the nearby Lima Creek, which was named after the city of Lima, Peru.
In the early 1900s, the town was a bustling center of commerce, with several stores, a hotel, a bank, and a post office. The town also had a school, a church, and a newspaper.
In the 1920s, the town began to decline as the railroad line was abandoned and the population began to move away. The town was nearly abandoned by the 1950s, but in the 1960s, the town began to experience a resurgence as people began to move back to the area.
Geography
Lima is located in the south-central part of Montana, in the foothills of the Rocky Mountains. The town is situated in the county of Beaverhead, and is part of the Dillon Micropolitan Statistical Area.
The town is located at an elevation of 4,890 feet (1,490 m). The climate is semi-arid, with hot summers and cold winters. The average annual precipitation is 11.5 inches (292 mm).
Economy
The economy of Lima is largely based on agriculture and tourism. The town is home to several small farms, which produce hay, wheat, barley, and other crops. The town is also home to several small businesses, including a grocery store, a hardware store, and a restaurant.
Tourism is an important part of the local economy. The town is located near several popular outdoor recreation areas, including the Beaverhead National Forest and the Big Hole National Wildlife Refuge. The town is also home to several historic sites, including the old Northern Pacific Railroad depot.
Demographics
As of the 2010 census, the population of Lima was 545. The racial makeup of the town was 97.3% White, 0.2% African American, 0.4% Native American, 0.2% Asian, 0.2% from other races, and 1.7% from two or more races. Hispanic or Latino of any race were 1.3% of the population.
The median income for a household in the town was $31,250, and the median income for a family was $37,500. The per capita income for the town was $17,813. About 11.2% of families and 14.2% of the population were below the poverty line, including 18.2% of those under age 18 and 8.3% of those age 65 or over.
Common Questions
What is Per Capita Income in Lima?
Per Capita income in Lima is $29,376.
What is the Median Family Income in Lima?
Median Family Income in Lima is $39,306.
What is the Median Household income in Lima?
Median Household Income in Lima is $47,250.
What is Income or Wage Gap in Lima?
Income or Wage Gap in Lima is 67.5%.
Women in Lima earn 32.5 cents for every dollar earned by a man.
What is Inequality or Gini Index in Lima?
Inequality or Gini Index in Lima is 0.33.
What is the Total Population of Lima?
Total Population of Lima is 209.
What is the Total Male Population of Lima?
Total Male Population of Lima is 113.
What is the Total Female Population of Lima?
Total Female Population of Lima is 96.
What is the Ratio of Males per 100 Females in Lima?
There are 117.71 Males per 100 Females in Lima.
What is the Ratio of Females per 100 Males in Lima?
There are 84.96 Females per 100 Males in Lima.
What is the Median Population Age in Lima?
Median Population Age in Lima is 52.8 Years.
What is the Average Family Size in Lima
Average Family Size in Lima is 2.4 People.
What is the Average Household Size in Lima
Average Household Size in Lima is 1.8 People.
How Large is the Labor Force in Lima?
There are 74 People in the Labor Forcein in Lima.
What is the Percentage of People in the Labor Force in Lima?
43.8% of People are in the Labor Force in Lima.