Crane, MT Map & Demographics
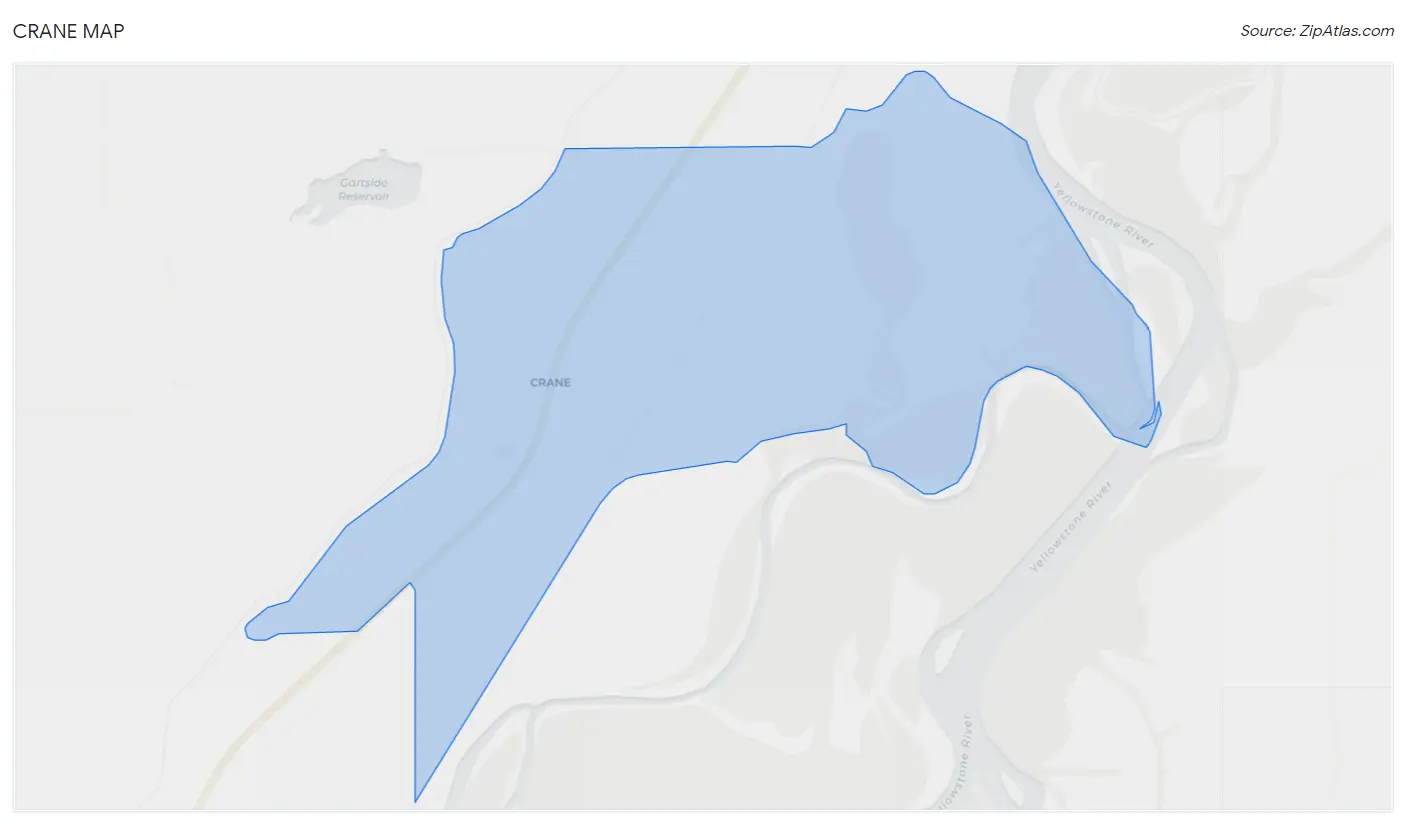
Crane Map
Crane Overview
$21,508
PER CAPITA INCOME
$74,132
AVG FAMILY INCOME
$73,472
AVG HOUSEHOLD INCOME
0.35
INEQUALITY / GINI INDEX
191
TOTAL POPULATION
92
MALE POPULATION
99
FEMALE POPULATION
92.93
MALES / 100 FEMALES
107.61
FEMALES / 100 MALES
16.6
MEDIAN AGE
3.7
AVG FAMILY SIZE
2.9
AVG HOUSEHOLD SIZE
18
LABOR FORCE [ PEOPLE ]
16.4%
PERCENT IN LABOR FORCE
Crane Zip Codes
Crane Area Codes
Income in Crane
Income Overview in Crane
Per Capita Income in Crane is $21,508, while median incomes of families and households are $74,132 and $73,472 respectively.
| Characteristic | Number | Measure |
| Per Capita Income | 191 | $21,508 |
| Median Family Income | 47 | $74,132 |
| Mean Family Income | 47 | $85,440 |
| Median Household Income | 66 | $73,472 |
| Mean Household Income | 66 | $62,045 |
| Income Deficit | 47 | $0 |
| Wage / Income Gap (%) | 191 | 0.00% |
| Wage / Income Gap ($) | 191 | 100.00¢ per $1 |
| Gini / Inequality Index | 191 | 0.35 |
Earnings by Sex in Crane
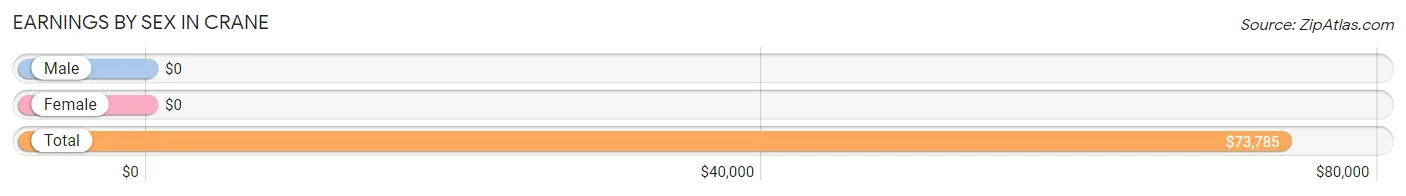
| Sex | Number | Average Earnings |
| Male | 19 (33.3%) | $0 |
| Female | 38 (66.7%) | $0 |
| Total | 57 (100.0%) | $73,785 |
Earnings by Sex by Income Bracket in Crane
The most common earnings brackets in Crane are $10,000 to $12,499 for men (8 | 42.1%) and $65,000 to $74,999 for women (36 | 94.7%).
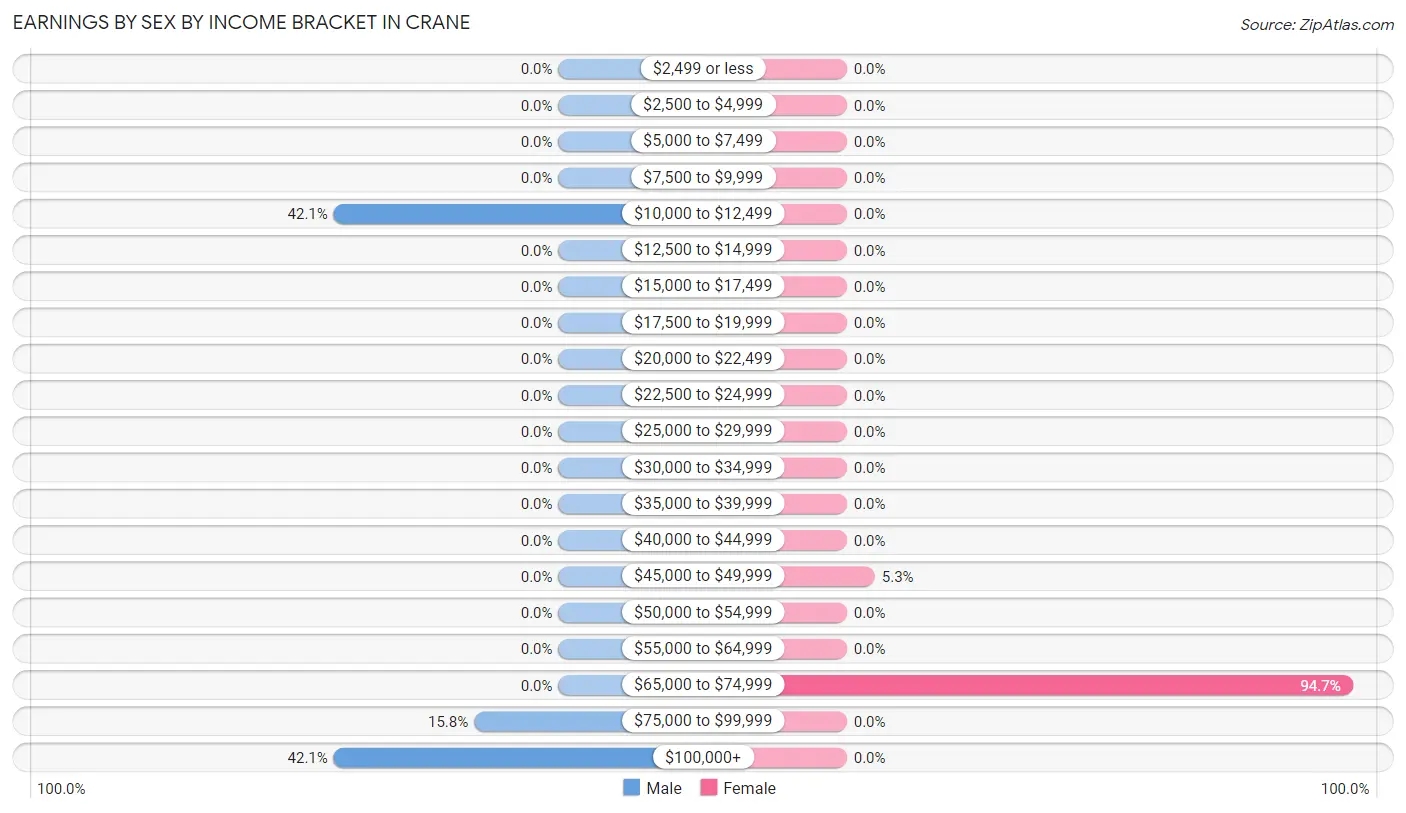
| Income | Male | Female |
| $2,499 or less | 0 (0.0%) | 0 (0.0%) |
| $2,500 to $4,999 | 0 (0.0%) | 0 (0.0%) |
| $5,000 to $7,499 | 0 (0.0%) | 0 (0.0%) |
| $7,500 to $9,999 | 0 (0.0%) | 0 (0.0%) |
| $10,000 to $12,499 | 8 (42.1%) | 0 (0.0%) |
| $12,500 to $14,999 | 0 (0.0%) | 0 (0.0%) |
| $15,000 to $17,499 | 0 (0.0%) | 0 (0.0%) |
| $17,500 to $19,999 | 0 (0.0%) | 0 (0.0%) |
| $20,000 to $22,499 | 0 (0.0%) | 0 (0.0%) |
| $22,500 to $24,999 | 0 (0.0%) | 0 (0.0%) |
| $25,000 to $29,999 | 0 (0.0%) | 0 (0.0%) |
| $30,000 to $34,999 | 0 (0.0%) | 0 (0.0%) |
| $35,000 to $39,999 | 0 (0.0%) | 0 (0.0%) |
| $40,000 to $44,999 | 0 (0.0%) | 0 (0.0%) |
| $45,000 to $49,999 | 0 (0.0%) | 2 (5.3%) |
| $50,000 to $54,999 | 0 (0.0%) | 0 (0.0%) |
| $55,000 to $64,999 | 0 (0.0%) | 0 (0.0%) |
| $65,000 to $74,999 | 0 (0.0%) | 36 (94.7%) |
| $75,000 to $99,999 | 3 (15.8%) | 0 (0.0%) |
| $100,000+ | 8 (42.1%) | 0 (0.0%) |
| Total | 19 (100.0%) | 38 (100.0%) |
Earnings by Sex by Educational Attainment in Crane
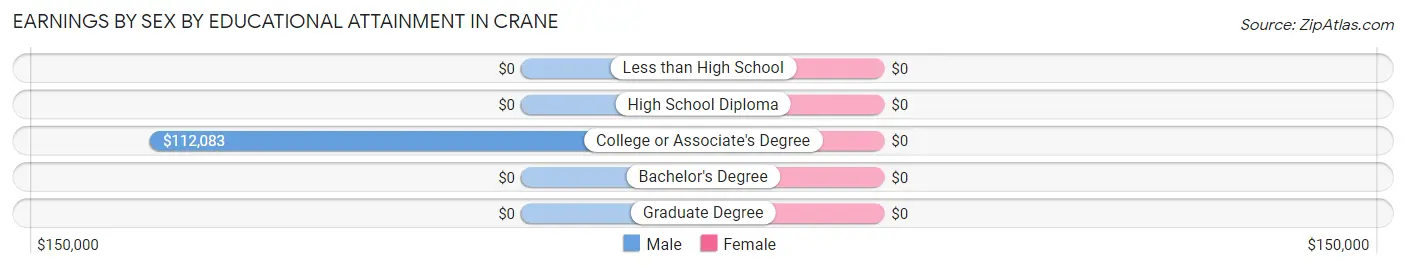
| Educational Attainment | Male Income | Female Income |
| Less than High School | - | - |
| High School Diploma | - | - |
| College or Associate's Degree | $112,083 | $0 |
| Bachelor's Degree | - | - |
| Graduate Degree | - | - |
| Total | $112,083 | $0 |
Family Income in Crane
Family Income Brackets in Crane
According to the Crane family income data, there are 36 families falling into the $50,000 to $74,999 income range, which is the most common income bracket and makes up 76.6% of all families.
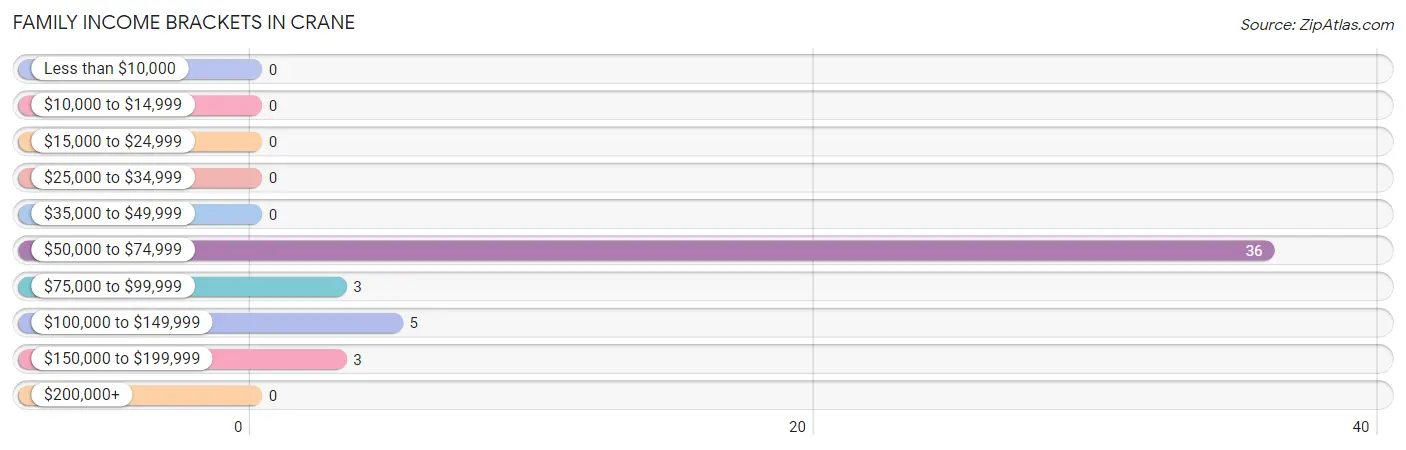
| Income Bracket | # Families | % Families |
| Less than $10,000 | 0 | 0.0% |
| $10,000 to $14,999 | 0 | 0.0% |
| $15,000 to $24,999 | 0 | 0.0% |
| $25,000 to $34,999 | 0 | 0.0% |
| $35,000 to $49,999 | 0 | 0.0% |
| $50,000 to $74,999 | 36 | 76.6% |
| $75,000 to $99,999 | 3 | 6.4% |
| $100,000 to $149,999 | 5 | 10.6% |
| $150,000 to $199,999 | 3 | 6.4% |
| $200,000+ | 0 | 0.0% |
Family Income by Famaliy Size in Crane
| Income Bracket | # Families | Median Income |
| 2-Person Families | 6 (12.8%) | $0 |
| 3-Person Families | 36 (76.6%) | $0 |
| 4-Person Families | 5 (10.6%) | $0 |
| 5-Person Families | 0 (0.0%) | $0 |
| 6-Person Families | 0 (0.0%) | $0 |
| 7+ Person Families | 0 (0.0%) | $0 |
| Total | 47 (100.0%) | $74,132 |
Family Income by Number of Earners in Crane
| Number of Earners | # Families | Median Income |
| No Earners | 0 (0.0%) | $0 |
| 1 Earner | 41 (87.2%) | $0 |
| 2 Earners | 6 (12.8%) | $0 |
| 3+ Earners | 0 (0.0%) | $0 |
| Total | 47 (100.0%) | $74,132 |
Household Income in Crane
Household Income Brackets in Crane
With 36 households falling in the category, the $50,000 to $74,999 income range is the most frequent in Crane, accounting for 54.5% of all households.
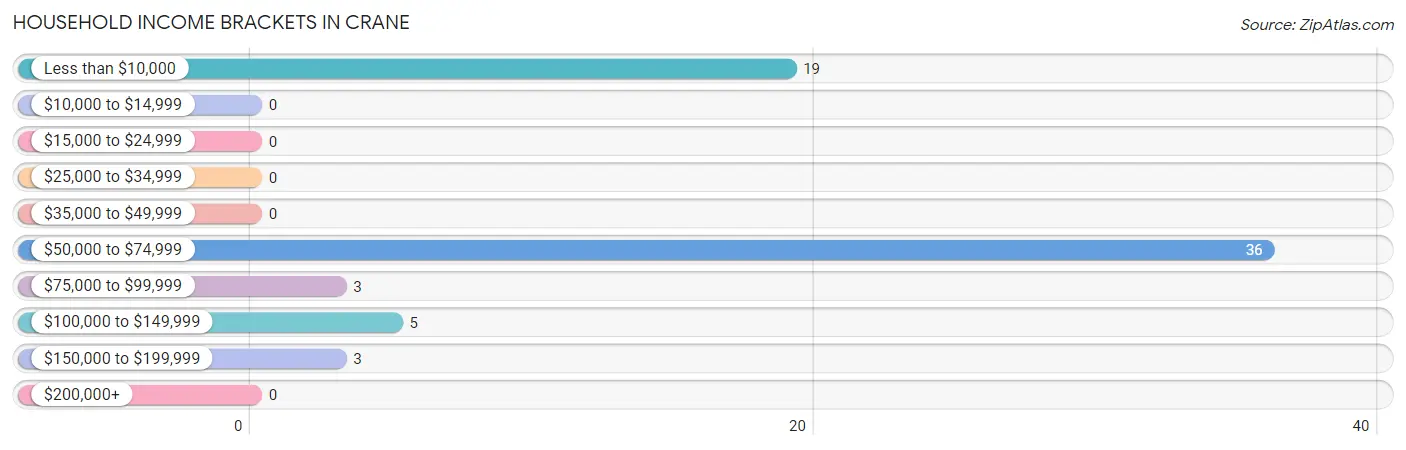
| Income Bracket | # Households | % Households |
| Less than $10,000 | 19 | 28.8% |
| $10,000 to $14,999 | 0 | 0.0% |
| $15,000 to $24,999 | 0 | 0.0% |
| $25,000 to $34,999 | 0 | 0.0% |
| $35,000 to $49,999 | 0 | 0.0% |
| $50,000 to $74,999 | 36 | 54.5% |
| $75,000 to $99,999 | 3 | 4.5% |
| $100,000 to $149,999 | 5 | 7.6% |
| $150,000 to $199,999 | 3 | 4.5% |
| $200,000+ | 0 | 0.0% |
Household Income by Householder Age in Crane
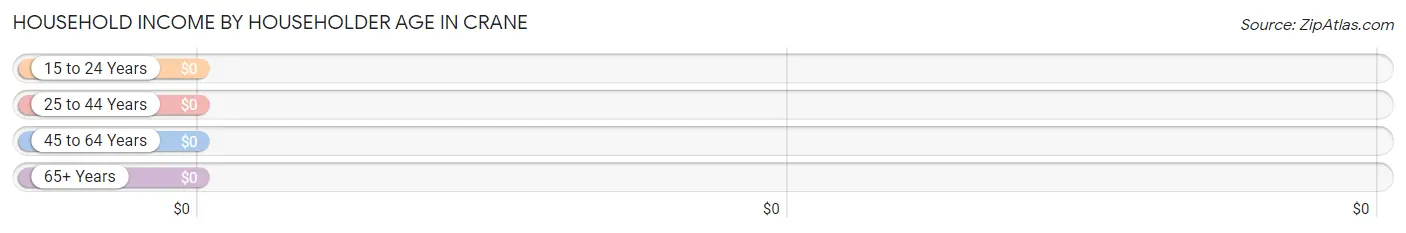
| Income Bracket | # Households | Median Income |
| 15 to 24 Years | 0 (0.0%) | $0 |
| 25 to 44 Years | 5 (7.6%) | $0 |
| 45 to 64 Years | 39 (59.1%) | $0 |
| 65+ Years | 22 (33.3%) | $0 |
| Total | 66 (100.0%) | $73,472 |
Poverty in Crane
Income Below Poverty by Sex and Age in Crane
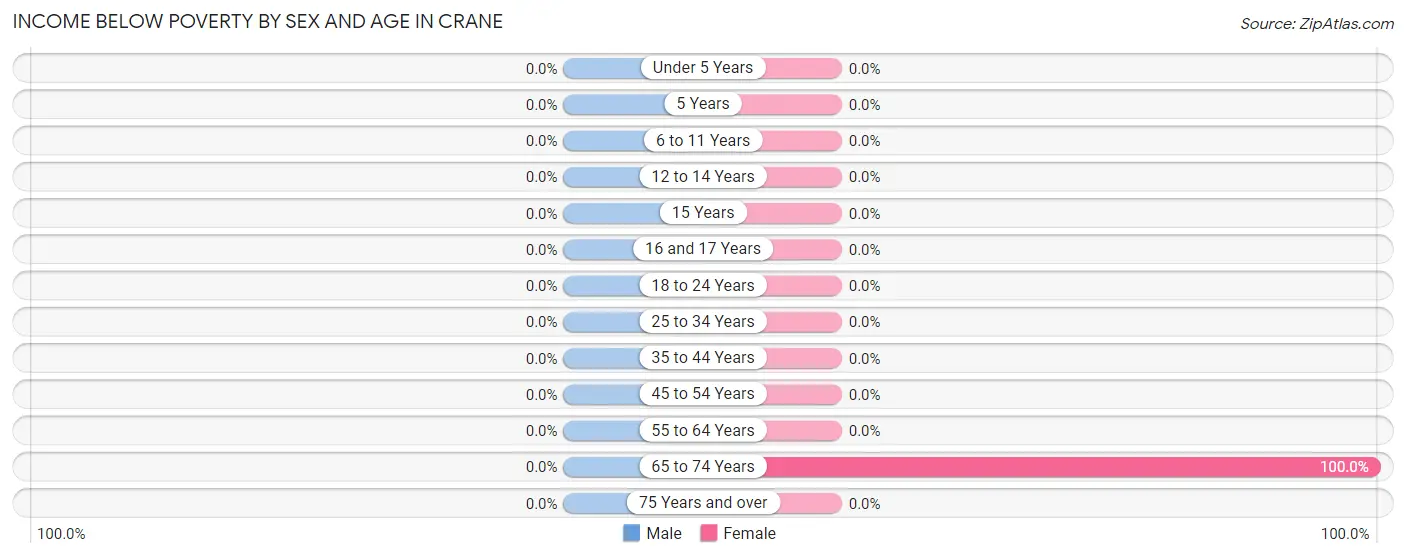
| Age Bracket | Male | Female |
| Under 5 Years | 0 (0.0%) | 0 (0.0%) |
| 5 Years | 0 (0.0%) | 0 (0.0%) |
| 6 to 11 Years | 0 (0.0%) | 0 (0.0%) |
| 12 to 14 Years | 0 (0.0%) | 0 (0.0%) |
| 15 Years | 0 (0.0%) | 0 (0.0%) |
| 16 and 17 Years | 0 (0.0%) | 0 (0.0%) |
| 18 to 24 Years | 0 (0.0%) | 0 (0.0%) |
| 25 to 34 Years | 0 (0.0%) | 0 (0.0%) |
| 35 to 44 Years | 0 (0.0%) | 0 (0.0%) |
| 45 to 54 Years | 0 (0.0%) | 0 (0.0%) |
| 55 to 64 Years | 0 (0.0%) | 0 (0.0%) |
| 65 to 74 Years | 0 (0.0%) | 19 (100.0%) |
| 75 Years and over | 0 (0.0%) | 0 (0.0%) |
| Total | 0 (0.0%) | 19 (19.2%) |
Income Above Poverty by Sex and Age in Crane
According to the poverty statistics in Crane, males aged under 5 years and females aged under 5 years are the age groups that are most secure financially, with 100.0% of males and 100.0% of females in these age groups living above the poverty line.
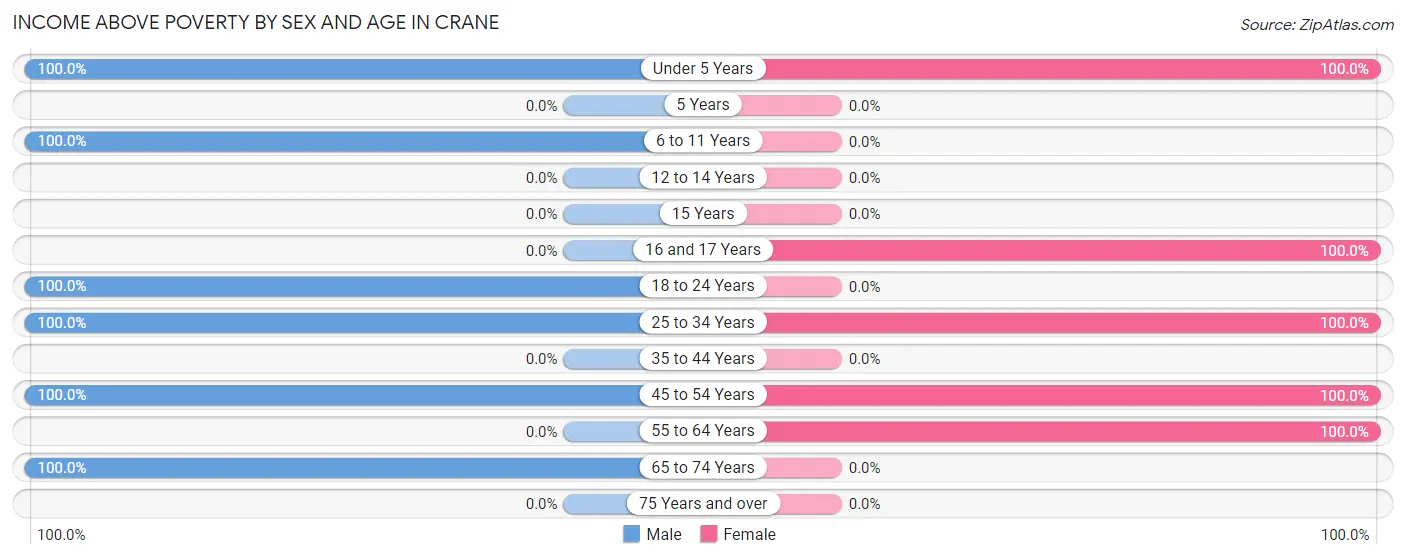
| Age Bracket | Male | Female |
| Under 5 Years | 13 (100.0%) | 8 (100.0%) |
| 5 Years | 0 (0.0%) | 0 (0.0%) |
| 6 to 11 Years | 60 (100.0%) | 0 (0.0%) |
| 12 to 14 Years | 0 (0.0%) | 0 (0.0%) |
| 15 Years | 0 (0.0%) | 0 (0.0%) |
| 16 and 17 Years | 0 (0.0%) | 25 (100.0%) |
| 18 to 24 Years | 8 (100.0%) | 0 (0.0%) |
| 25 to 34 Years | 5 (100.0%) | 9 (100.0%) |
| 35 to 44 Years | 0 (0.0%) | 0 (0.0%) |
| 45 to 54 Years | 3 (100.0%) | 36 (100.0%) |
| 55 to 64 Years | 0 (0.0%) | 2 (100.0%) |
| 65 to 74 Years | 3 (100.0%) | 0 (0.0%) |
| 75 Years and over | 0 (0.0%) | 0 (0.0%) |
| Total | 92 (100.0%) | 80 (80.8%) |
Income Below Poverty Among Married-Couple Families in Crane
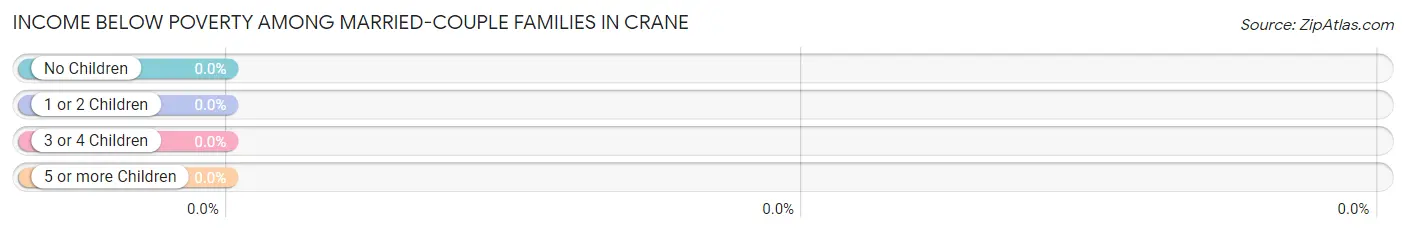
| Children | Above Poverty | Below Poverty |
| No Children | 3 (100.0%) | 0 (0.0%) |
| 1 or 2 Children | 5 (100.0%) | 0 (0.0%) |
| 3 or 4 Children | 0 (0.0%) | 0 (0.0%) |
| 5 or more Children | 0 (0.0%) | 0 (0.0%) |
| Total | 8 (100.0%) | 0 (0.0%) |
Income Below Poverty Among Single-Parent Households in Crane
| Children | Single Father | Single Mother |
| No Children | 0 (0.0%) | 0 (0.0%) |
| 1 or 2 Children | 0 (0.0%) | 0 (0.0%) |
| 3 or 4 Children | 0 (0.0%) | 0 (0.0%) |
| 5 or more Children | 0 (0.0%) | 0 (0.0%) |
| Total | 0 (0.0%) | 0 (0.0%) |
Income Below Poverty Among Married-Couple vs Single-Parent Households in Crane
| Children | Married-Couple Families | Single-Parent Households |
| No Children | 0 (0.0%) | 0 (0.0%) |
| 1 or 2 Children | 0 (0.0%) | 0 (0.0%) |
| 3 or 4 Children | 0 (0.0%) | 0 (0.0%) |
| 5 or more Children | 0 (0.0%) | 0 (0.0%) |
| Total | 0 (0.0%) | 0 (0.0%) |
Race in Crane
The most populous races in Crane are , and White / Caucasian (191 | 100.0%).
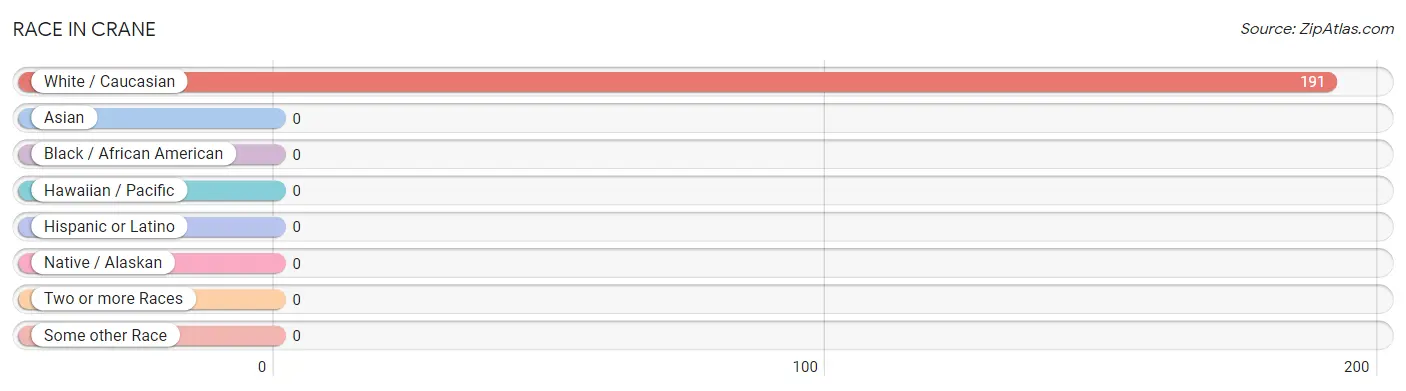
| Race | # Population | % Population |
| Asian | 0 | 0.0% |
| Black / African American | 0 | 0.0% |
| Hawaiian / Pacific | 0 | 0.0% |
| Hispanic or Latino | 0 | 0.0% |
| Native / Alaskan | 0 | 0.0% |
| White / Caucasian | 191 | 100.0% |
| Two or more Races | 0 | 0.0% |
| Some other Race | 0 | 0.0% |
| Total | 191 | 100.0% |
Ancestry in Crane
The most populous ancestries reported in Crane are European (121 | 63.3%), English (30 | 15.7%), Italian (26 | 13.6%), German (19 | 10.0%), and Czech (2 | 1.1%), together accounting for 103.7% of all Crane residents.
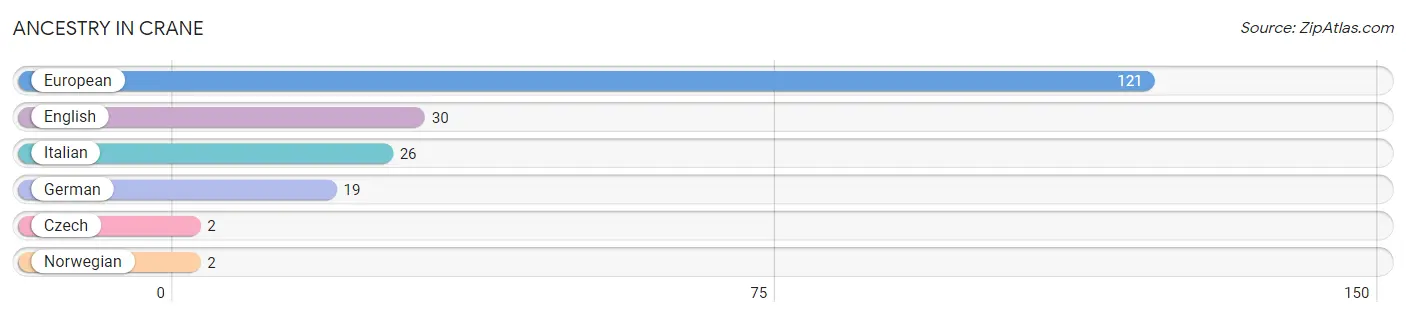
| Ancestry | # Population | % Population |
| Czech | 2 | 1.1% |
| English | 30 | 15.7% |
| European | 121 | 63.3% |
| German | 19 | 10.0% |
| Italian | 26 | 13.6% |
| Norwegian | 2 | 1.1% | View All 6 Rows |
Immigrants in Crane

| Immigration Origin | # Population | % Population | View All 0 Rows |
Sex and Age in Crane
Sex and Age in Crane
The most populous age groups in Crane are 5 to 9 Years (60 | 65.2%) for men and 45 to 49 Years (36 | 36.4%) for women.
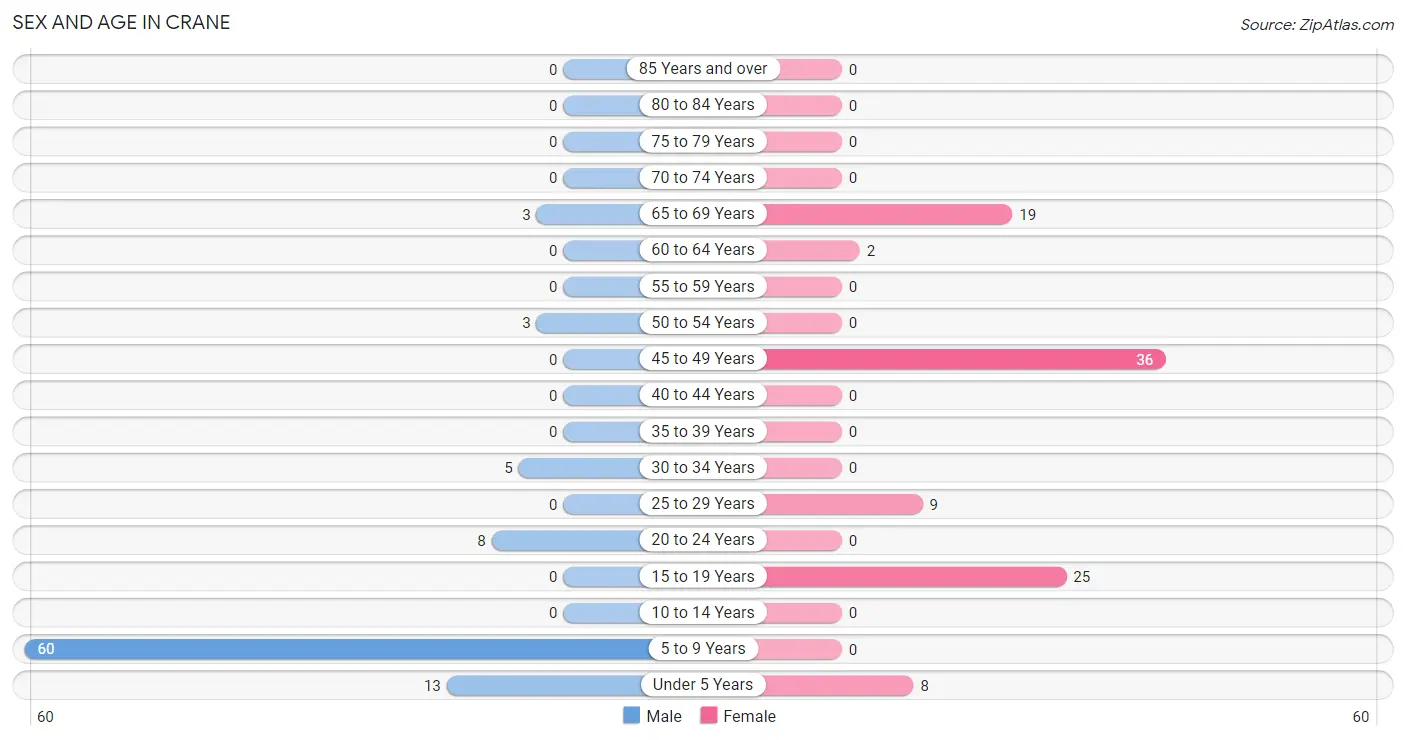
| Age Bracket | Male | Female |
| Under 5 Years | 13 (14.1%) | 8 (8.1%) |
| 5 to 9 Years | 60 (65.2%) | 0 (0.0%) |
| 10 to 14 Years | 0 (0.0%) | 0 (0.0%) |
| 15 to 19 Years | 0 (0.0%) | 25 (25.3%) |
| 20 to 24 Years | 8 (8.7%) | 0 (0.0%) |
| 25 to 29 Years | 0 (0.0%) | 9 (9.1%) |
| 30 to 34 Years | 5 (5.4%) | 0 (0.0%) |
| 35 to 39 Years | 0 (0.0%) | 0 (0.0%) |
| 40 to 44 Years | 0 (0.0%) | 0 (0.0%) |
| 45 to 49 Years | 0 (0.0%) | 36 (36.4%) |
| 50 to 54 Years | 3 (3.3%) | 0 (0.0%) |
| 55 to 59 Years | 0 (0.0%) | 0 (0.0%) |
| 60 to 64 Years | 0 (0.0%) | 2 (2.0%) |
| 65 to 69 Years | 3 (3.3%) | 19 (19.2%) |
| 70 to 74 Years | 0 (0.0%) | 0 (0.0%) |
| 75 to 79 Years | 0 (0.0%) | 0 (0.0%) |
| 80 to 84 Years | 0 (0.0%) | 0 (0.0%) |
| 85 Years and over | 0 (0.0%) | 0 (0.0%) |
| Total | 92 (100.0%) | 99 (100.0%) |
Families and Households in Crane
Median Family Size in Crane
The median family size in Crane is 3.66 persons per family, with married-couple families (8 | 17.0%) accounting for the largest median family size of 5 persons per family. On the other hand, single female/mother families (36 | 76.6%) represent the smallest median family size with 3.36 persons per family.
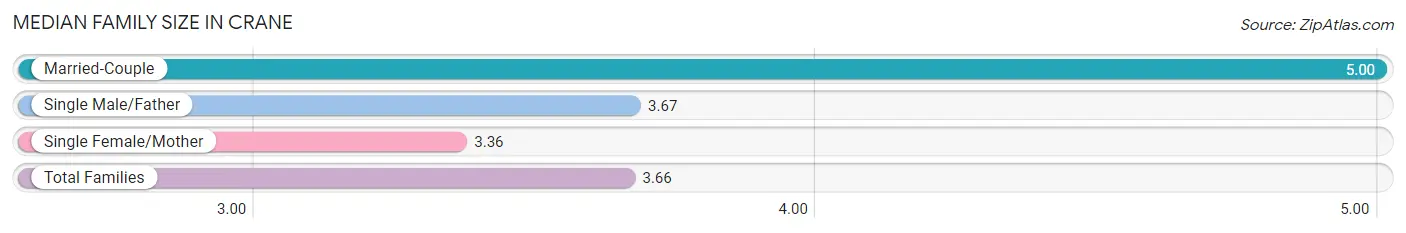
| Family Type | # Families | Family Size |
| Married-Couple | 8 (17.0%) | 5.00 |
| Single Male/Father | 3 (6.4%) | 3.67 |
| Single Female/Mother | 36 (76.6%) | 3.36 |
| Total Families | 47 (100.0%) | 3.66 |
Median Household Size in Crane
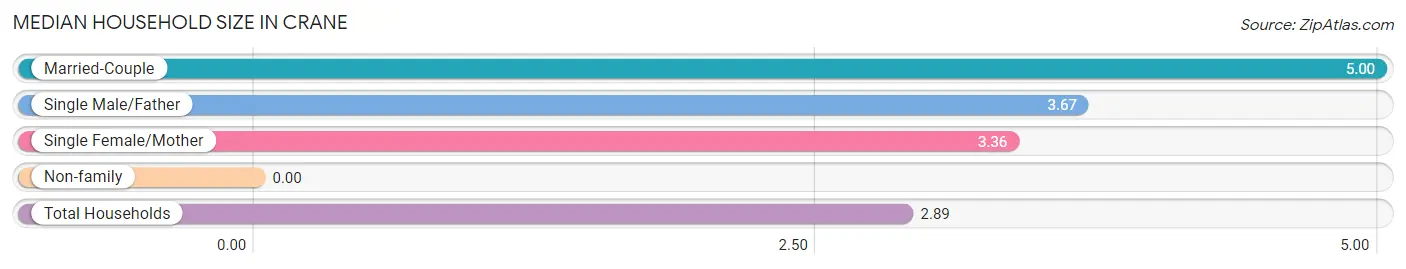
| Household Type | # Households | Household Size |
| Married-Couple | 8 (12.1%) | 5.00 |
| Single Male/Father | 3 (4.5%) | 3.67 |
| Single Female/Mother | 36 (54.5%) | 3.36 |
| Non-family | 19 (28.8%) | - |
| Total Households | 66 (100.0%) | 2.89 |
Household Size by Marriage Status in Crane
Out of a total of 66 households in Crane, 47 (71.2%) are family households, while 19 (28.8%) are nonfamily households. The most numerous type of family households are 3-person households, comprising 36, and the most common type of nonfamily households are 1-person households, comprising 19.
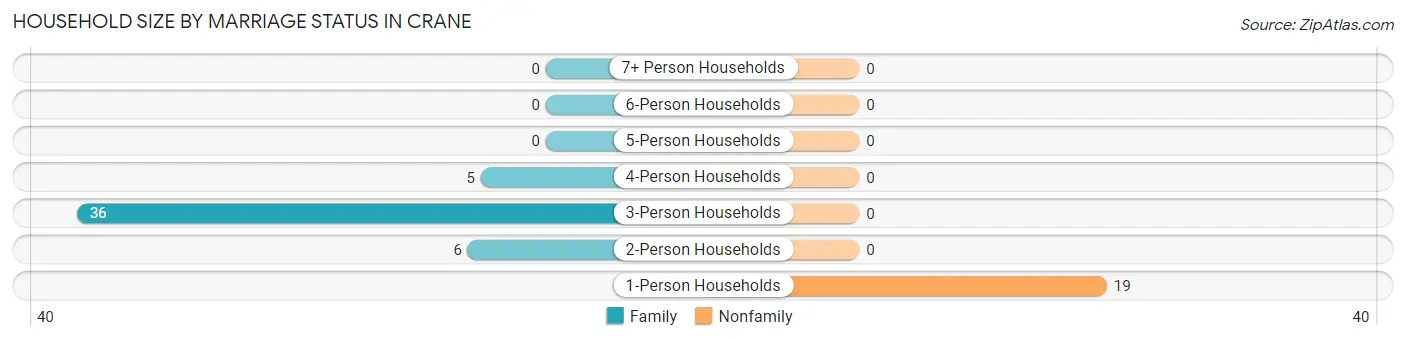
| Household Size | Family Households | Nonfamily Households |
| 1-Person Households | - | 19 (28.8%) |
| 2-Person Households | 6 (9.1%) | 0 (0.0%) |
| 3-Person Households | 36 (54.5%) | 0 (0.0%) |
| 4-Person Households | 5 (7.6%) | 0 (0.0%) |
| 5-Person Households | 0 (0.0%) | 0 (0.0%) |
| 6-Person Households | 0 (0.0%) | 0 (0.0%) |
| 7+ Person Households | 0 (0.0%) | 0 (0.0%) |
| Total | 47 (71.2%) | 19 (28.8%) |
Female Fertility in Crane
Fertility by Age in Crane
Average fertility rate in Crane is 129.0 births per 1,000 women. Women in the age bracket of 20 to 34 years have the highest fertility rate with 1,000.0 births per 1,000 women. Women in the age bracket of 20 to 34 years acount for 100.0% of all women with births.
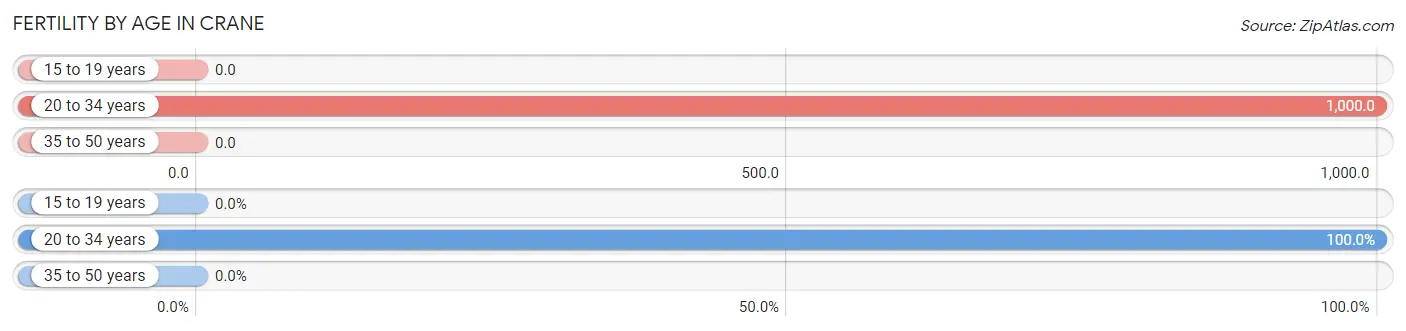
| Age Bracket | Women with Births | Births / 1,000 Women |
| 15 to 19 years | 0 (0.0%) | 0.0 |
| 20 to 34 years | 9 (100.0%) | 1,000.0 |
| 35 to 50 years | 0 (0.0%) | 0.0 |
| Total | 9 (100.0%) | 129.0 |
Fertility by Age by Marriage Status in Crane
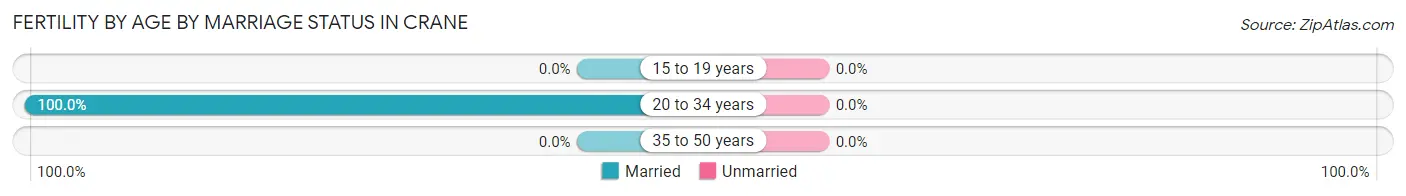
| Age Bracket | Married | Unmarried |
| 15 to 19 years | 0 (0.0%) | 0 (0.0%) |
| 20 to 34 years | 9 (100.0%) | 0 (0.0%) |
| 35 to 50 years | 0 (0.0%) | 0 (0.0%) |
| Total | 9 (100.0%) | 0 (0.0%) |
Fertility by Education in Crane
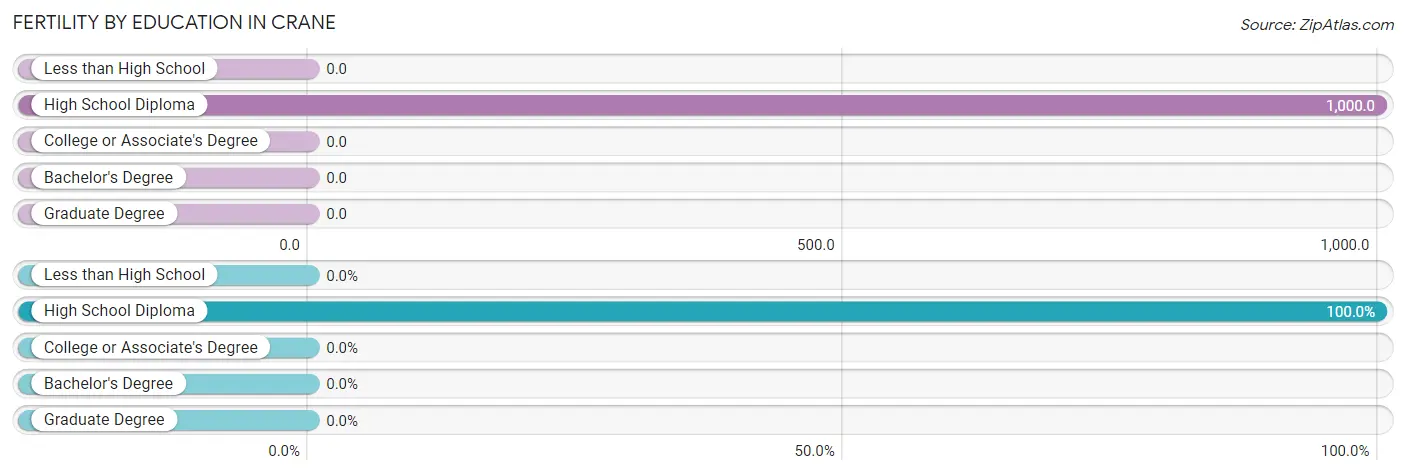
| Educational Attainment | Women with Births | Births / 1,000 Women |
| Less than High School | 0 (0.0%) | 0.0 |
| High School Diploma | 9 (100.0%) | 1,000.0 |
| College or Associate's Degree | 0 (0.0%) | 0.0 |
| Bachelor's Degree | 0 (0.0%) | 0.0 |
| Graduate Degree | 0 (0.0%) | 0.0 |
| Total | 9 (100.0%) | 129.0 |
Fertility by Education by Marriage Status in Crane
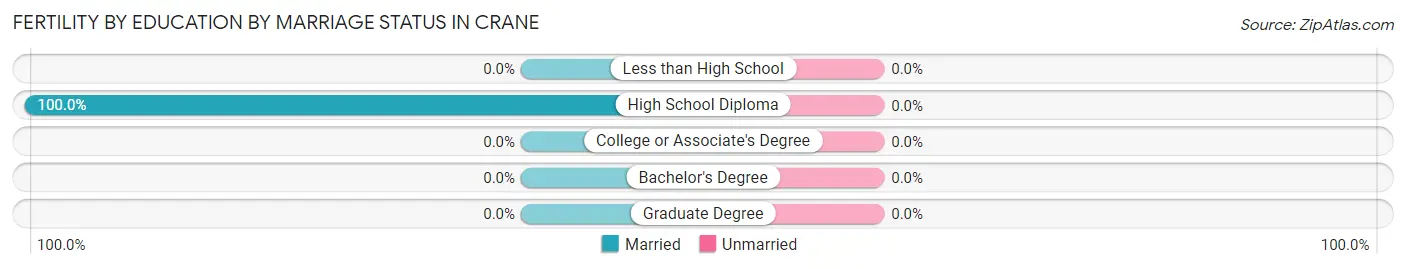
| Educational Attainment | Married | Unmarried |
| Less than High School | 0 (0.0%) | 0 (0.0%) |
| High School Diploma | 9 (100.0%) | 0 (0.0%) |
| College or Associate's Degree | 0 (0.0%) | 0 (0.0%) |
| Bachelor's Degree | 0 (0.0%) | 0 (0.0%) |
| Graduate Degree | 0 (0.0%) | 0 (0.0%) |
| Total | 9 (100.0%) | 0 (0.0%) |
Employment Characteristics in Crane
Employment by Class of Employer in Crane
Among the 18 employed individuals in Crane, private company employees (11 | 61.1%), not-for-profit organizations (5 | 27.8%), and local government employees (2 | 11.1%) make up the most common classes of employment.
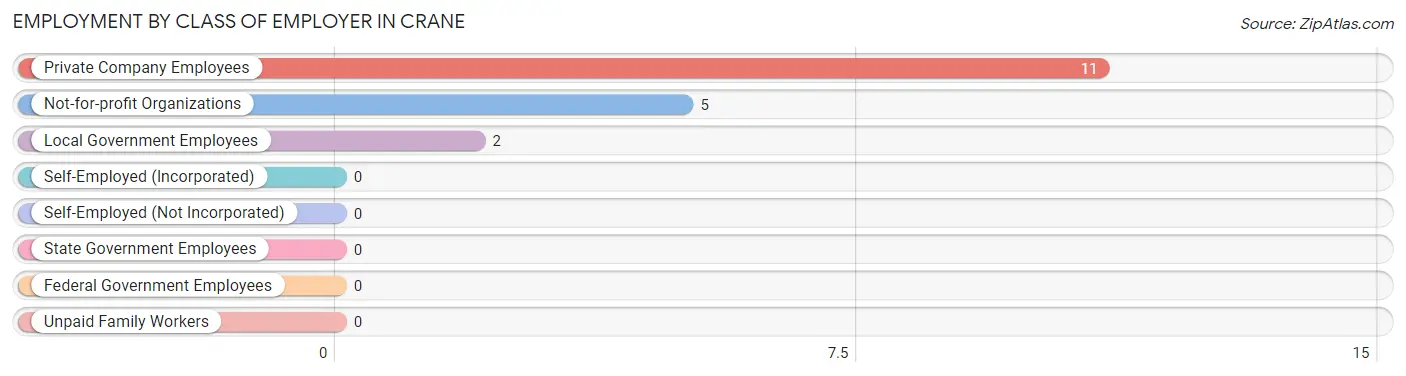
| Employer Class | # Employees | % Employees |
| Private Company Employees | 11 | 61.1% |
| Self-Employed (Incorporated) | 0 | 0.0% |
| Self-Employed (Not Incorporated) | 0 | 0.0% |
| Not-for-profit Organizations | 5 | 27.8% |
| Local Government Employees | 2 | 11.1% |
| State Government Employees | 0 | 0.0% |
| Federal Government Employees | 0 | 0.0% |
| Unpaid Family Workers | 0 | 0.0% |
| Total | 18 | 100.0% |
Employment Status by Age in Crane
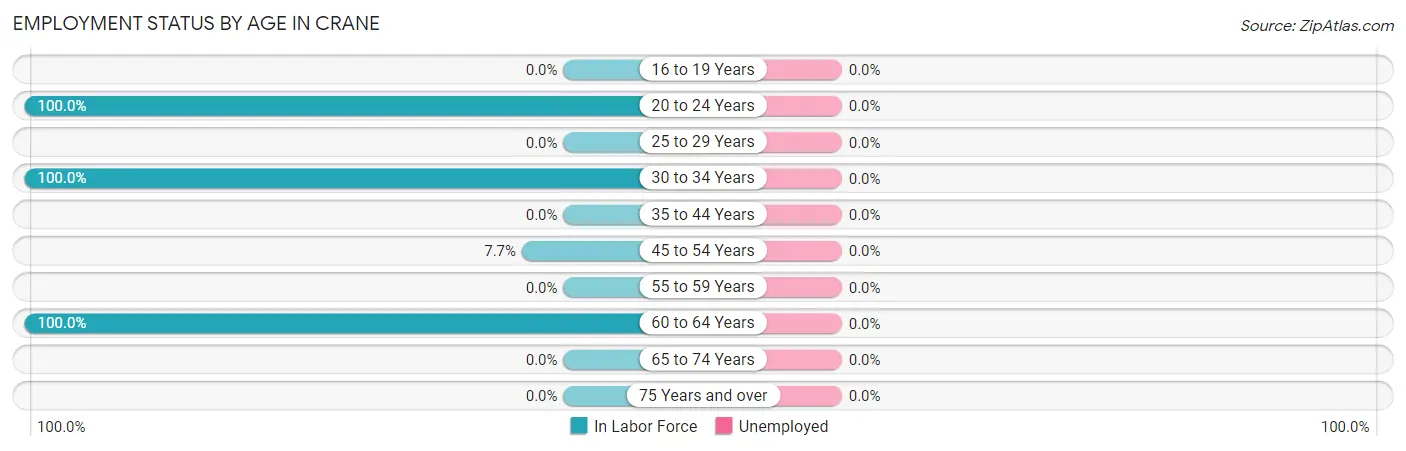
| Age Bracket | In Labor Force | Unemployed |
| 16 to 19 Years | 0 (0.0%) | 0 (0.0%) |
| 20 to 24 Years | 8 (100.0%) | 0 (0.0%) |
| 25 to 29 Years | 0 (0.0%) | 0 (0.0%) |
| 30 to 34 Years | 5 (100.0%) | 0 (0.0%) |
| 35 to 44 Years | 0 (0.0%) | 0 (0.0%) |
| 45 to 54 Years | 3 (7.7%) | 0 (0.0%) |
| 55 to 59 Years | 0 (0.0%) | 0 (0.0%) |
| 60 to 64 Years | 2 (100.0%) | 0 (0.0%) |
| 65 to 74 Years | 0 (0.0%) | 0 (0.0%) |
| 75 Years and over | 0 (0.0%) | 0 (0.0%) |
| Total | 18 (16.4%) | 0 (0.0%) |
Employment Status by Educational Attainment in Crane
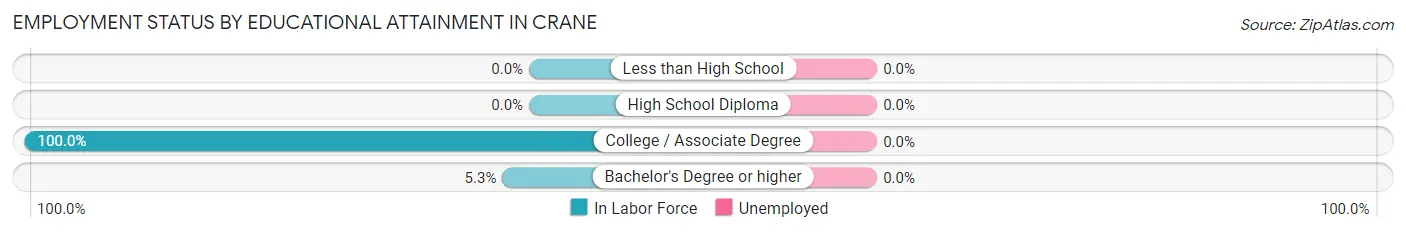
| Educational Attainment | In Labor Force | Unemployed |
| Less than High School | 0 (0.0%) | 0 (0.0%) |
| High School Diploma | 0 (0.0%) | 0 (0.0%) |
| College / Associate Degree | 8 (100.0%) | 0 (0.0%) |
| Bachelor's Degree or higher | 2 (5.3%) | 0 (0.0%) |
| Total | 10 (18.2%) | 0 (0.0%) |
Employment Occupations by Sex in Crane
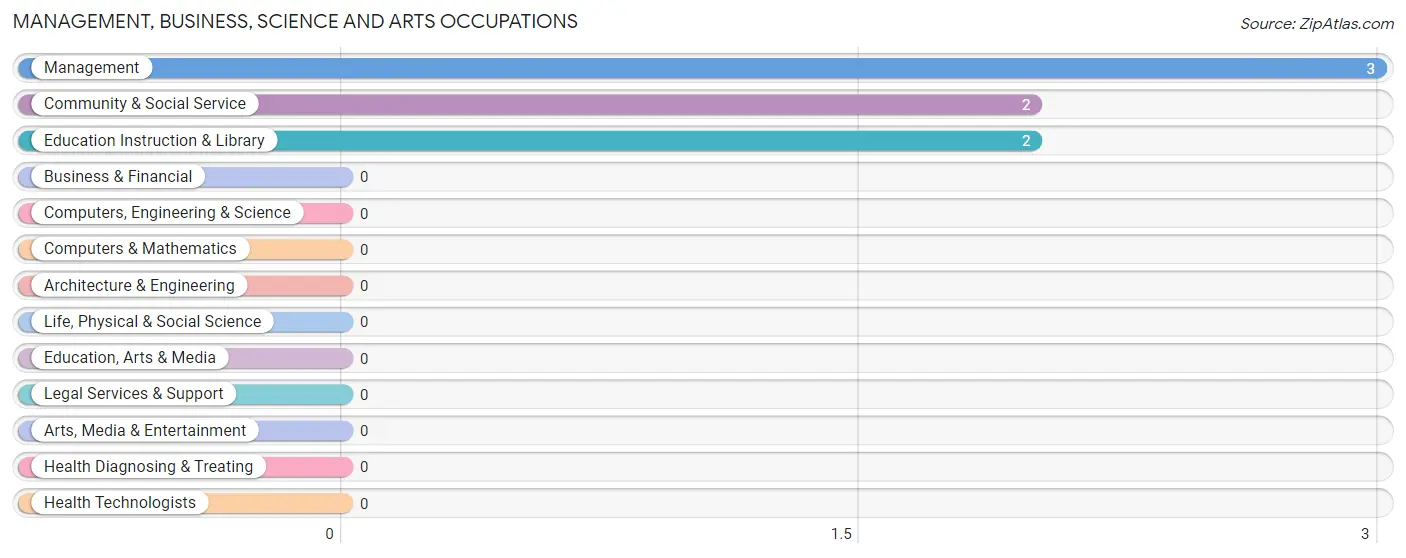
Management, Business, Science and Arts Occupations
The most common Management, Business, Science and Arts occupations in Crane are Management (3 | 16.7%), Community & Social Service (2 | 11.1%), and Education Instruction & Library (2 | 11.1%).
Management, Business, Science and Arts Occupations by Sex
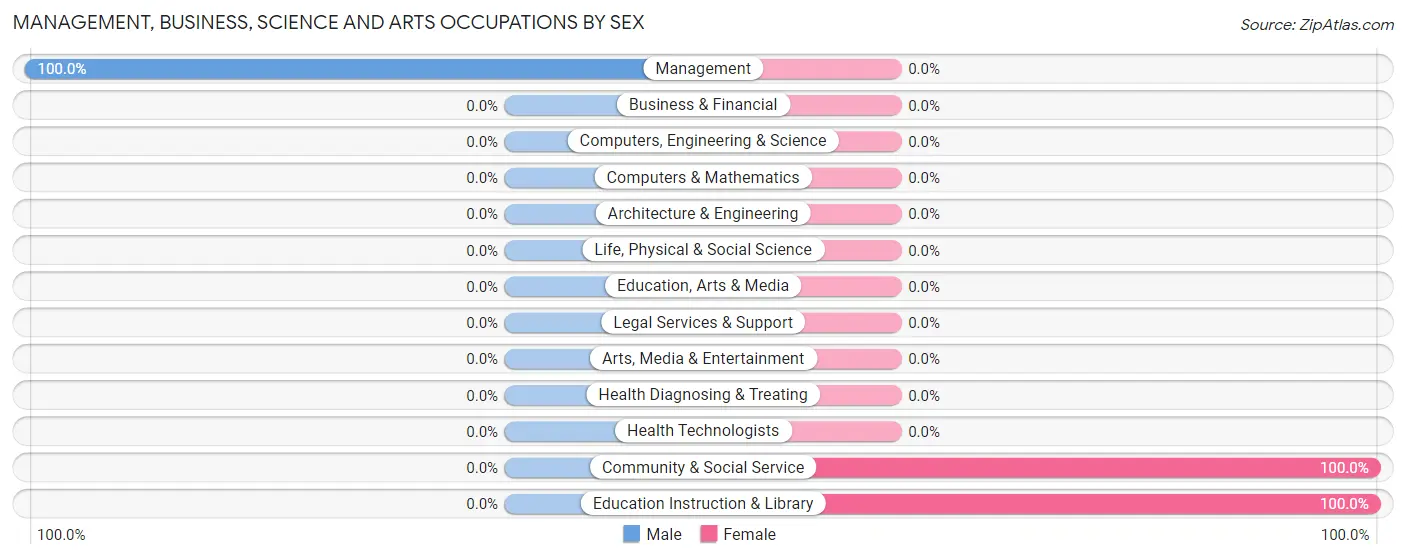
| Occupation | Male | Female |
| Management | 3 (100.0%) | 0 (0.0%) |
| Business & Financial | 0 (0.0%) | 0 (0.0%) |
| Computers, Engineering & Science | 0 (0.0%) | 0 (0.0%) |
| Computers & Mathematics | 0 (0.0%) | 0 (0.0%) |
| Architecture & Engineering | 0 (0.0%) | 0 (0.0%) |
| Life, Physical & Social Science | 0 (0.0%) | 0 (0.0%) |
| Community & Social Service | 0 (0.0%) | 2 (100.0%) |
| Education, Arts & Media | 0 (0.0%) | 0 (0.0%) |
| Legal Services & Support | 0 (0.0%) | 0 (0.0%) |
| Education Instruction & Library | 0 (0.0%) | 2 (100.0%) |
| Arts, Media & Entertainment | 0 (0.0%) | 0 (0.0%) |
| Health Diagnosing & Treating | 0 (0.0%) | 0 (0.0%) |
| Health Technologists | 0 (0.0%) | 0 (0.0%) |
| Total (Category) | 3 (60.0%) | 2 (40.0%) |
| Total (Overall) | 16 (88.9%) | 2 (11.1%) |
Services Occupations
Services Occupations by Sex
| Occupation | Male | Female |
| Healthcare Support | 0 (0.0%) | 0 (0.0%) |
| Security & Protection | 0 (0.0%) | 0 (0.0%) |
| Firefighting & Prevention | 0 (0.0%) | 0 (0.0%) |
| Law Enforcement | 0 (0.0%) | 0 (0.0%) |
| Food Preparation & Serving | 0 (0.0%) | 0 (0.0%) |
| Cleaning & Maintenance | 0 (0.0%) | 0 (0.0%) |
| Personal Care & Service | 0 (0.0%) | 0 (0.0%) |
| Total (Category) | 0 (0.0%) | 0 (0.0%) |
| Total (Overall) | 16 (88.9%) | 2 (11.1%) |
Sales and Office Occupations
Sales and Office Occupations by Sex
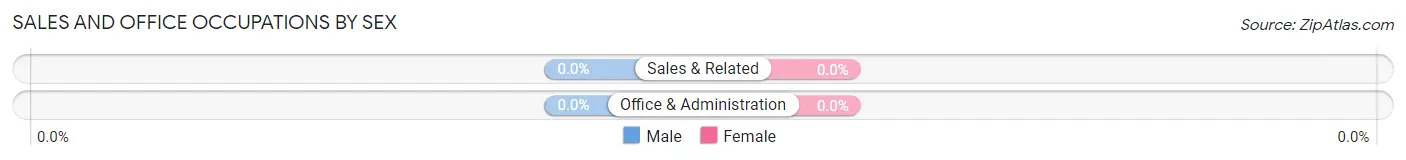
| Occupation | Male | Female |
| Sales & Related | 0 (0.0%) | 0 (0.0%) |
| Office & Administration | 0 (0.0%) | 0 (0.0%) |
| Total (Category) | 0 (0.0%) | 0 (0.0%) |
| Total (Overall) | 16 (88.9%) | 2 (11.1%) |
Natural Resources, Construction and Maintenance Occupations
The most common Natural Resources, Construction and Maintenance occupations in Crane are , and Installation, Maintenance & Repair (5 | 27.8%).
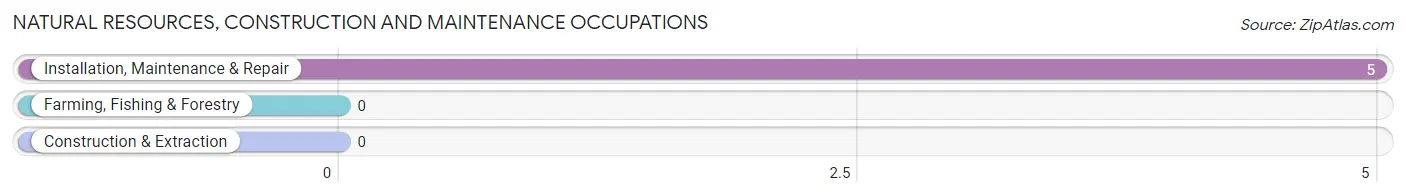
Natural Resources, Construction and Maintenance Occupations by Sex
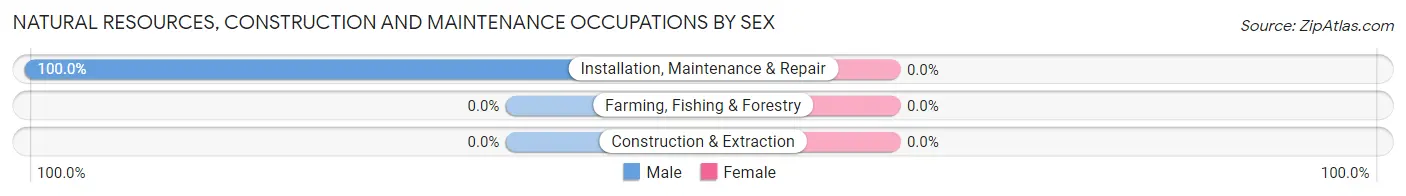
| Occupation | Male | Female |
| Farming, Fishing & Forestry | 0 (0.0%) | 0 (0.0%) |
| Construction & Extraction | 0 (0.0%) | 0 (0.0%) |
| Installation, Maintenance & Repair | 5 (100.0%) | 0 (0.0%) |
| Total (Category) | 5 (100.0%) | 0 (0.0%) |
| Total (Overall) | 16 (88.9%) | 2 (11.1%) |
Production, Transportation and Moving Occupations
The most common Production, Transportation and Moving occupations in Crane are , and Material Moving (8 | 44.4%).
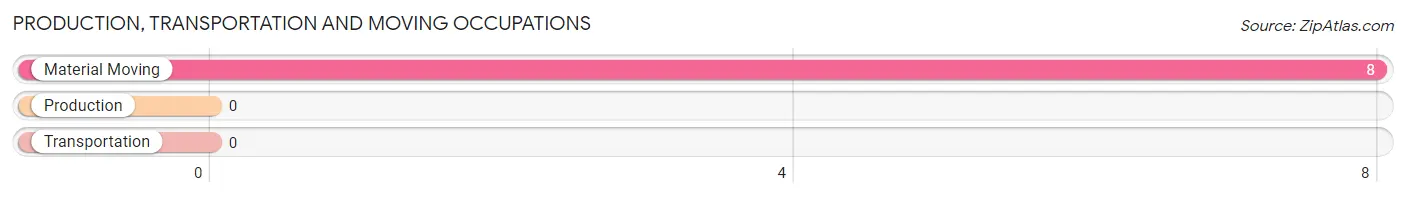
Production, Transportation and Moving Occupations by Sex
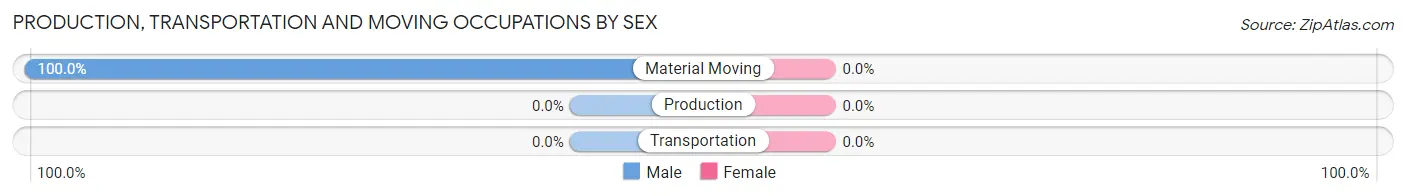
| Occupation | Male | Female |
| Production | 0 (0.0%) | 0 (0.0%) |
| Transportation | 0 (0.0%) | 0 (0.0%) |
| Material Moving | 8 (100.0%) | 0 (0.0%) |
| Total (Category) | 8 (100.0%) | 0 (0.0%) |
| Total (Overall) | 16 (88.9%) | 2 (11.1%) |
Employment Industries by Sex in Crane
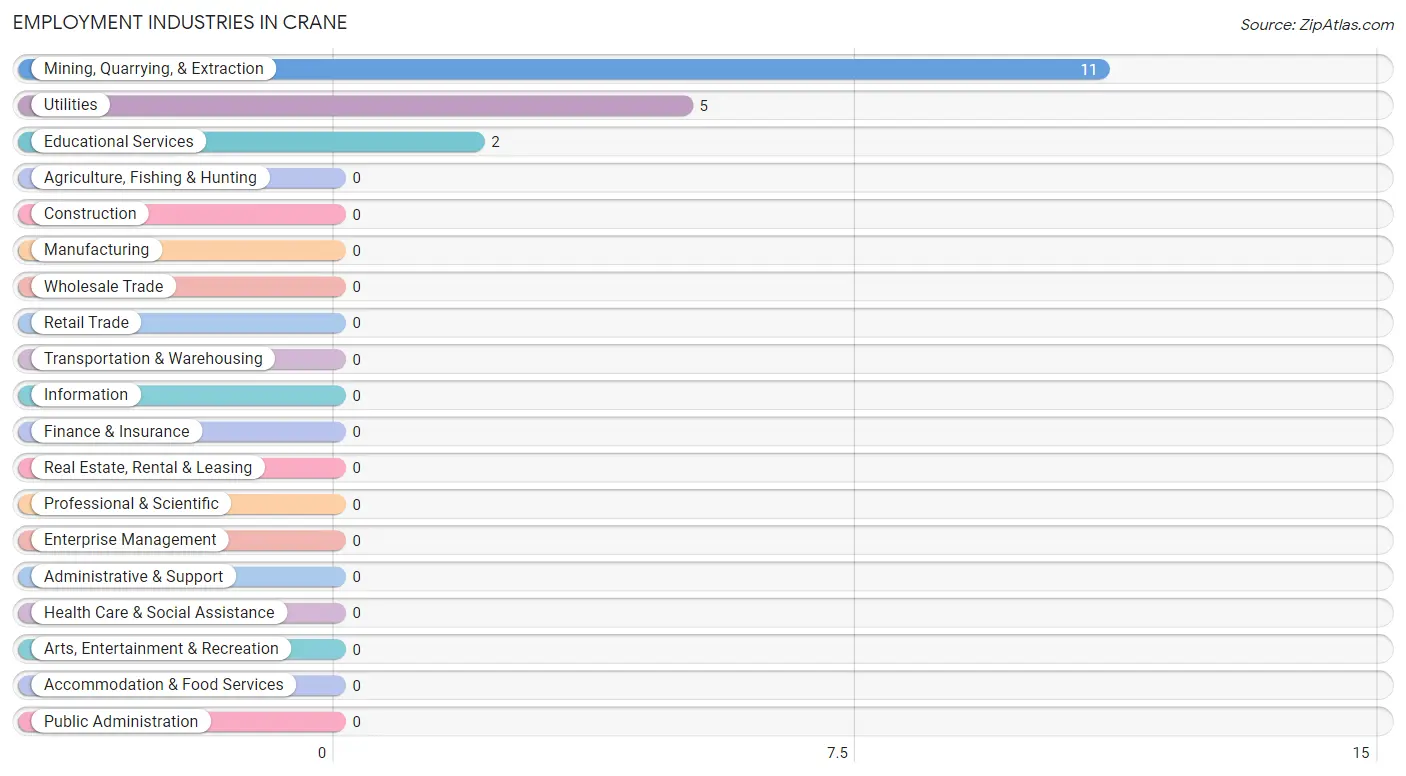
Employment Industries in Crane
The major employment industries in Crane include Mining, Quarrying, & Extraction (11 | 61.1%), Utilities (5 | 27.8%), and Educational Services (2 | 11.1%).
Employment Industries by Sex in Crane
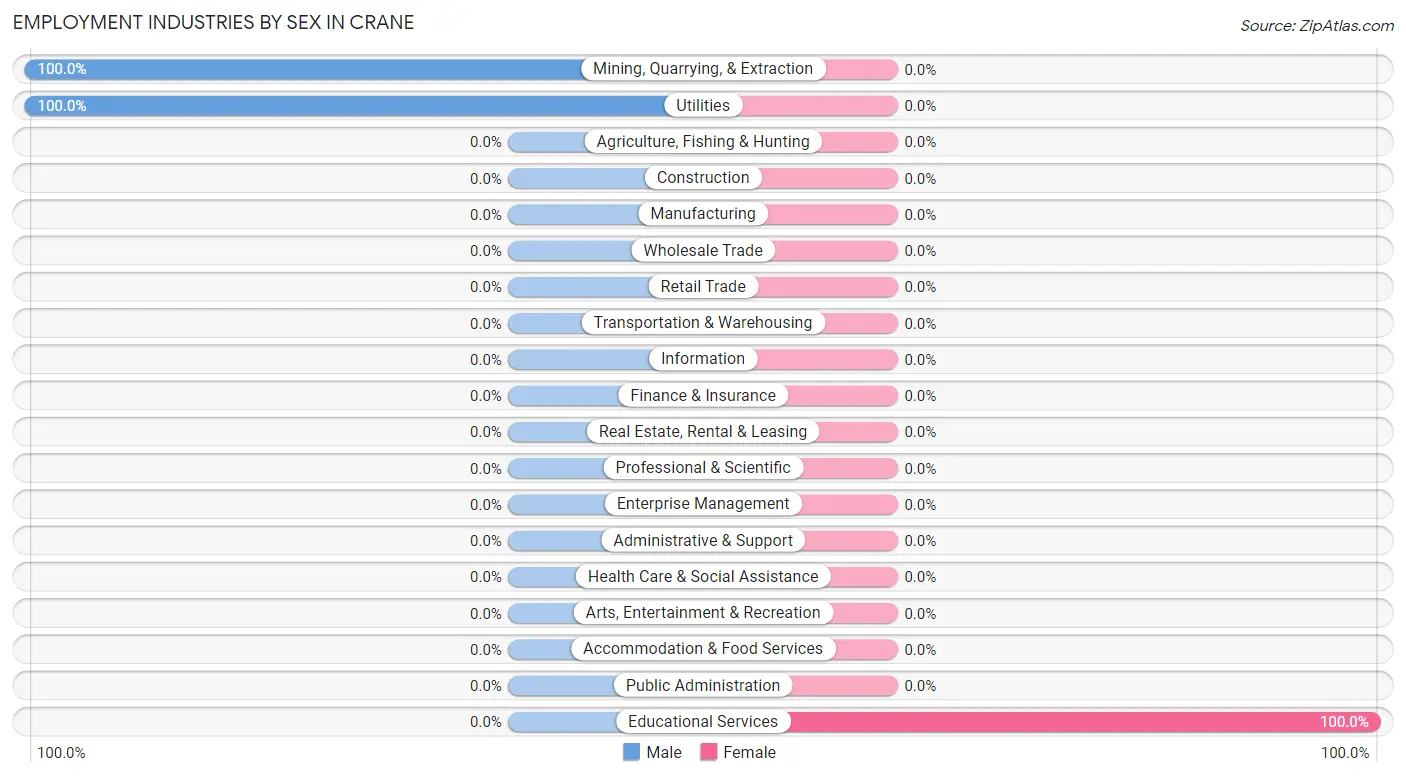
| Industry | Male | Female |
| Agriculture, Fishing & Hunting | 0 (0.0%) | 0 (0.0%) |
| Mining, Quarrying, & Extraction | 11 (100.0%) | 0 (0.0%) |
| Construction | 0 (0.0%) | 0 (0.0%) |
| Manufacturing | 0 (0.0%) | 0 (0.0%) |
| Wholesale Trade | 0 (0.0%) | 0 (0.0%) |
| Retail Trade | 0 (0.0%) | 0 (0.0%) |
| Transportation & Warehousing | 0 (0.0%) | 0 (0.0%) |
| Utilities | 5 (100.0%) | 0 (0.0%) |
| Information | 0 (0.0%) | 0 (0.0%) |
| Finance & Insurance | 0 (0.0%) | 0 (0.0%) |
| Real Estate, Rental & Leasing | 0 (0.0%) | 0 (0.0%) |
| Professional & Scientific | 0 (0.0%) | 0 (0.0%) |
| Enterprise Management | 0 (0.0%) | 0 (0.0%) |
| Administrative & Support | 0 (0.0%) | 0 (0.0%) |
| Educational Services | 0 (0.0%) | 2 (100.0%) |
| Health Care & Social Assistance | 0 (0.0%) | 0 (0.0%) |
| Arts, Entertainment & Recreation | 0 (0.0%) | 0 (0.0%) |
| Accommodation & Food Services | 0 (0.0%) | 0 (0.0%) |
| Public Administration | 0 (0.0%) | 0 (0.0%) |
| Total | 16 (88.9%) | 2 (11.1%) |
Education in Crane
School Enrollment in Crane
The most common levels of schooling among the 85 students in Crane are elementary school (60 | 70.6%), and high school (25 | 29.4%).
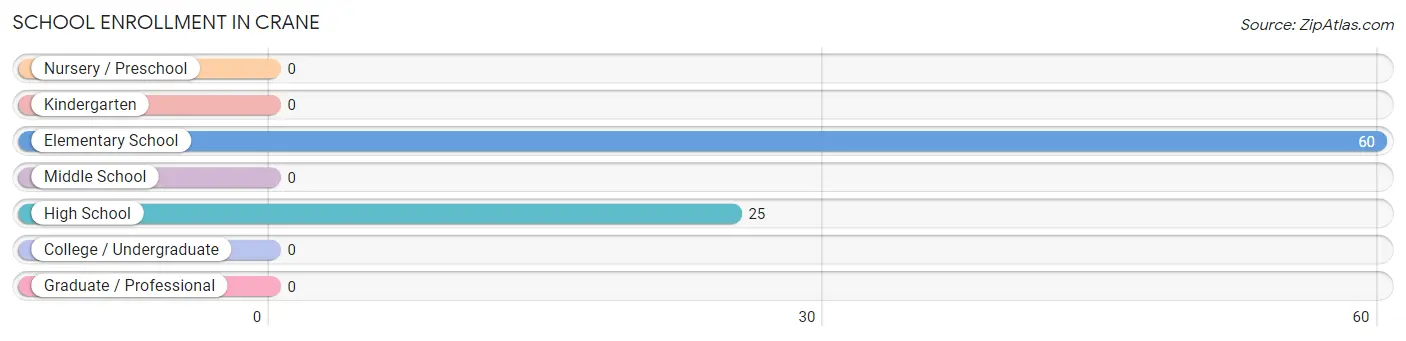
| School Level | # Students | % Students |
| Nursery / Preschool | 0 | 0.0% |
| Kindergarten | 0 | 0.0% |
| Elementary School | 60 | 70.6% |
| Middle School | 0 | 0.0% |
| High School | 25 | 29.4% |
| College / Undergraduate | 0 | 0.0% |
| Graduate / Professional | 0 | 0.0% |
| Total | 85 | 100.0% |
School Enrollment by Age by Funding Source in Crane
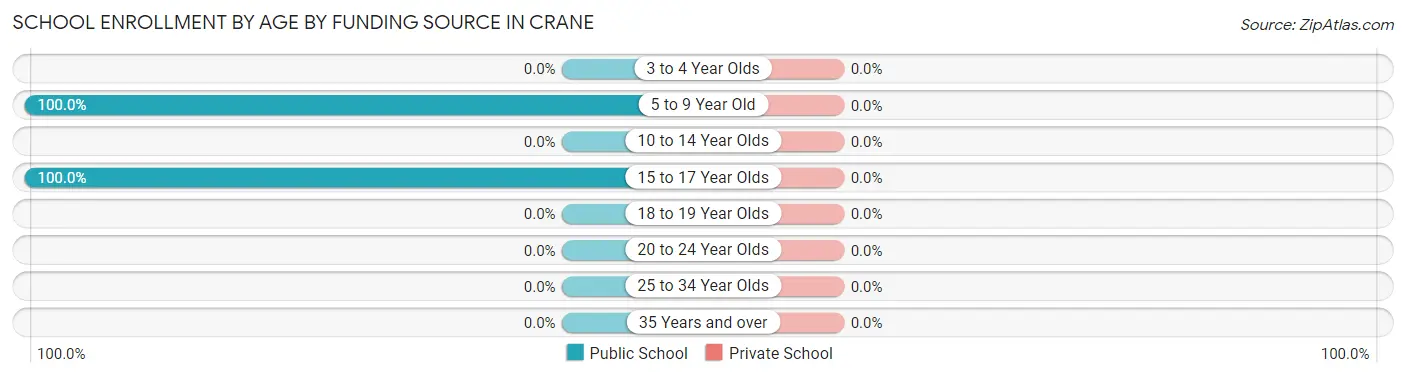
| Age Bracket | Public School | Private School |
| 3 to 4 Year Olds | 0 (0.0%) | 0 (0.0%) |
| 5 to 9 Year Old | 60 (100.0%) | 0 (0.0%) |
| 10 to 14 Year Olds | 0 (0.0%) | 0 (0.0%) |
| 15 to 17 Year Olds | 25 (100.0%) | 0 (0.0%) |
| 18 to 19 Year Olds | 0 (0.0%) | 0 (0.0%) |
| 20 to 24 Year Olds | 0 (0.0%) | 0 (0.0%) |
| 25 to 34 Year Olds | 0 (0.0%) | 0 (0.0%) |
| 35 Years and over | 0 (0.0%) | 0 (0.0%) |
| Total | 85 (100.0%) | 0 (0.0%) |
Educational Attainment by Field of Study in Crane
Education (38 | 66.7%), and psychology (19 | 33.3%) are the most common fields of study among 57 individuals in Crane who have obtained a bachelor's degree or higher.
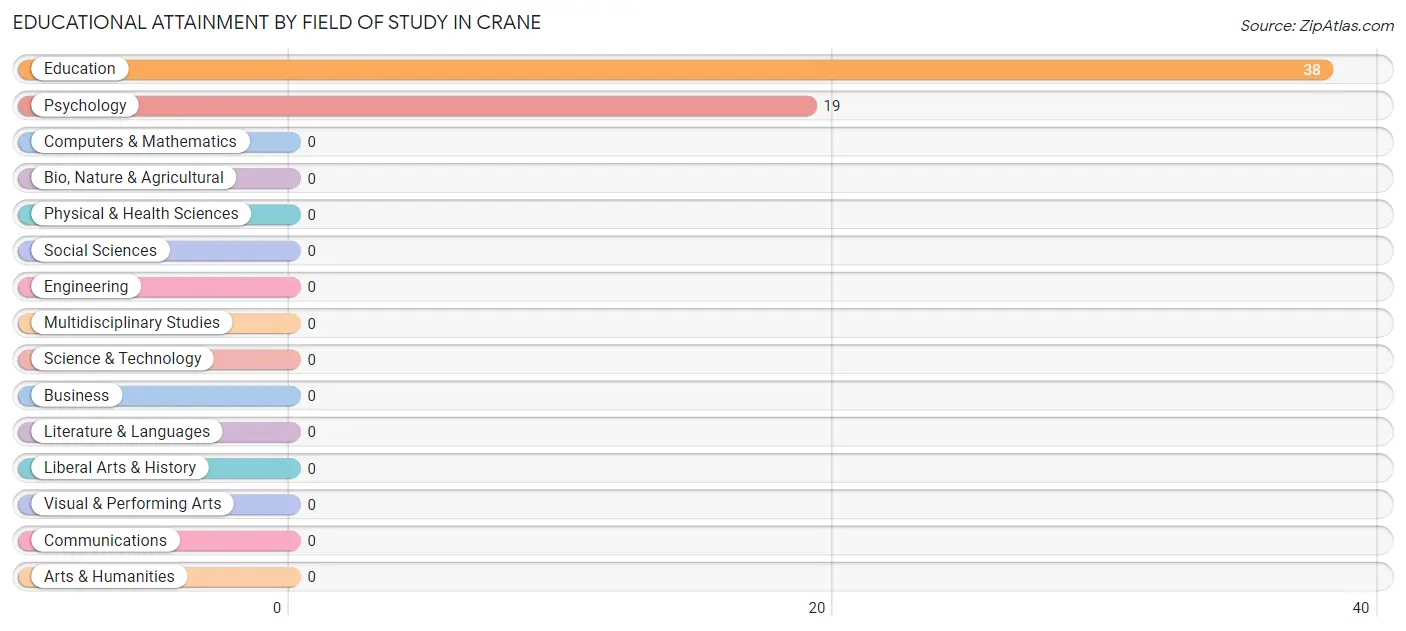
| Field of Study | # Graduates | % Graduates |
| Computers & Mathematics | 0 | 0.0% |
| Bio, Nature & Agricultural | 0 | 0.0% |
| Physical & Health Sciences | 0 | 0.0% |
| Psychology | 19 | 33.3% |
| Social Sciences | 0 | 0.0% |
| Engineering | 0 | 0.0% |
| Multidisciplinary Studies | 0 | 0.0% |
| Science & Technology | 0 | 0.0% |
| Business | 0 | 0.0% |
| Education | 38 | 66.7% |
| Literature & Languages | 0 | 0.0% |
| Liberal Arts & History | 0 | 0.0% |
| Visual & Performing Arts | 0 | 0.0% |
| Communications | 0 | 0.0% |
| Arts & Humanities | 0 | 0.0% |
| Total | 57 | 100.0% |
Transportation & Commute in Crane
Vehicle Availability by Sex in Crane
The most prevalent vehicle ownership categories in Crane are males with 3 vehicles (11, accounting for 68.8%) and females with 3 vehicles (2, making up 550.0%).
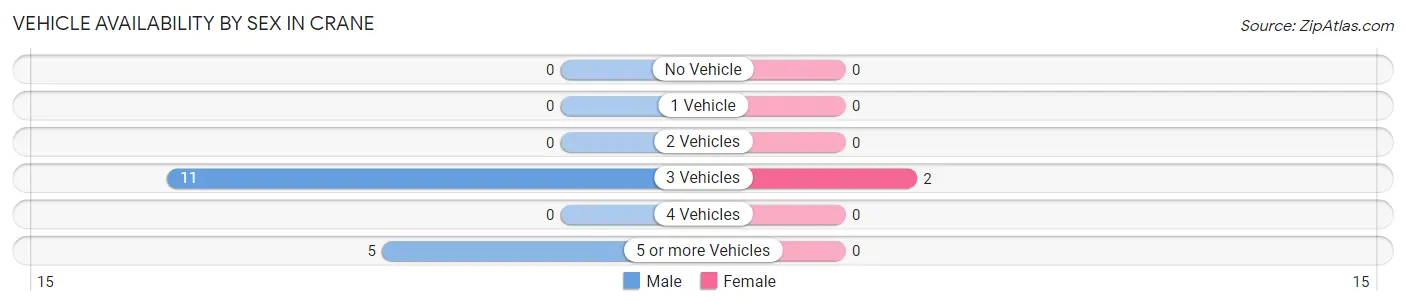
| Vehicles Available | Male | Female |
| No Vehicle | 0 (0.0%) | 0 (0.0%) |
| 1 Vehicle | 0 (0.0%) | 0 (0.0%) |
| 2 Vehicles | 0 (0.0%) | 0 (0.0%) |
| 3 Vehicles | 11 (68.8%) | 2 (100.0%) |
| 4 Vehicles | 0 (0.0%) | 0 (0.0%) |
| 5 or more Vehicles | 5 (31.2%) | 0 (0.0%) |
| Total | 16 (100.0%) | 2 (100.0%) |
Commute Time in Crane
The most frequently occuring commute durations in Crane are 60 to 89 minutes (8 commuters, 44.4%), 15 to 19 minutes (5 commuters, 27.8%), and 20 to 24 minutes (5 commuters, 27.8%).
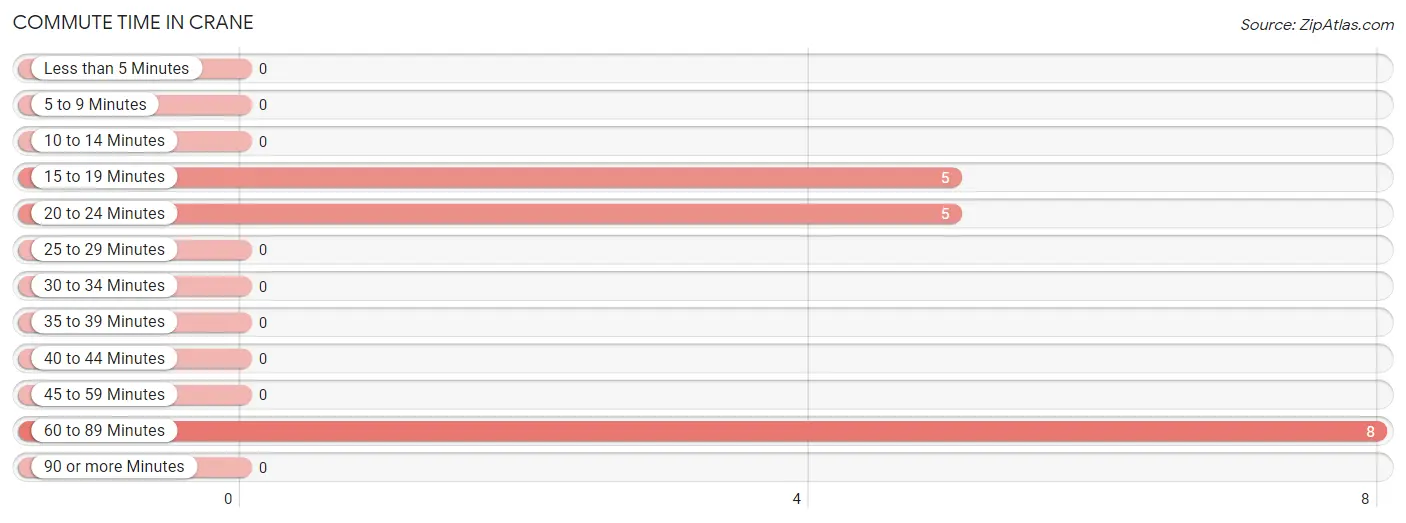
| Commute Time | # Commuters | % Commuters |
| Less than 5 Minutes | 0 | 0.0% |
| 5 to 9 Minutes | 0 | 0.0% |
| 10 to 14 Minutes | 0 | 0.0% |
| 15 to 19 Minutes | 5 | 27.8% |
| 20 to 24 Minutes | 5 | 27.8% |
| 25 to 29 Minutes | 0 | 0.0% |
| 30 to 34 Minutes | 0 | 0.0% |
| 35 to 39 Minutes | 0 | 0.0% |
| 40 to 44 Minutes | 0 | 0.0% |
| 45 to 59 Minutes | 0 | 0.0% |
| 60 to 89 Minutes | 8 | 44.4% |
| 90 or more Minutes | 0 | 0.0% |
Commute Time by Sex in Crane
The most common commute times in Crane are 60 to 89 minutes (8 commuters, 50.0%) for males and 15 to 19 minutes (2 commuters, 100.0%) for females.
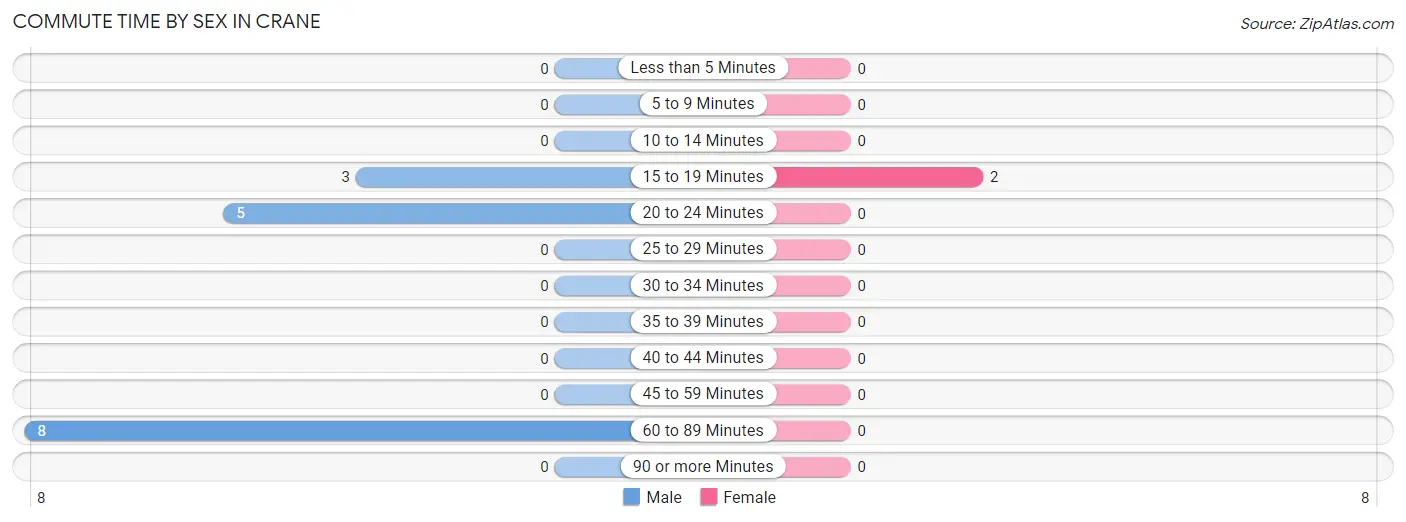
| Commute Time | Male | Female |
| Less than 5 Minutes | 0 (0.0%) | 0 (0.0%) |
| 5 to 9 Minutes | 0 (0.0%) | 0 (0.0%) |
| 10 to 14 Minutes | 0 (0.0%) | 0 (0.0%) |
| 15 to 19 Minutes | 3 (18.8%) | 2 (100.0%) |
| 20 to 24 Minutes | 5 (31.2%) | 0 (0.0%) |
| 25 to 29 Minutes | 0 (0.0%) | 0 (0.0%) |
| 30 to 34 Minutes | 0 (0.0%) | 0 (0.0%) |
| 35 to 39 Minutes | 0 (0.0%) | 0 (0.0%) |
| 40 to 44 Minutes | 0 (0.0%) | 0 (0.0%) |
| 45 to 59 Minutes | 0 (0.0%) | 0 (0.0%) |
| 60 to 89 Minutes | 8 (50.0%) | 0 (0.0%) |
| 90 or more Minutes | 0 (0.0%) | 0 (0.0%) |
Time of Departure to Work by Sex in Crane
The most frequent times of departure to work in Crane are 12:00 AM to 4:59 AM (8, 50.0%) for males and 7:30 AM to 7:59 AM (2, 100.0%) for females.
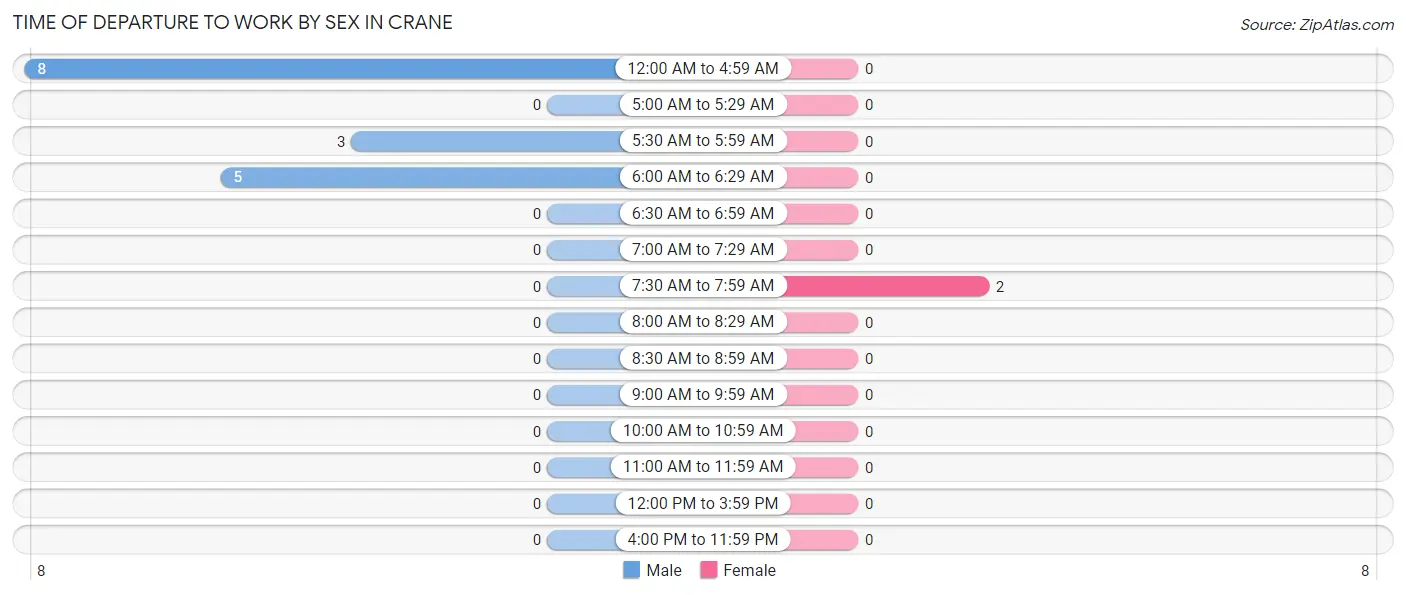
| Time of Departure | Male | Female |
| 12:00 AM to 4:59 AM | 8 (50.0%) | 0 (0.0%) |
| 5:00 AM to 5:29 AM | 0 (0.0%) | 0 (0.0%) |
| 5:30 AM to 5:59 AM | 3 (18.8%) | 0 (0.0%) |
| 6:00 AM to 6:29 AM | 5 (31.2%) | 0 (0.0%) |
| 6:30 AM to 6:59 AM | 0 (0.0%) | 0 (0.0%) |
| 7:00 AM to 7:29 AM | 0 (0.0%) | 0 (0.0%) |
| 7:30 AM to 7:59 AM | 0 (0.0%) | 2 (100.0%) |
| 8:00 AM to 8:29 AM | 0 (0.0%) | 0 (0.0%) |
| 8:30 AM to 8:59 AM | 0 (0.0%) | 0 (0.0%) |
| 9:00 AM to 9:59 AM | 0 (0.0%) | 0 (0.0%) |
| 10:00 AM to 10:59 AM | 0 (0.0%) | 0 (0.0%) |
| 11:00 AM to 11:59 AM | 0 (0.0%) | 0 (0.0%) |
| 12:00 PM to 3:59 PM | 0 (0.0%) | 0 (0.0%) |
| 4:00 PM to 11:59 PM | 0 (0.0%) | 0 (0.0%) |
| Total | 16 (100.0%) | 2 (100.0%) |
Housing Occupancy in Crane
Occupancy by Ownership in Crane
Of the total 66 dwellings in Crane, owner-occupied units account for 66 (100.0%), while renter-occupied units make up 0 (0.0%).
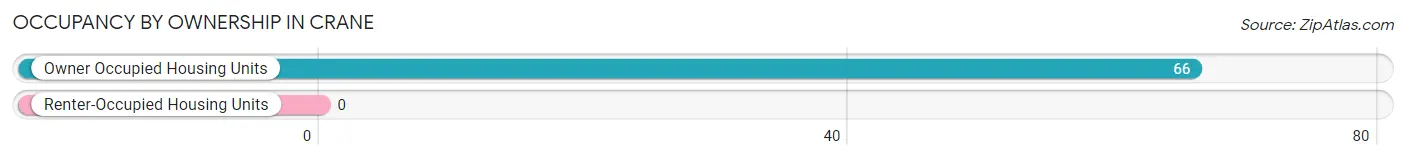
| Occupancy | # Housing Units | % Housing Units |
| Owner Occupied Housing Units | 66 | 100.0% |
| Renter-Occupied Housing Units | 0 | 0.0% |
| Total Occupied Housing Units | 66 | 100.0% |
Occupancy by Household Size in Crane
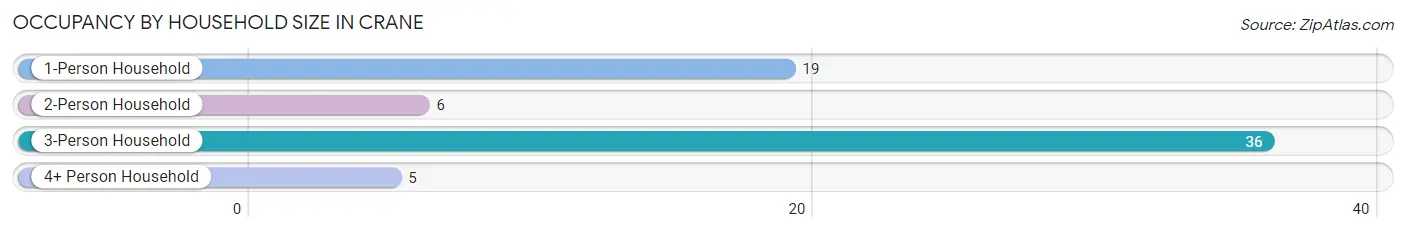
| Household Size | # Housing Units | % Housing Units |
| 1-Person Household | 19 | 28.8% |
| 2-Person Household | 6 | 9.1% |
| 3-Person Household | 36 | 54.5% |
| 4+ Person Household | 5 | 7.6% |
| Total Housing Units | 66 | 100.0% |
Occupancy by Ownership by Household Size in Crane
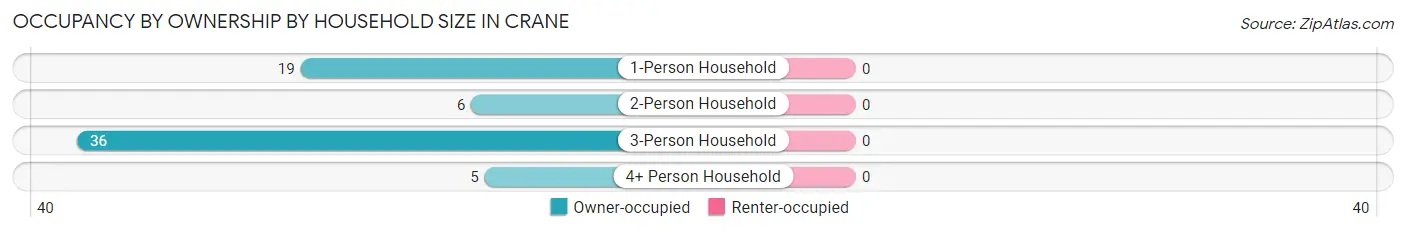
| Household Size | Owner-occupied | Renter-occupied |
| 1-Person Household | 19 (100.0%) | 0 (0.0%) |
| 2-Person Household | 6 (100.0%) | 0 (0.0%) |
| 3-Person Household | 36 (100.0%) | 0 (0.0%) |
| 4+ Person Household | 5 (100.0%) | 0 (0.0%) |
| Total Housing Units | 66 (100.0%) | 0 (0.0%) |
Occupancy by Educational Attainment in Crane
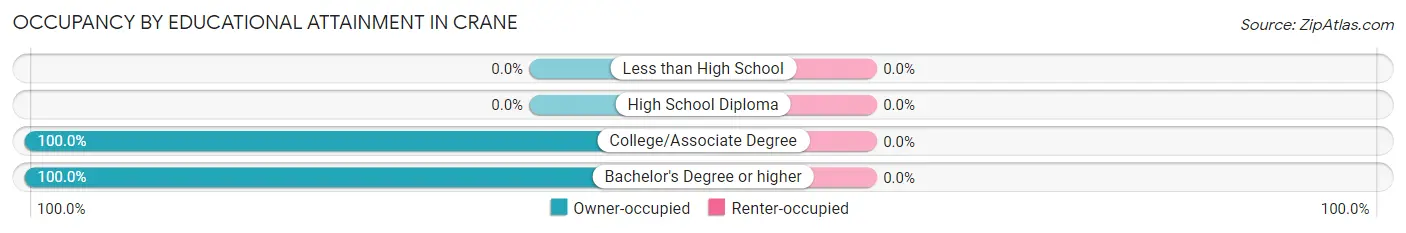
| Household Size | Owner-occupied | Renter-occupied |
| Less than High School | 0 (0.0%) | 0 (0.0%) |
| High School Diploma | 0 (0.0%) | 0 (0.0%) |
| College/Associate Degree | 11 (100.0%) | 0 (0.0%) |
| Bachelor's Degree or higher | 55 (100.0%) | 0 (0.0%) |
Occupancy by Age of Householder in Crane
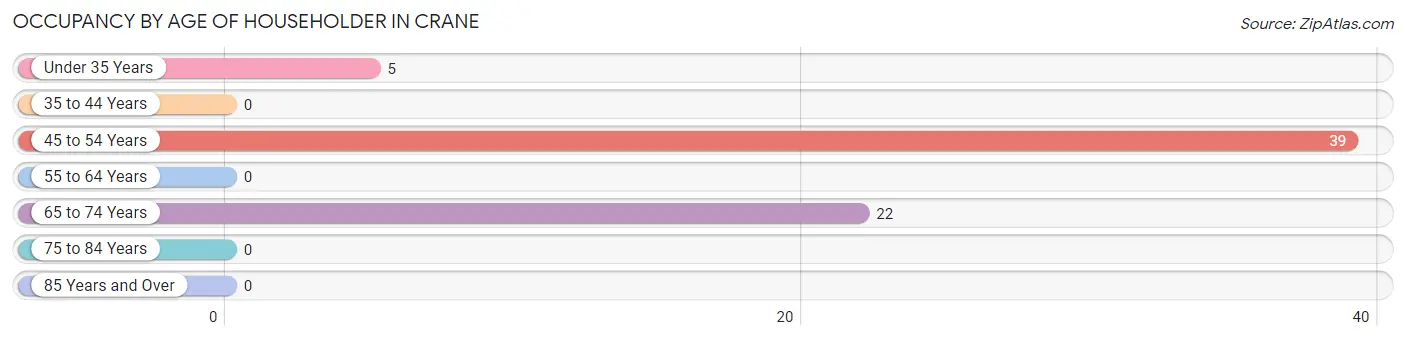
| Age Bracket | # Households | % Households |
| Under 35 Years | 5 | 7.6% |
| 35 to 44 Years | 0 | 0.0% |
| 45 to 54 Years | 39 | 59.1% |
| 55 to 64 Years | 0 | 0.0% |
| 65 to 74 Years | 22 | 33.3% |
| 75 to 84 Years | 0 | 0.0% |
| 85 Years and Over | 0 | 0.0% |
| Total | 66 | 100.0% |
Housing Finances in Crane
Median Income by Occupancy in Crane
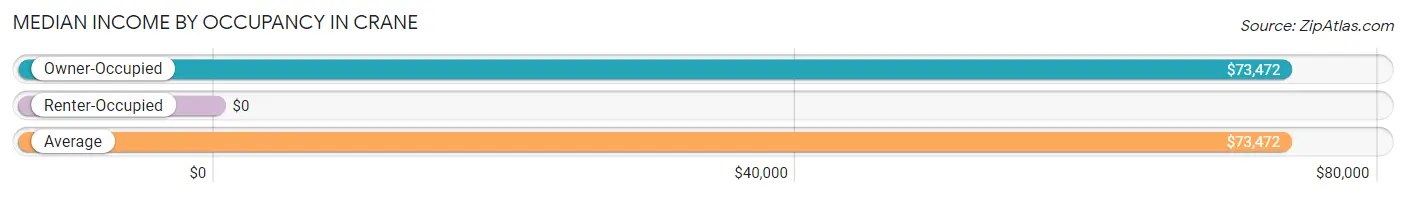
| Occupancy Type | # Households | Median Income |
| Owner-Occupied | 66 (100.0%) | $73,472 |
| Renter-Occupied | 0 (0.0%) | $0 |
| Average | 66 (100.0%) | $73,472 |
Occupancy by Householder Income Bracket in Crane
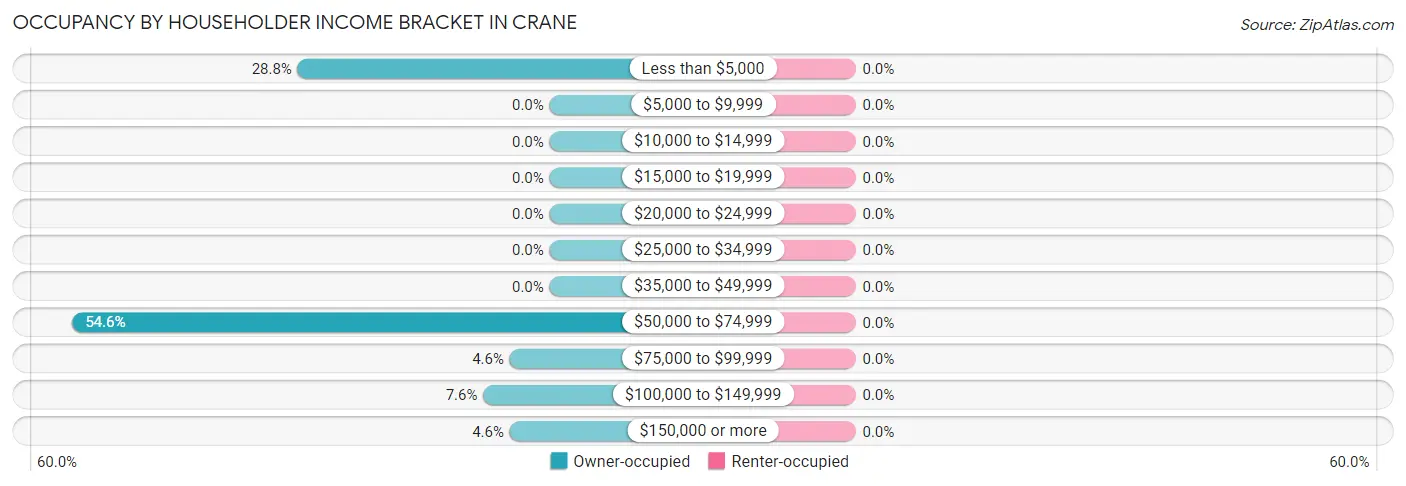
| Income Bracket | Owner-occupied | Renter-occupied |
| Less than $5,000 | 19 (28.8%) | 0 (0.0%) |
| $5,000 to $9,999 | 0 (0.0%) | 0 (0.0%) |
| $10,000 to $14,999 | 0 (0.0%) | 0 (0.0%) |
| $15,000 to $19,999 | 0 (0.0%) | 0 (0.0%) |
| $20,000 to $24,999 | 0 (0.0%) | 0 (0.0%) |
| $25,000 to $34,999 | 0 (0.0%) | 0 (0.0%) |
| $35,000 to $49,999 | 0 (0.0%) | 0 (0.0%) |
| $50,000 to $74,999 | 36 (54.5%) | 0 (0.0%) |
| $75,000 to $99,999 | 3 (4.5%) | 0 (0.0%) |
| $100,000 to $149,999 | 5 (7.6%) | 0 (0.0%) |
| $150,000 or more | 3 (4.5%) | 0 (0.0%) |
| Total | 66 (100.0%) | 0 (0.0%) |
Monthly Housing Cost Tiers in Crane
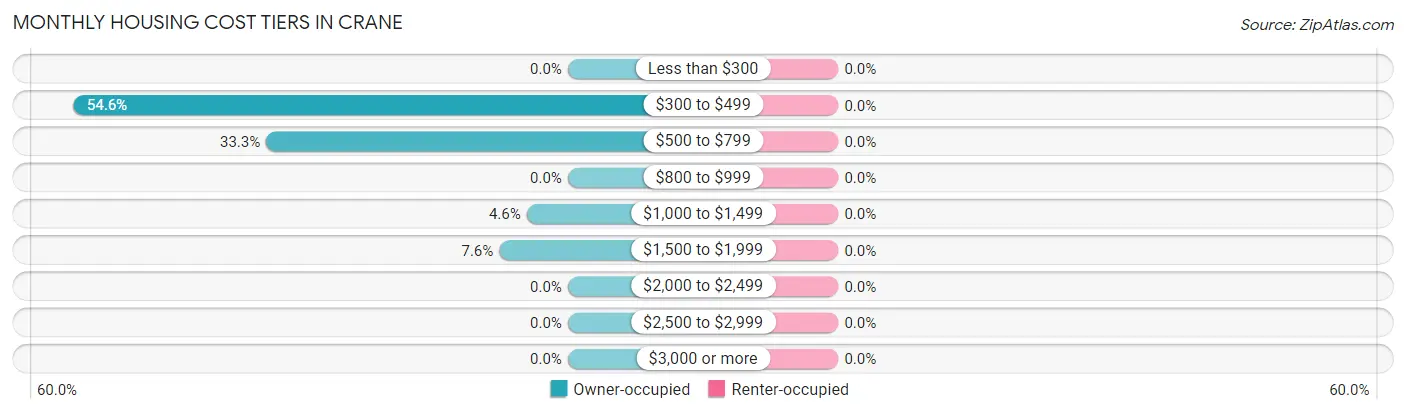
| Monthly Cost | Owner-occupied | Renter-occupied |
| Less than $300 | 0 (0.0%) | 0 (0.0%) |
| $300 to $499 | 36 (54.5%) | 0 (0.0%) |
| $500 to $799 | 22 (33.3%) | 0 (0.0%) |
| $800 to $999 | 0 (0.0%) | 0 (0.0%) |
| $1,000 to $1,499 | 3 (4.5%) | 0 (0.0%) |
| $1,500 to $1,999 | 5 (7.6%) | 0 (0.0%) |
| $2,000 to $2,499 | 0 (0.0%) | 0 (0.0%) |
| $2,500 to $2,999 | 0 (0.0%) | 0 (0.0%) |
| $3,000 or more | 0 (0.0%) | 0 (0.0%) |
| Total | 66 (100.0%) | 0 (0.0%) |
Physical Housing Characteristics in Crane
Housing Structures in Crane
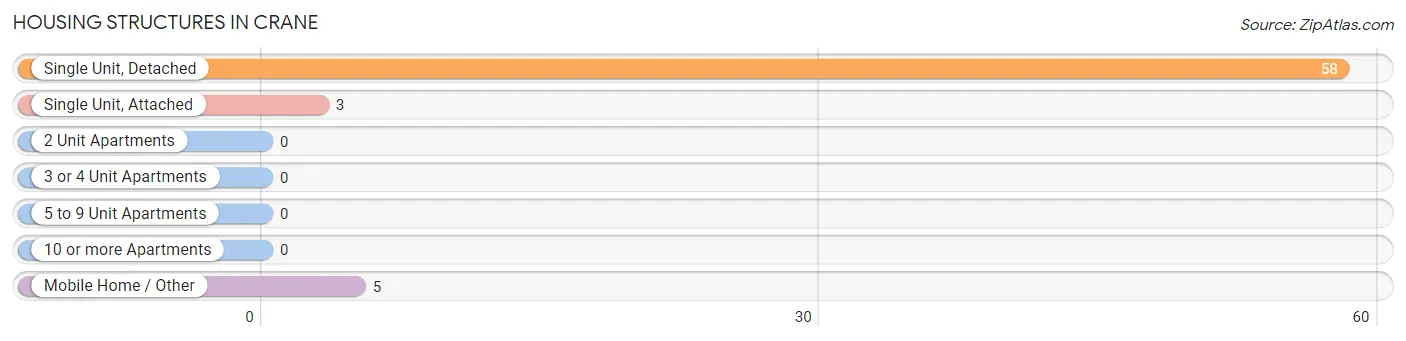
| Structure Type | # Housing Units | % Housing Units |
| Single Unit, Detached | 58 | 87.9% |
| Single Unit, Attached | 3 | 4.5% |
| 2 Unit Apartments | 0 | 0.0% |
| 3 or 4 Unit Apartments | 0 | 0.0% |
| 5 to 9 Unit Apartments | 0 | 0.0% |
| 10 or more Apartments | 0 | 0.0% |
| Mobile Home / Other | 5 | 7.6% |
| Total | 66 | 100.0% |
Housing Structures by Occupancy in Crane
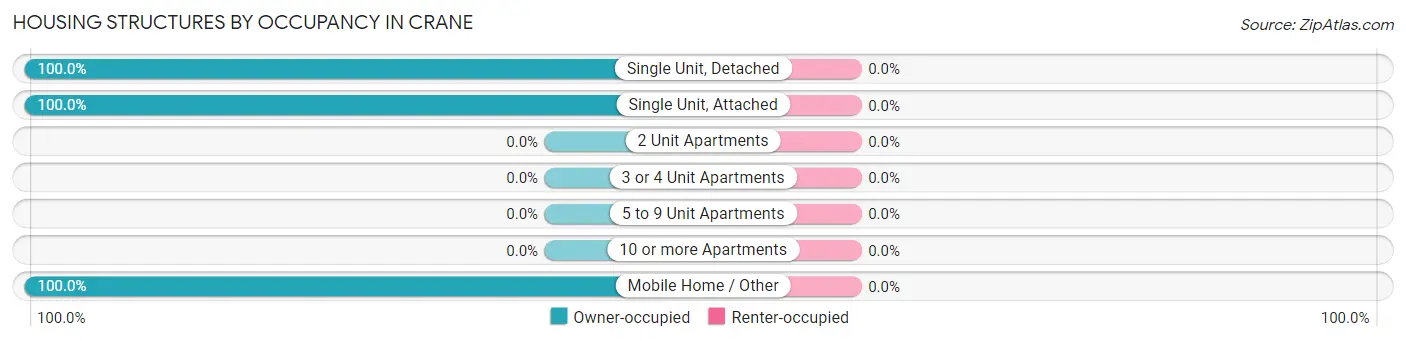
| Structure Type | Owner-occupied | Renter-occupied |
| Single Unit, Detached | 58 (100.0%) | 0 (0.0%) |
| Single Unit, Attached | 3 (100.0%) | 0 (0.0%) |
| 2 Unit Apartments | 0 (0.0%) | 0 (0.0%) |
| 3 or 4 Unit Apartments | 0 (0.0%) | 0 (0.0%) |
| 5 to 9 Unit Apartments | 0 (0.0%) | 0 (0.0%) |
| 10 or more Apartments | 0 (0.0%) | 0 (0.0%) |
| Mobile Home / Other | 5 (100.0%) | 0 (0.0%) |
| Total | 66 (100.0%) | 0 (0.0%) |
Housing Structures by Number of Rooms in Crane
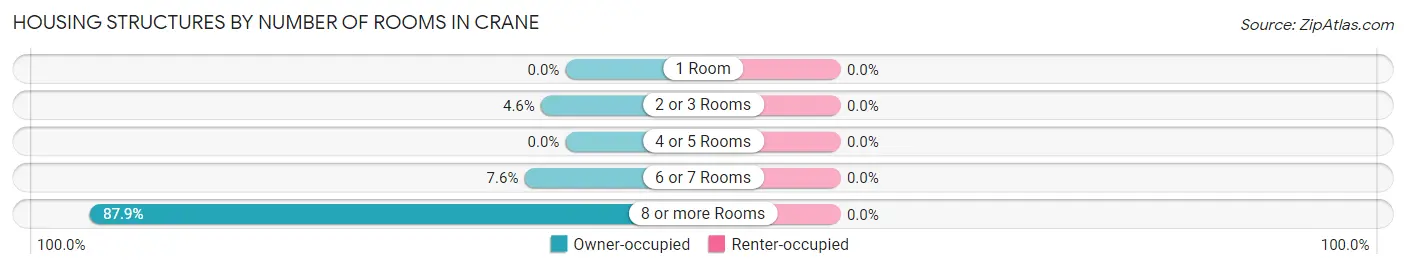
| Number of Rooms | Owner-occupied | Renter-occupied |
| 1 Room | 0 (0.0%) | 0 (0.0%) |
| 2 or 3 Rooms | 3 (4.5%) | 0 (0.0%) |
| 4 or 5 Rooms | 0 (0.0%) | 0 (0.0%) |
| 6 or 7 Rooms | 5 (7.6%) | 0 (0.0%) |
| 8 or more Rooms | 58 (87.9%) | 0 (0.0%) |
| Total | 66 (100.0%) | 0 (0.0%) |
Housing Structure by Heating Type in Crane
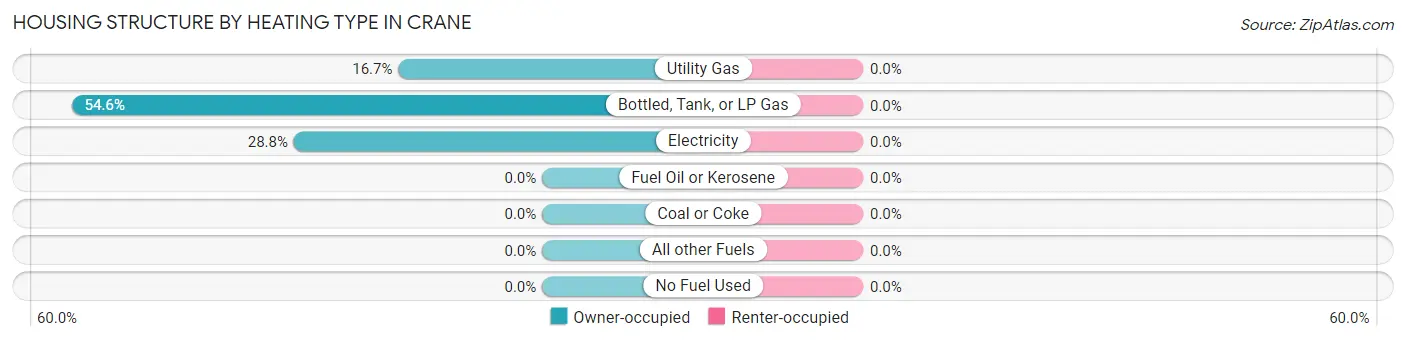
| Heating Type | Owner-occupied | Renter-occupied |
| Utility Gas | 11 (16.7%) | 0 (0.0%) |
| Bottled, Tank, or LP Gas | 36 (54.5%) | 0 (0.0%) |
| Electricity | 19 (28.8%) | 0 (0.0%) |
| Fuel Oil or Kerosene | 0 (0.0%) | 0 (0.0%) |
| Coal or Coke | 0 (0.0%) | 0 (0.0%) |
| All other Fuels | 0 (0.0%) | 0 (0.0%) |
| No Fuel Used | 0 (0.0%) | 0 (0.0%) |
| Total | 66 (100.0%) | 0 (0.0%) |
Household Vehicle Usage in Crane
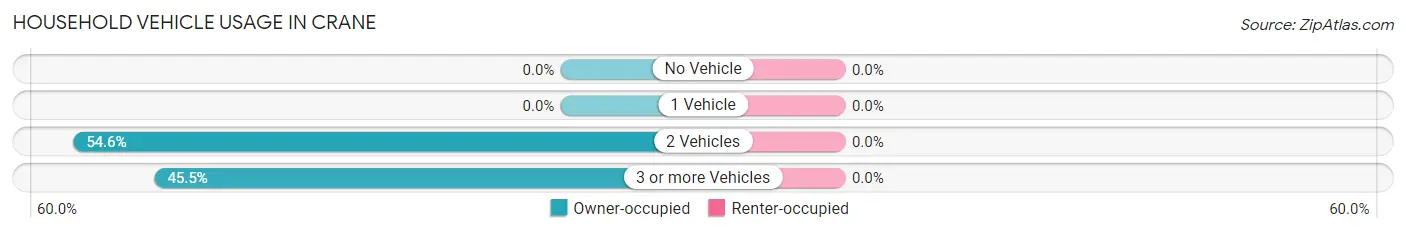
| Vehicles per Household | Owner-occupied | Renter-occupied |
| No Vehicle | 0 (0.0%) | 0 (0.0%) |
| 1 Vehicle | 0 (0.0%) | 0 (0.0%) |
| 2 Vehicles | 36 (54.5%) | 0 (0.0%) |
| 3 or more Vehicles | 30 (45.5%) | 0 (0.0%) |
| Total | 66 (100.0%) | 0 (0.0%) |
Real Estate & Mortgages in Crane
Real Estate and Mortgage Overview in Crane
| Characteristic | Without Mortgage | With Mortgage |
| Housing Units | 58 | 8 |
| Median Property Value | - | - |
| Median Household Income | - | - |
| Monthly Housing Costs | $481 | $0 |
| Real Estate Taxes | - | - |
Property Value by Mortgage Status in Crane
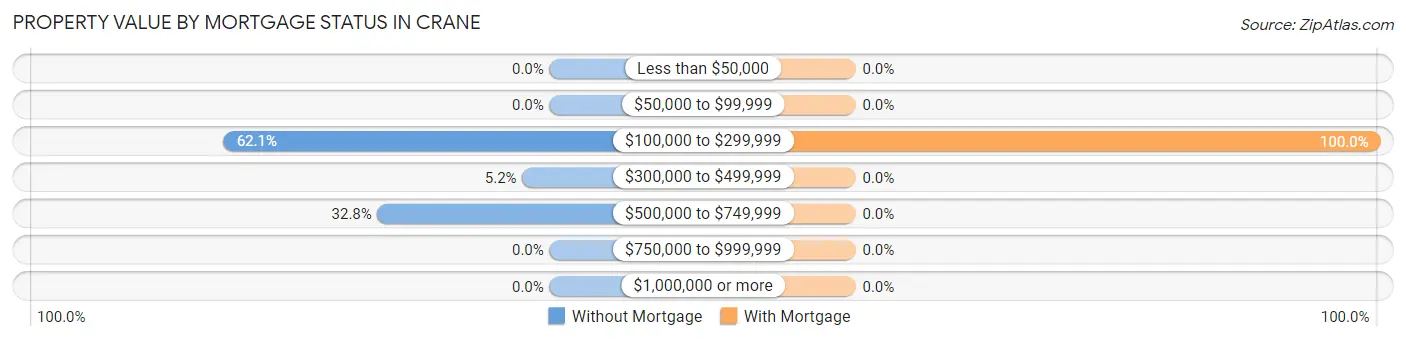
| Property Value | Without Mortgage | With Mortgage |
| Less than $50,000 | 0 (0.0%) | 0 (0.0%) |
| $50,000 to $99,999 | 0 (0.0%) | 0 (0.0%) |
| $100,000 to $299,999 | 36 (62.1%) | 8 (100.0%) |
| $300,000 to $499,999 | 3 (5.2%) | 0 (0.0%) |
| $500,000 to $749,999 | 19 (32.8%) | 0 (0.0%) |
| $750,000 to $999,999 | 0 (0.0%) | 0 (0.0%) |
| $1,000,000 or more | 0 (0.0%) | 0 (0.0%) |
| Total | 58 (100.0%) | 8 (100.0%) |
Household Income by Mortgage Status in Crane
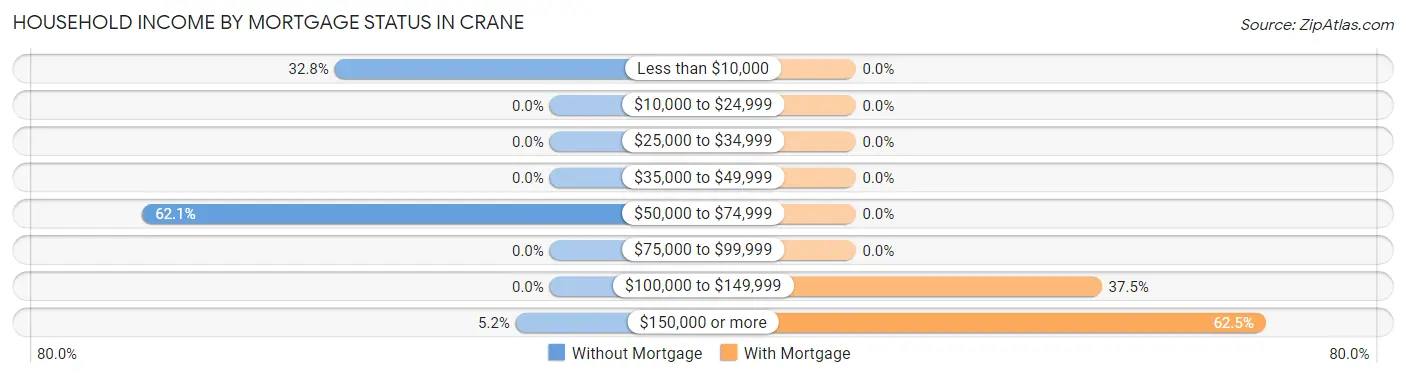
| Household Income | Without Mortgage | With Mortgage |
| Less than $10,000 | 19 (32.8%) | 0 (0.0%) |
| $10,000 to $24,999 | 0 (0.0%) | 0 (0.0%) |
| $25,000 to $34,999 | 0 (0.0%) | 0 (0.0%) |
| $35,000 to $49,999 | 0 (0.0%) | 0 (0.0%) |
| $50,000 to $74,999 | 36 (62.1%) | 0 (0.0%) |
| $75,000 to $99,999 | 0 (0.0%) | 0 (0.0%) |
| $100,000 to $149,999 | 0 (0.0%) | 3 (37.5%) |
| $150,000 or more | 3 (5.2%) | 5 (62.5%) |
| Total | 58 (100.0%) | 8 (100.0%) |
Property Value to Household Income Ratio in Crane
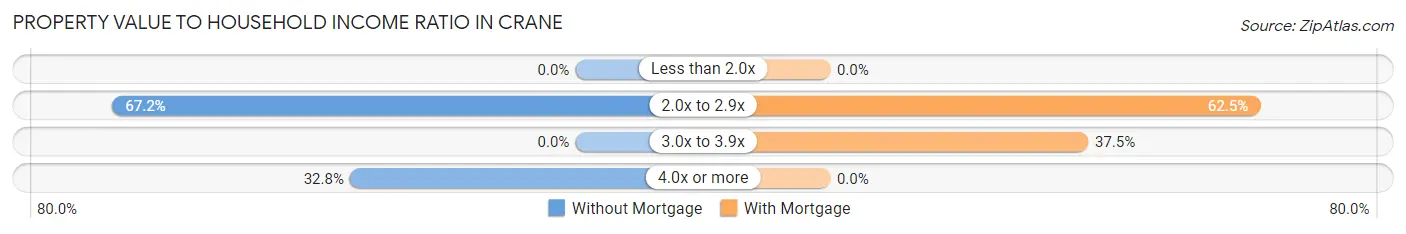
| Value-to-Income Ratio | Without Mortgage | With Mortgage |
| Less than 2.0x | 0 (0.0%) | 0 (0.0%) |
| 2.0x to 2.9x | 39 (67.2%) | 5 (62.5%) |
| 3.0x to 3.9x | 0 (0.0%) | 3 (37.5%) |
| 4.0x or more | 19 (32.8%) | 0 (0.0%) |
| Total | 58 (100.0%) | 8 (100.0%) |
Real Estate Taxes by Mortgage Status in Crane
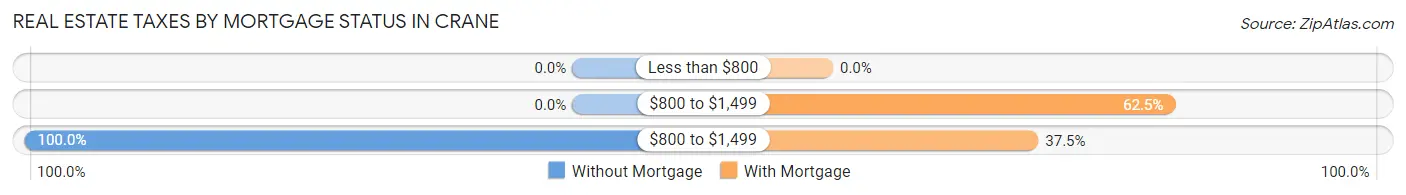
| Property Taxes | Without Mortgage | With Mortgage |
| Less than $800 | 0 (0.0%) | 0 (0.0%) |
| $800 to $1,499 | 0 (0.0%) | 5 (62.5%) |
| $800 to $1,499 | 58 (100.0%) | 3 (37.5%) |
| Total | 58 (100.0%) | 8 (100.0%) |
Health & Disability in Crane
Health Insurance Coverage by Age in Crane
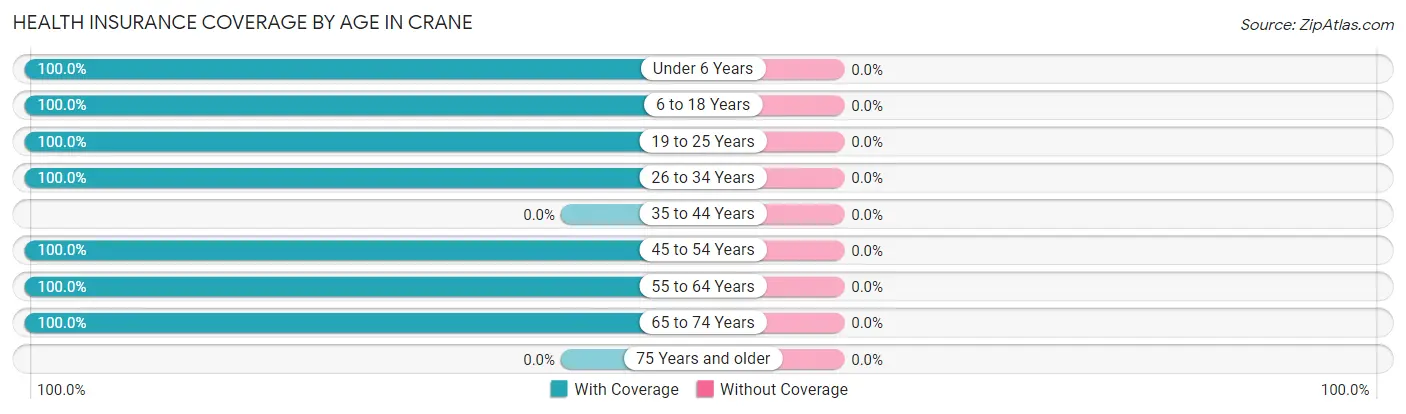
| Age Bracket | With Coverage | Without Coverage |
| Under 6 Years | 21 (100.0%) | 0 (0.0%) |
| 6 to 18 Years | 85 (100.0%) | 0 (0.0%) |
| 19 to 25 Years | 8 (100.0%) | 0 (0.0%) |
| 26 to 34 Years | 14 (100.0%) | 0 (0.0%) |
| 35 to 44 Years | 0 (0.0%) | 0 (0.0%) |
| 45 to 54 Years | 39 (100.0%) | 0 (0.0%) |
| 55 to 64 Years | 2 (100.0%) | 0 (0.0%) |
| 65 to 74 Years | 22 (100.0%) | 0 (0.0%) |
| 75 Years and older | 0 (0.0%) | 0 (0.0%) |
| Total | 191 (100.0%) | 0 (0.0%) |
Health Insurance Coverage by Citizenship Status in Crane
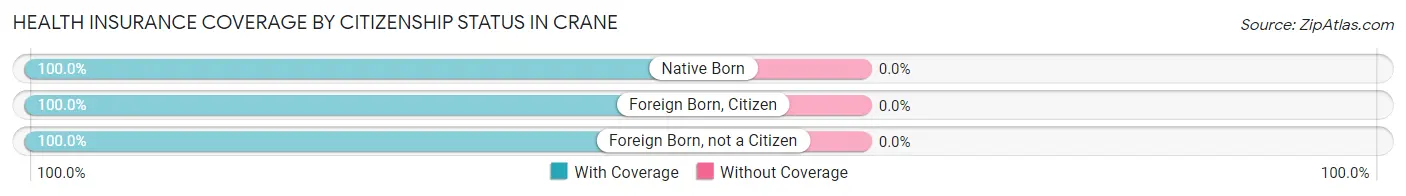
| Citizenship Status | With Coverage | Without Coverage |
| Native Born | 21 (100.0%) | 0 (0.0%) |
| Foreign Born, Citizen | 85 (100.0%) | 0 (0.0%) |
| Foreign Born, not a Citizen | 8 (100.0%) | 0 (0.0%) |
Health Insurance Coverage by Household Income in Crane
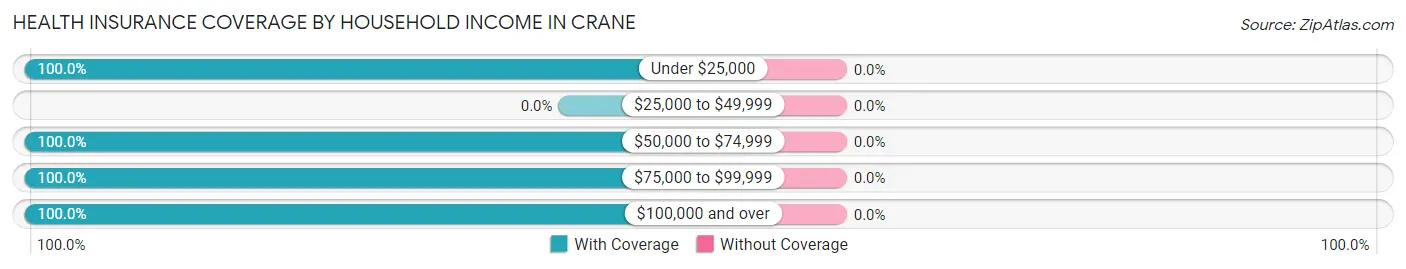
| Household Income | With Coverage | Without Coverage |
| Under $25,000 | 19 (100.0%) | 0 (0.0%) |
| $25,000 to $49,999 | 0 (0.0%) | 0 (0.0%) |
| $50,000 to $74,999 | 121 (100.0%) | 0 (0.0%) |
| $75,000 to $99,999 | 11 (100.0%) | 0 (0.0%) |
| $100,000 and over | 40 (100.0%) | 0 (0.0%) |
Public vs Private Health Insurance Coverage by Age in Crane
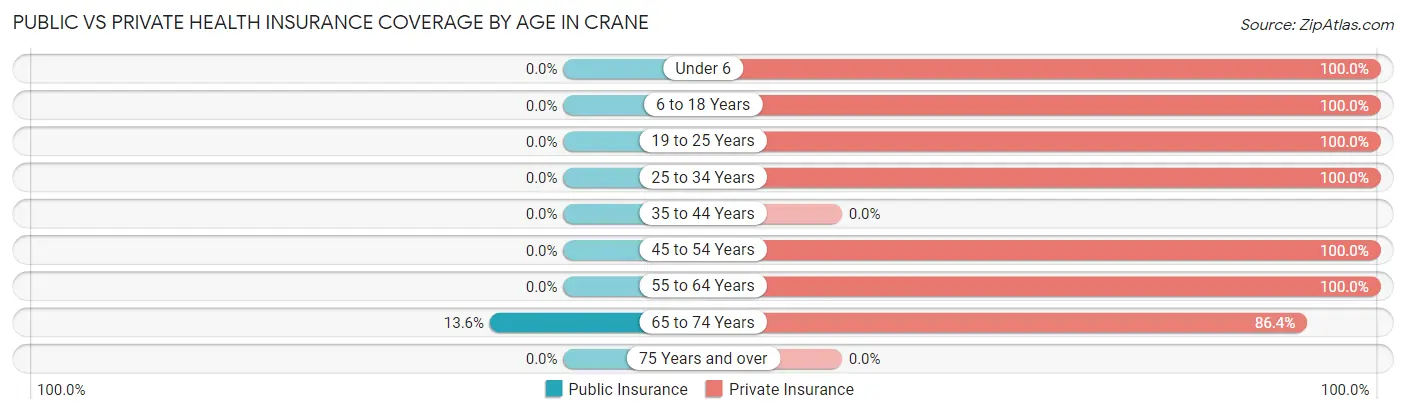
| Age Bracket | Public Insurance | Private Insurance |
| Under 6 | 0 (0.0%) | 21 (100.0%) |
| 6 to 18 Years | 0 (0.0%) | 85 (100.0%) |
| 19 to 25 Years | 0 (0.0%) | 8 (100.0%) |
| 25 to 34 Years | 0 (0.0%) | 14 (100.0%) |
| 35 to 44 Years | 0 (0.0%) | 0 (0.0%) |
| 45 to 54 Years | 0 (0.0%) | 39 (100.0%) |
| 55 to 64 Years | 0 (0.0%) | 2 (100.0%) |
| 65 to 74 Years | 3 (13.6%) | 19 (86.4%) |
| 75 Years and over | 0 (0.0%) | 0 (0.0%) |
| Total | 3 (1.6%) | 188 (98.4%) |
Disability Status by Sex by Age in Crane
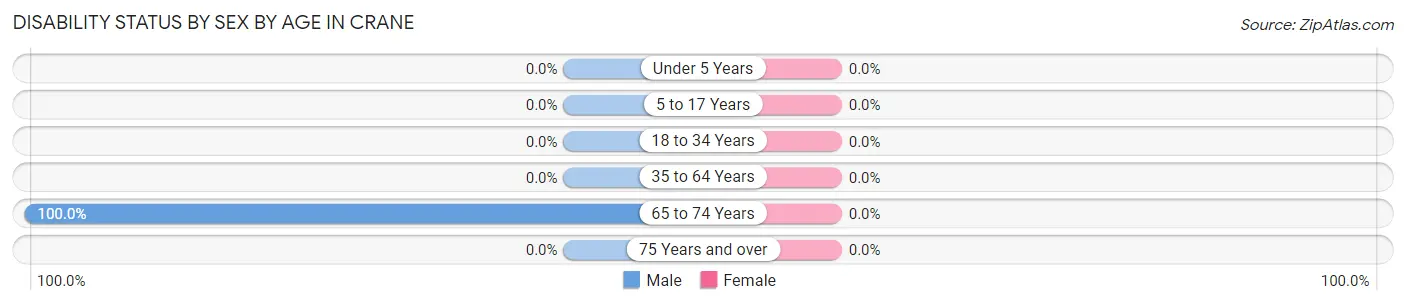
| Age Bracket | Male | Female |
| Under 5 Years | 0 (0.0%) | 0 (0.0%) |
| 5 to 17 Years | 0 (0.0%) | 0 (0.0%) |
| 18 to 34 Years | 0 (0.0%) | 0 (0.0%) |
| 35 to 64 Years | 0 (0.0%) | 0 (0.0%) |
| 65 to 74 Years | 3 (100.0%) | 0 (0.0%) |
| 75 Years and over | 0 (0.0%) | 0 (0.0%) |
Disability Class by Sex by Age in Crane
Disability Class: Hearing Difficulty
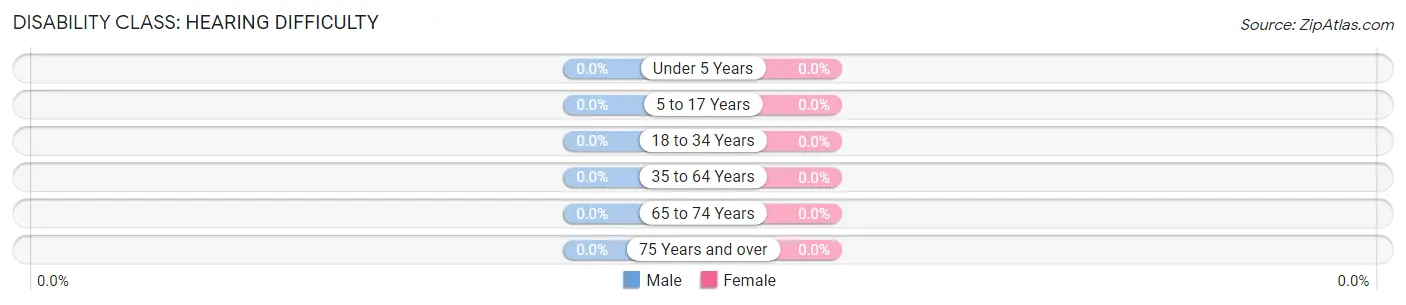
| Age Bracket | Male | Female |
| Under 5 Years | 0 (0.0%) | 0 (0.0%) |
| 5 to 17 Years | 0 (0.0%) | 0 (0.0%) |
| 18 to 34 Years | 0 (0.0%) | 0 (0.0%) |
| 35 to 64 Years | 0 (0.0%) | 0 (0.0%) |
| 65 to 74 Years | 0 (0.0%) | 0 (0.0%) |
| 75 Years and over | 0 (0.0%) | 0 (0.0%) |
Disability Class: Vision Difficulty
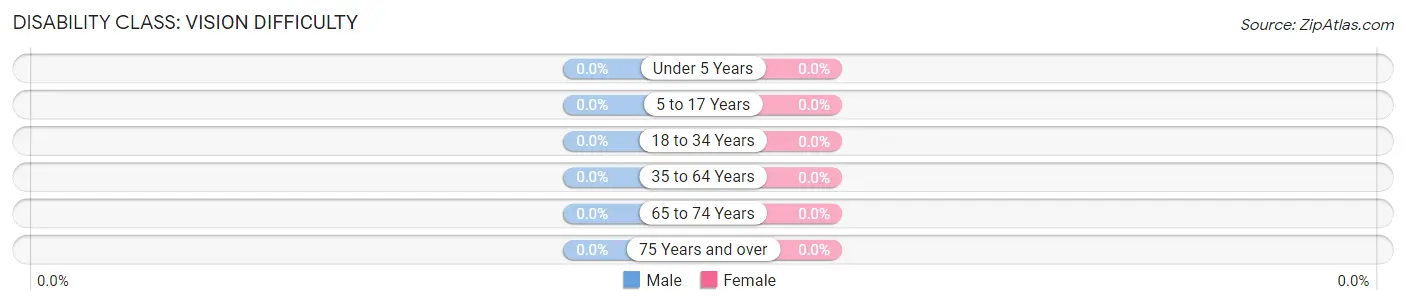
| Age Bracket | Male | Female |
| Under 5 Years | 0 (0.0%) | 0 (0.0%) |
| 5 to 17 Years | 0 (0.0%) | 0 (0.0%) |
| 18 to 34 Years | 0 (0.0%) | 0 (0.0%) |
| 35 to 64 Years | 0 (0.0%) | 0 (0.0%) |
| 65 to 74 Years | 0 (0.0%) | 0 (0.0%) |
| 75 Years and over | 0 (0.0%) | 0 (0.0%) |
Disability Class: Cognitive Difficulty
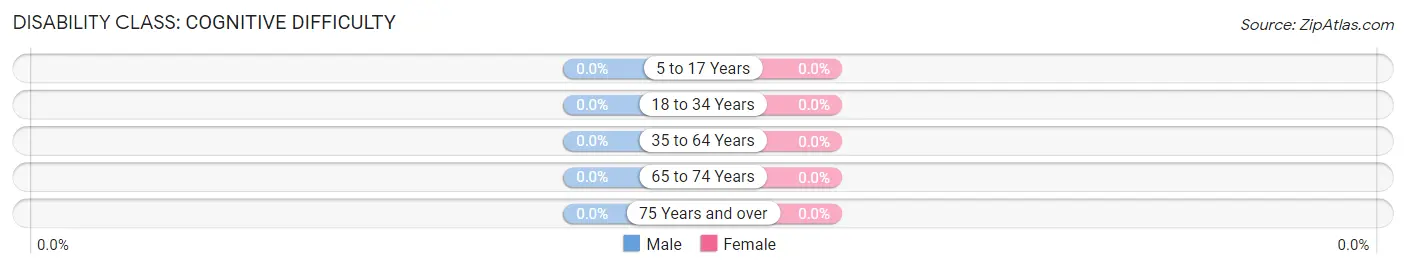
| Age Bracket | Male | Female |
| 5 to 17 Years | 0 (0.0%) | 0 (0.0%) |
| 18 to 34 Years | 0 (0.0%) | 0 (0.0%) |
| 35 to 64 Years | 0 (0.0%) | 0 (0.0%) |
| 65 to 74 Years | 0 (0.0%) | 0 (0.0%) |
| 75 Years and over | 0 (0.0%) | 0 (0.0%) |
Disability Class: Ambulatory Difficulty
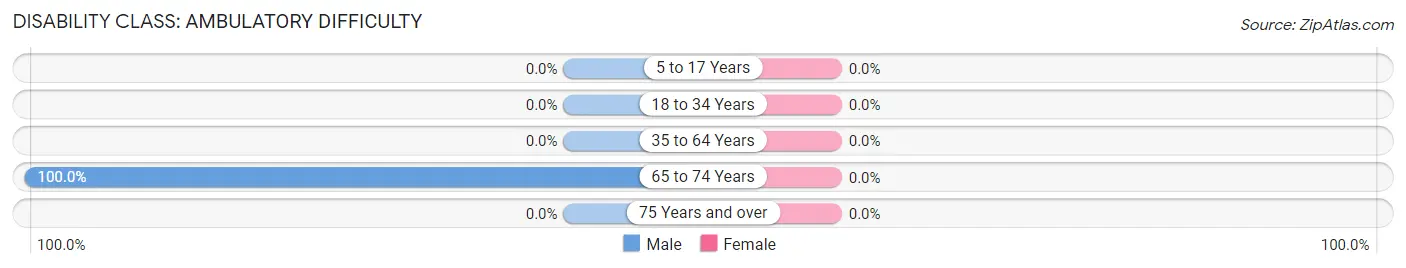
| Age Bracket | Male | Female |
| 5 to 17 Years | 0 (0.0%) | 0 (0.0%) |
| 18 to 34 Years | 0 (0.0%) | 0 (0.0%) |
| 35 to 64 Years | 0 (0.0%) | 0 (0.0%) |
| 65 to 74 Years | 3 (100.0%) | 0 (0.0%) |
| 75 Years and over | 0 (0.0%) | 0 (0.0%) |
Disability Class: Self-Care Difficulty

| Age Bracket | Male | Female |
| 5 to 17 Years | 0 (0.0%) | 0 (0.0%) |
| 18 to 34 Years | 0 (0.0%) | 0 (0.0%) |
| 35 to 64 Years | 0 (0.0%) | 0 (0.0%) |
| 65 to 74 Years | 0 (0.0%) | 0 (0.0%) |
| 75 Years and over | 0 (0.0%) | 0 (0.0%) |
Technology Access in Crane
Computing Device Access in Crane
| Device Type | # Households | % Households |
| Desktop or Laptop | 61 | 92.4% |
| Smartphone | 66 | 100.0% |
| Tablet | 22 | 33.3% |
| No Computing Device | 0 | 0.0% |
| Total | 66 | 100.0% |
Internet Access in Crane
| Internet Type | # Households | % Households |
| Dial-Up Internet | 0 | 0.0% |
| Broadband Home | 66 | 100.0% |
| Cellular Data Only | 0 | 0.0% |
| Satellite Internet | 0 | 0.0% |
| No Internet | 0 | 0.0% |
| Total | 66 | 100.0% |
Crane Summary
Crane, Montana is a small town located in the eastern part of the state, near the border with North Dakota. It is situated in the Powder River Basin, an area of rolling hills and grasslands. The town is home to a population of just over 500 people, and is the county seat of Sheridan County.
History
Crane was founded in 1882, when the Northern Pacific Railroad was built through the area. The town was named after a local rancher, William Crane, who had a large ranch in the area. The town quickly grew, and by the early 1900s, it had become a bustling center of commerce and industry. The town was home to several businesses, including a bank, a hotel, a general store, and a post office.
In the early 1900s, the town was also home to a large number of immigrants, mostly from Germany and Scandinavia. These immigrants brought with them their own culture and traditions, which still influence the town today.
Geography
Crane is located in the eastern part of Montana, near the border with North Dakota. It is situated in the Powder River Basin, an area of rolling hills and grasslands. The town is located at an elevation of 3,400 feet, and is surrounded by the Little Missouri National Grassland.
The climate in Crane is semi-arid, with hot summers and cold winters. The average annual temperature is around 50 degrees Fahrenheit, and the average annual precipitation is around 12 inches.
Economy
The economy of Crane is largely based on agriculture and ranching. The town is home to several large ranches, and the surrounding area is used for cattle and sheep grazing. The town is also home to several small businesses, including a grocery store, a hardware store, and a restaurant.
The town is also home to a small airport, which serves as a hub for air travel in the region. The airport is used by both commercial and private aircraft.
Demographics
As of the 2010 census, the population of Crane was 514. The racial makeup of the town was 97.3% White, 0.2% African American, 0.4% Native American, 0.4% Asian, 0.2% from other races, and 1.5% from two or more races. Hispanic or Latino of any race were 1.2% of the population.
The median income for a household in Crane was $37,500, and the median income for a family was $41,250. The per capita income for the town was $17,845. About 11.2% of families and 13.2% of the population were below the poverty line, including 16.7% of those under age 18 and 8.3% of those age 65 or over.
Conclusion
Crane, Montana is a small town located in the eastern part of the state, near the border with North Dakota. It is situated in the Powder River Basin, an area of rolling hills and grasslands. The town is home to a population of just over 500 people, and is the county seat of Sheridan County. The economy of Crane is largely based on agriculture and ranching, and the town is home to several small businesses. The population of Crane is predominantly white, with a small percentage of other races. The median income for a household in Crane is $37,500, and the median income for a family is $41,250.
Common Questions
What is Per Capita Income in Crane?
Per Capita income in Crane is $21,508.
What is the Median Family Income in Crane?
Median Family Income in Crane is $74,132.
What is the Median Household income in Crane?
Median Household Income in Crane is $73,472.
What is Inequality or Gini Index in Crane?
Inequality or Gini Index in Crane is 0.35.
What is the Total Population of Crane?
Total Population of Crane is 191.
What is the Total Male Population of Crane?
Total Male Population of Crane is 92.
What is the Total Female Population of Crane?
Total Female Population of Crane is 99.
What is the Ratio of Males per 100 Females in Crane?
There are 92.93 Males per 100 Females in Crane.
What is the Ratio of Females per 100 Males in Crane?
There are 107.61 Females per 100 Males in Crane.
What is the Median Population Age in Crane?
Median Population Age in Crane is 16.6 Years.
What is the Average Family Size in Crane
Average Family Size in Crane is 3.7 People.
What is the Average Household Size in Crane
Average Household Size in Crane is 2.9 People.
How Large is the Labor Force in Crane?
There are 18 People in the Labor Forcein in Crane.
What is the Percentage of People in the Labor Force in Crane?
16.4% of People are in the Labor Force in Crane.