Beaver Creek, MT Map & Demographics
Beaver Creek Map
Beaver Creek Overview
$42,751
PER CAPITA INCOME
$135,161
AVG FAMILY INCOME
$91,688
AVG HOUSEHOLD INCOME
0.32
INEQUALITY / GINI INDEX
382
TOTAL POPULATION
206
MALE POPULATION
176
FEMALE POPULATION
117.05
MALES / 100 FEMALES
85.44
FEMALES / 100 MALES
50.0
MEDIAN AGE
2.6
AVG FAMILY SIZE
2.2
AVG HOUSEHOLD SIZE
264
LABOR FORCE [ PEOPLE ]
82.8%
PERCENT IN LABOR FORCE
0.8%
UNEMPLOYMENT RATE
Income in Beaver Creek
Income Overview in Beaver Creek
Per Capita Income in Beaver Creek is $42,751, while median incomes of families and households are $135,161 and $91,688 respectively.
| Characteristic | Number | Measure |
| Per Capita Income | 382 | $42,751 |
| Median Family Income | 108 | $135,161 |
| Mean Family Income | 108 | $128,779 |
| Median Household Income | 171 | $91,688 |
| Mean Household Income | 171 | $99,239 |
| Income Deficit | 108 | $0 |
| Wage / Income Gap (%) | 382 | 0.00% |
| Wage / Income Gap ($) | 382 | 100.00¢ per $1 |
| Gini / Inequality Index | 382 | 0.32 |
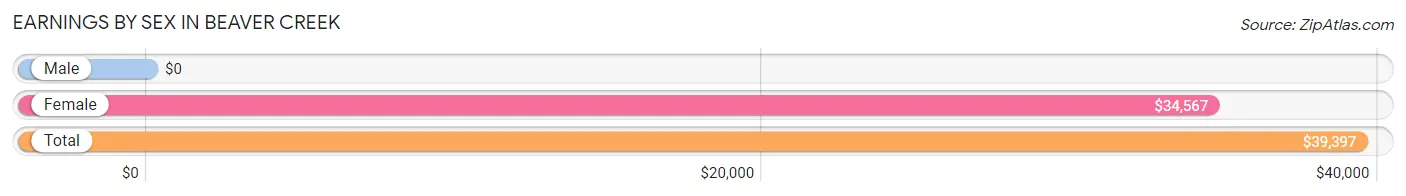
Earnings by Sex in Beaver Creek
| Sex | Number | Average Earnings |
| Male | 155 (55.0%) | $0 |
| Female | 127 (45.0%) | $34,567 |
| Total | 282 (100.0%) | $39,397 |
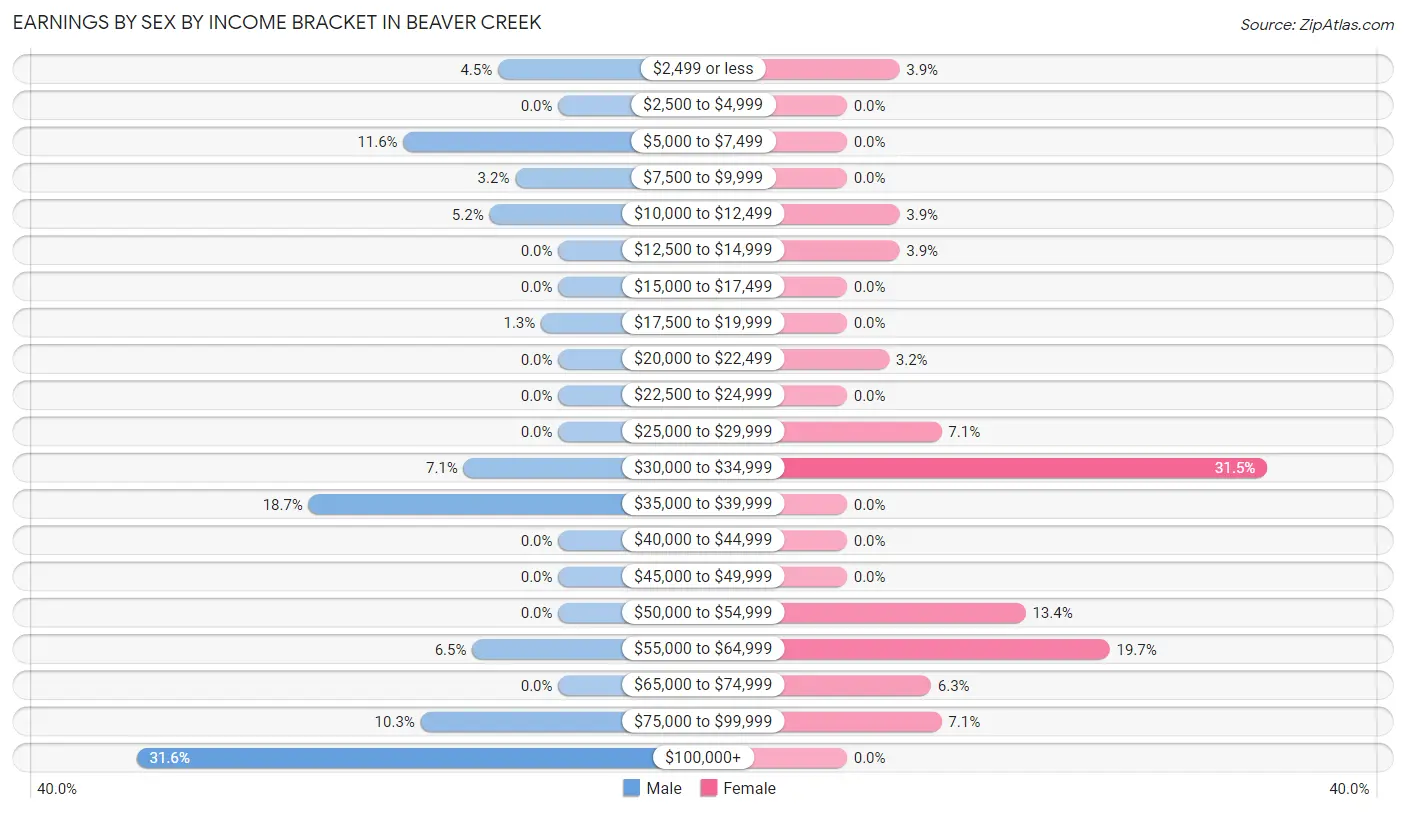
Earnings by Sex by Income Bracket in Beaver Creek
The most common earnings brackets in Beaver Creek are $100,000+ for men (49 | 31.6%) and $30,000 to $34,999 for women (40 | 31.5%).
| Income | Male | Female |
| $2,499 or less | 7 (4.5%) | 5 (3.9%) |
| $2,500 to $4,999 | 0 (0.0%) | 0 (0.0%) |
| $5,000 to $7,499 | 18 (11.6%) | 0 (0.0%) |
| $7,500 to $9,999 | 5 (3.2%) | 0 (0.0%) |
| $10,000 to $12,499 | 8 (5.2%) | 5 (3.9%) |
| $12,500 to $14,999 | 0 (0.0%) | 5 (3.9%) |
| $15,000 to $17,499 | 0 (0.0%) | 0 (0.0%) |
| $17,500 to $19,999 | 2 (1.3%) | 0 (0.0%) |
| $20,000 to $22,499 | 0 (0.0%) | 4 (3.2%) |
| $22,500 to $24,999 | 0 (0.0%) | 0 (0.0%) |
| $25,000 to $29,999 | 0 (0.0%) | 9 (7.1%) |
| $30,000 to $34,999 | 11 (7.1%) | 40 (31.5%) |
| $35,000 to $39,999 | 29 (18.7%) | 0 (0.0%) |
| $40,000 to $44,999 | 0 (0.0%) | 0 (0.0%) |
| $45,000 to $49,999 | 0 (0.0%) | 0 (0.0%) |
| $50,000 to $54,999 | 0 (0.0%) | 17 (13.4%) |
| $55,000 to $64,999 | 10 (6.5%) | 25 (19.7%) |
| $65,000 to $74,999 | 0 (0.0%) | 8 (6.3%) |
| $75,000 to $99,999 | 16 (10.3%) | 9 (7.1%) |
| $100,000+ | 49 (31.6%) | 0 (0.0%) |
| Total | 155 (100.0%) | 127 (100.0%) |
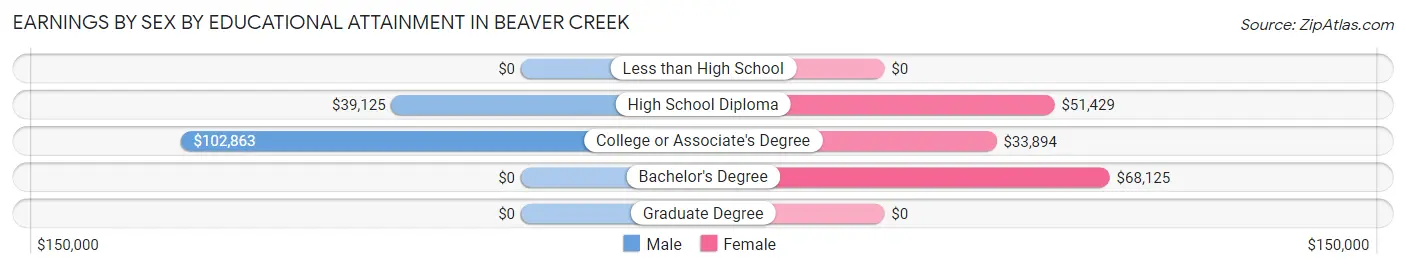
Earnings by Sex by Educational Attainment in Beaver Creek
Average earnings in Beaver Creek are $92,500 for men and $50,294 for women, a difference of 45.6%. Men with an educational attainment of college or associate's degree enjoy the highest average annual earnings of $102,863, while those with high school diploma education earn the least with $39,125. Women with an educational attainment of bachelor's degree earn the most with the average annual earnings of $68,125, while those with college or associate's degree education have the smallest earnings of $33,894.
| Educational Attainment | Male Income | Female Income |
| Less than High School | - | - |
| High School Diploma | $39,125 | $51,429 |
| College or Associate's Degree | $102,863 | $33,894 |
| Bachelor's Degree | - | - |
| Graduate Degree | - | - |
| Total | $92,500 | $50,294 |
Family Income in Beaver Creek
Family Income Brackets in Beaver Creek
According to the Beaver Creek family income data, there are 49 families falling into the $100,000 to $149,999 income range, which is the most common income bracket and makes up 45.4% of all families.
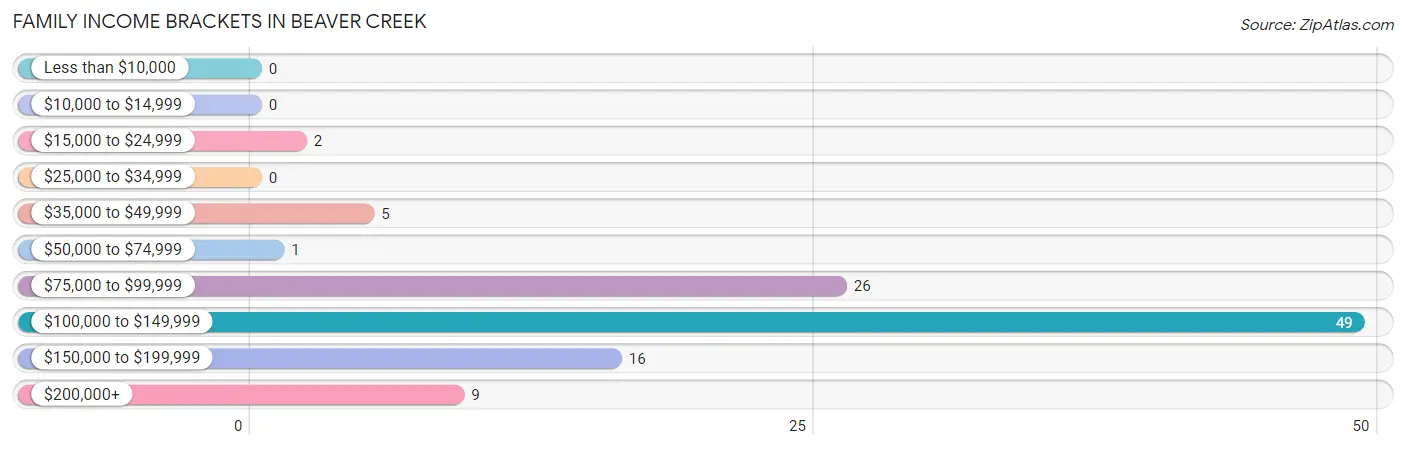
| Income Bracket | # Families | % Families |
| Less than $10,000 | 0 | 0.0% |
| $10,000 to $14,999 | 0 | 0.0% |
| $15,000 to $24,999 | 2 | 1.9% |
| $25,000 to $34,999 | 0 | 0.0% |
| $35,000 to $49,999 | 5 | 4.6% |
| $50,000 to $74,999 | 1 | 0.9% |
| $75,000 to $99,999 | 26 | 24.1% |
| $100,000 to $149,999 | 49 | 45.4% |
| $150,000 to $199,999 | 16 | 14.8% |
| $200,000+ | 9 | 8.3% |
Family Income by Famaliy Size in Beaver Creek
2-person families (67 | 62.0%) account for the highest median family income in Beaver Creek with $135,282 per family, while 2-person families (67 | 62.0%) have the highest median income of $67,641 per family member.
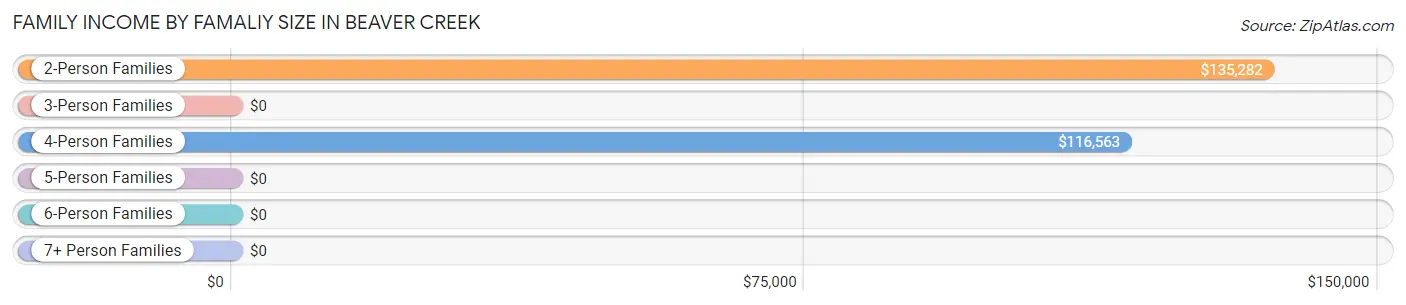
| Income Bracket | # Families | Median Income |
| 2-Person Families | 67 (62.0%) | $135,282 |
| 3-Person Families | 16 (14.8%) | $0 |
| 4-Person Families | 20 (18.5%) | $116,563 |
| 5-Person Families | 1 (0.9%) | $0 |
| 6-Person Families | 0 (0.0%) | $0 |
| 7+ Person Families | 4 (3.7%) | $0 |
| Total | 108 (100.0%) | $135,161 |
Family Income by Number of Earners in Beaver Creek
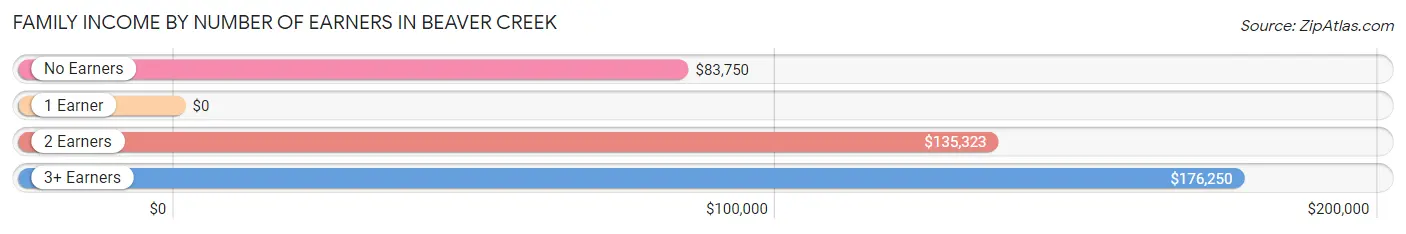
| Number of Earners | # Families | Median Income |
| No Earners | 6 (5.6%) | $83,750 |
| 1 Earner | 4 (3.7%) | $0 |
| 2 Earners | 78 (72.2%) | $135,323 |
| 3+ Earners | 20 (18.5%) | $176,250 |
| Total | 108 (100.0%) | $135,161 |
Household Income in Beaver Creek
Household Income Brackets in Beaver Creek
With 54 households falling in the category, the $100,000 to $149,999 income range is the most frequent in Beaver Creek, accounting for 31.6% of all households. In contrast, only 5 households (2.9%) fall into the less than $10,000 income bracket, making it the least populous group.
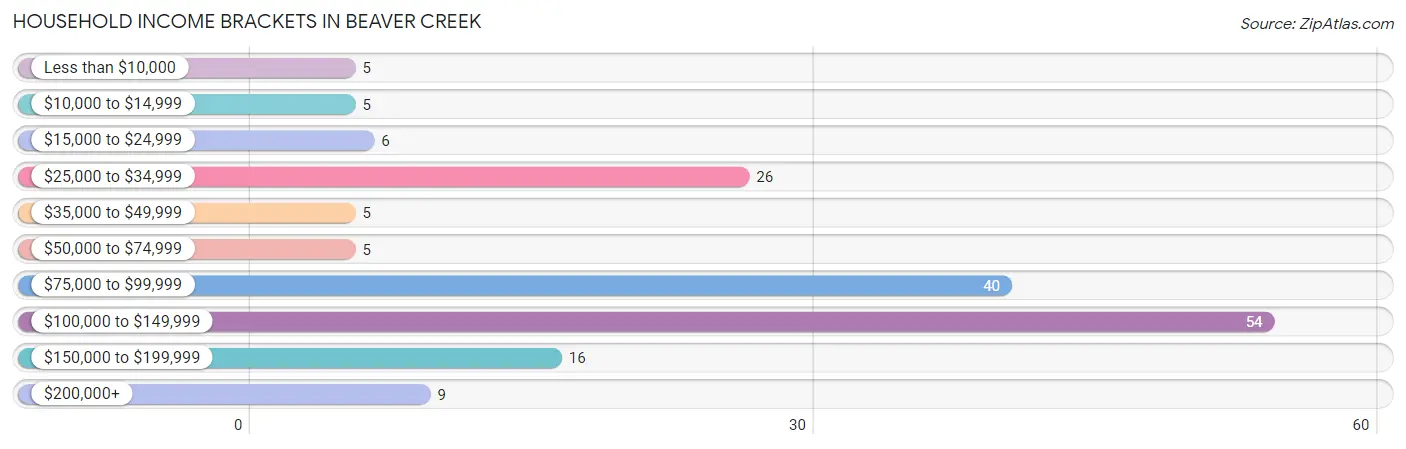
| Income Bracket | # Households | % Households |
| Less than $10,000 | 5 | 2.9% |
| $10,000 to $14,999 | 5 | 2.9% |
| $15,000 to $24,999 | 6 | 3.5% |
| $25,000 to $34,999 | 26 | 15.2% |
| $35,000 to $49,999 | 5 | 2.9% |
| $50,000 to $74,999 | 5 | 2.9% |
| $75,000 to $99,999 | 40 | 23.4% |
| $100,000 to $149,999 | 54 | 31.6% |
| $150,000 to $199,999 | 16 | 9.4% |
| $200,000+ | 9 | 5.3% |
Household Income by Householder Age in Beaver Creek
The median household income in Beaver Creek is $91,688, with the highest median household income of $116,250 found in the 45 to 64 years age bracket for the primary householder. A total of 126 households (73.7%) fall into this category.
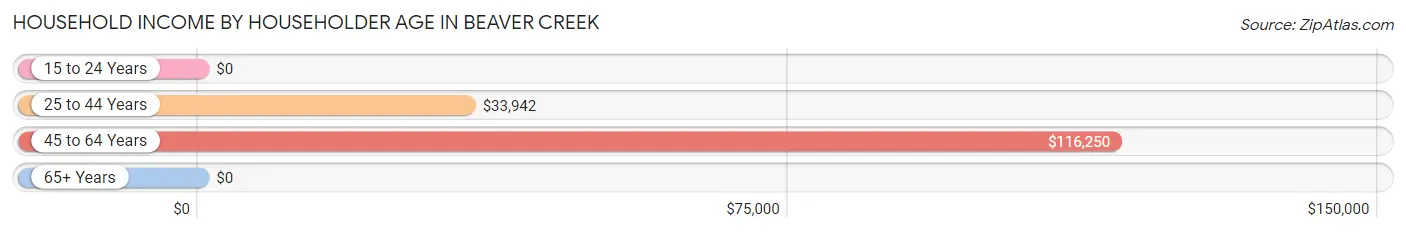
| Income Bracket | # Households | Median Income |
| 15 to 24 Years | 0 (0.0%) | $0 |
| 25 to 44 Years | 34 (19.9%) | $33,942 |
| 45 to 64 Years | 126 (73.7%) | $116,250 |
| 65+ Years | 11 (6.4%) | $0 |
| Total | 171 (100.0%) | $91,688 |
Poverty in Beaver Creek
Income Below Poverty by Sex and Age in Beaver Creek
With 2.6% poverty level for males and 3.0% for females among the residents of Beaver Creek, 55 to 64 year old males and 55 to 64 year old females are the most vulnerable to poverty, with 5 males (8.6%) and 5 females (20.8%) in their respective age groups living below the poverty level.
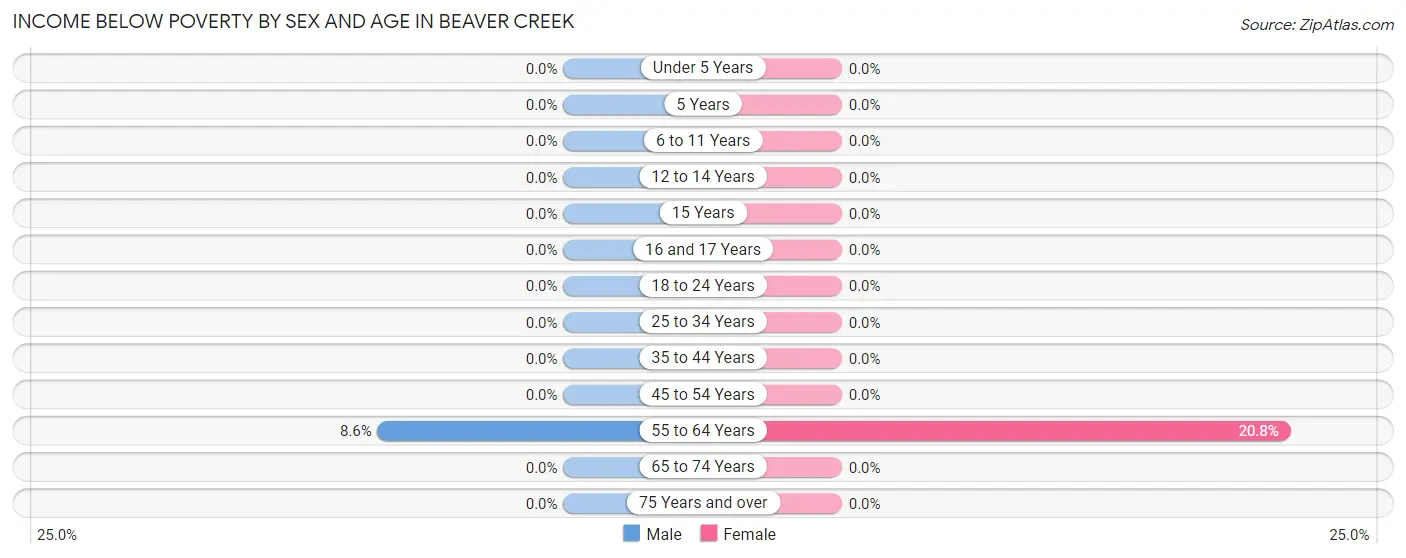
| Age Bracket | Male | Female |
| Under 5 Years | 0 (0.0%) | 0 (0.0%) |
| 5 Years | 0 (0.0%) | 0 (0.0%) |
| 6 to 11 Years | 0 (0.0%) | 0 (0.0%) |
| 12 to 14 Years | 0 (0.0%) | 0 (0.0%) |
| 15 Years | 0 (0.0%) | 0 (0.0%) |
| 16 and 17 Years | 0 (0.0%) | 0 (0.0%) |
| 18 to 24 Years | 0 (0.0%) | 0 (0.0%) |
| 25 to 34 Years | 0 (0.0%) | 0 (0.0%) |
| 35 to 44 Years | 0 (0.0%) | 0 (0.0%) |
| 45 to 54 Years | 0 (0.0%) | 0 (0.0%) |
| 55 to 64 Years | 5 (8.6%) | 5 (20.8%) |
| 65 to 74 Years | 0 (0.0%) | 0 (0.0%) |
| 75 Years and over | 0 (0.0%) | 0 (0.0%) |
| Total | 5 (2.6%) | 5 (3.0%) |
Income Above Poverty by Sex and Age in Beaver Creek
According to the poverty statistics in Beaver Creek, males aged under 5 years and females aged under 5 years are the age groups that are most secure financially, with 100.0% of males and 100.0% of females in these age groups living above the poverty line.
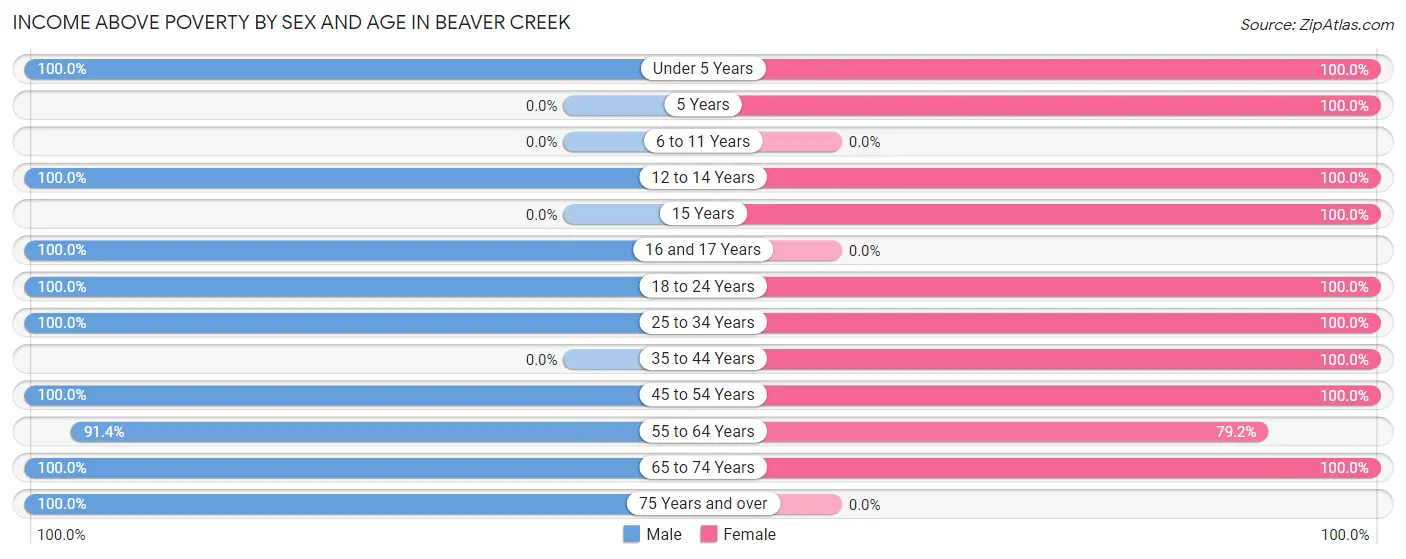
| Age Bracket | Male | Female |
| Under 5 Years | 11 (100.0%) | 7 (100.0%) |
| 5 Years | 0 (0.0%) | 9 (100.0%) |
| 6 to 11 Years | 0 (0.0%) | 0 (0.0%) |
| 12 to 14 Years | 2 (100.0%) | 1 (100.0%) |
| 15 Years | 0 (0.0%) | 5 (100.0%) |
| 16 and 17 Years | 25 (100.0%) | 0 (0.0%) |
| 18 to 24 Years | 8 (100.0%) | 13 (100.0%) |
| 25 to 34 Years | 11 (100.0%) | 30 (100.0%) |
| 35 to 44 Years | 0 (0.0%) | 6 (100.0%) |
| 45 to 54 Years | 64 (100.0%) | 64 (100.0%) |
| 55 to 64 Years | 53 (91.4%) | 19 (79.2%) |
| 65 to 74 Years | 5 (100.0%) | 5 (100.0%) |
| 75 Years and over | 6 (100.0%) | 0 (0.0%) |
| Total | 185 (97.4%) | 159 (97.0%) |
Income Below Poverty Among Married-Couple Families in Beaver Creek
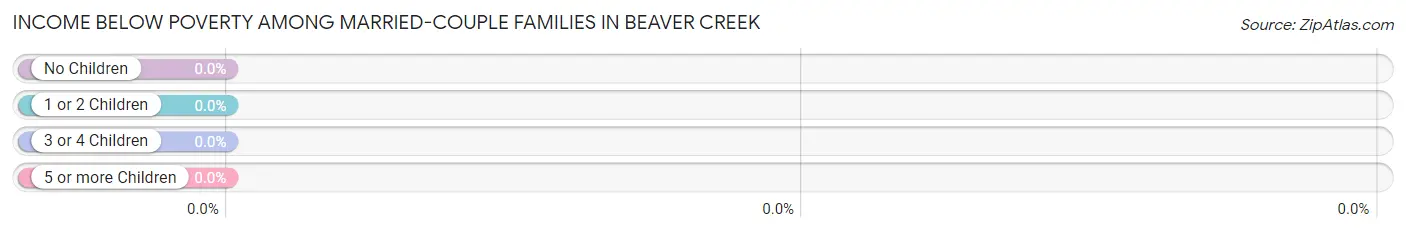
| Children | Above Poverty | Below Poverty |
| No Children | 75 (100.0%) | 0 (0.0%) |
| 1 or 2 Children | 32 (100.0%) | 0 (0.0%) |
| 3 or 4 Children | 1 (100.0%) | 0 (0.0%) |
| 5 or more Children | 0 (0.0%) | 0 (0.0%) |
| Total | 108 (100.0%) | 0 (0.0%) |
Income Below Poverty Among Single-Parent Households in Beaver Creek
| Children | Single Father | Single Mother |
| No Children | 0 (0.0%) | 0 (0.0%) |
| 1 or 2 Children | 0 (0.0%) | 0 (0.0%) |
| 3 or 4 Children | 0 (0.0%) | 0 (0.0%) |
| 5 or more Children | 0 (0.0%) | 0 (0.0%) |
| Total | 0 (0.0%) | 0 (0.0%) |
Income Below Poverty Among Married-Couple vs Single-Parent Households in Beaver Creek
| Children | Married-Couple Families | Single-Parent Households |
| No Children | 0 (0.0%) | 0 (0.0%) |
| 1 or 2 Children | 0 (0.0%) | 0 (0.0%) |
| 3 or 4 Children | 0 (0.0%) | 0 (0.0%) |
| 5 or more Children | 0 (0.0%) | 0 (0.0%) |
| Total | 0 (0.0%) | 0 (0.0%) |
Race in Beaver Creek
The most populous races in Beaver Creek are White / Caucasian (347 | 90.8%), Native / Alaskan (34 | 8.9%), and Two or more Races (1 | 0.3%).
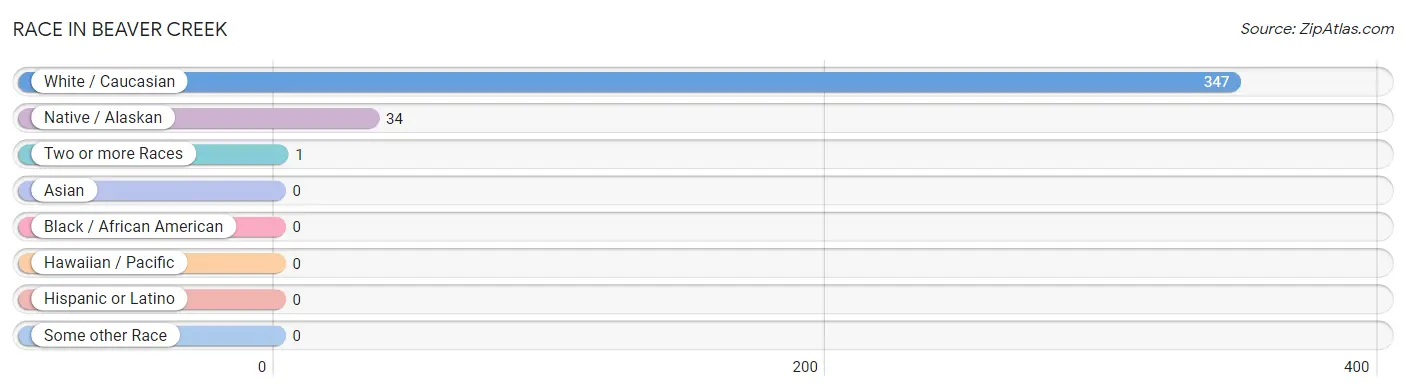
| Race | # Population | % Population |
| Asian | 0 | 0.0% |
| Black / African American | 0 | 0.0% |
| Hawaiian / Pacific | 0 | 0.0% |
| Hispanic or Latino | 0 | 0.0% |
| Native / Alaskan | 34 | 8.9% |
| White / Caucasian | 347 | 90.8% |
| Two or more Races | 1 | 0.3% |
| Some other Race | 0 | 0.0% |
| Total | 382 | 100.0% |
Ancestry in Beaver Creek
The most populous ancestries reported in Beaver Creek are German (117 | 30.6%), Norwegian (112 | 29.3%), French Canadian (29 | 7.6%), Irish (25 | 6.5%), and English (19 | 5.0%), together accounting for 79.0% of all Beaver Creek residents.
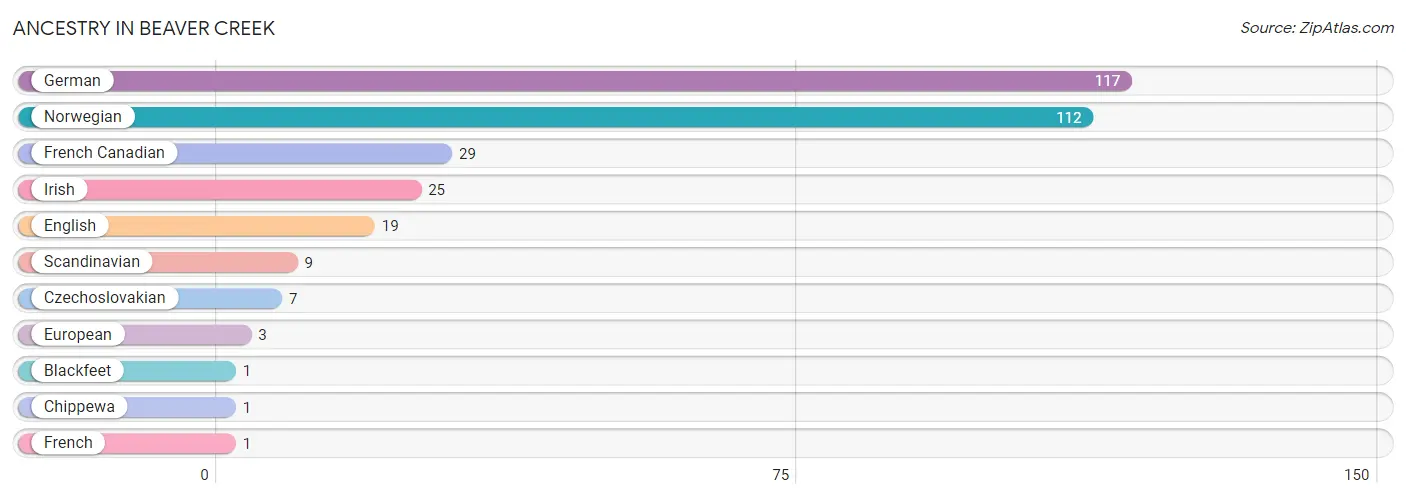
| Ancestry | # Population | % Population |
| Blackfeet | 1 | 0.3% |
| Chippewa | 1 | 0.3% |
| Czechoslovakian | 7 | 1.8% |
| English | 19 | 5.0% |
| European | 3 | 0.8% |
| French | 1 | 0.3% |
| French Canadian | 29 | 7.6% |
| German | 117 | 30.6% |
| Irish | 25 | 6.5% |
| Norwegian | 112 | 29.3% |
| Scandinavian | 9 | 2.4% | View All 11 Rows |
Immigrants in Beaver Creek

| Immigration Origin | # Population | % Population | View All 0 Rows |
Sex and Age in Beaver Creek
Sex and Age in Beaver Creek
The most populous age groups in Beaver Creek are 50 to 54 Years (57 | 27.7%) for men and 50 to 54 Years (35 | 19.9%) for women.
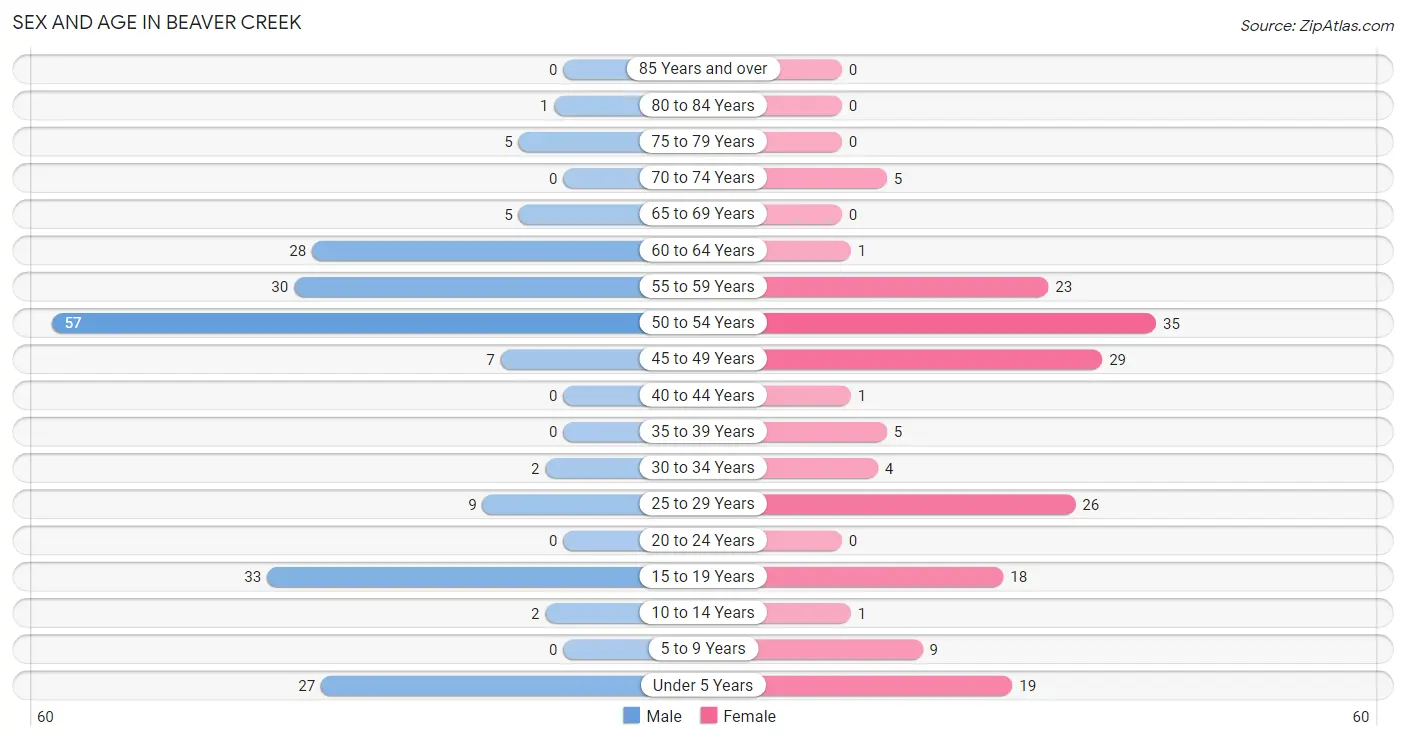
| Age Bracket | Male | Female |
| Under 5 Years | 27 (13.1%) | 19 (10.8%) |
| 5 to 9 Years | 0 (0.0%) | 9 (5.1%) |
| 10 to 14 Years | 2 (1.0%) | 1 (0.6%) |
| 15 to 19 Years | 33 (16.0%) | 18 (10.2%) |
| 20 to 24 Years | 0 (0.0%) | 0 (0.0%) |
| 25 to 29 Years | 9 (4.4%) | 26 (14.8%) |
| 30 to 34 Years | 2 (1.0%) | 4 (2.3%) |
| 35 to 39 Years | 0 (0.0%) | 5 (2.8%) |
| 40 to 44 Years | 0 (0.0%) | 1 (0.6%) |
| 45 to 49 Years | 7 (3.4%) | 29 (16.5%) |
| 50 to 54 Years | 57 (27.7%) | 35 (19.9%) |
| 55 to 59 Years | 30 (14.6%) | 23 (13.1%) |
| 60 to 64 Years | 28 (13.6%) | 1 (0.6%) |
| 65 to 69 Years | 5 (2.4%) | 0 (0.0%) |
| 70 to 74 Years | 0 (0.0%) | 5 (2.8%) |
| 75 to 79 Years | 5 (2.4%) | 0 (0.0%) |
| 80 to 84 Years | 1 (0.5%) | 0 (0.0%) |
| 85 Years and over | 0 (0.0%) | 0 (0.0%) |
| Total | 206 (100.0%) | 176 (100.0%) |
Families and Households in Beaver Creek
Median Family Size in Beaver Creek
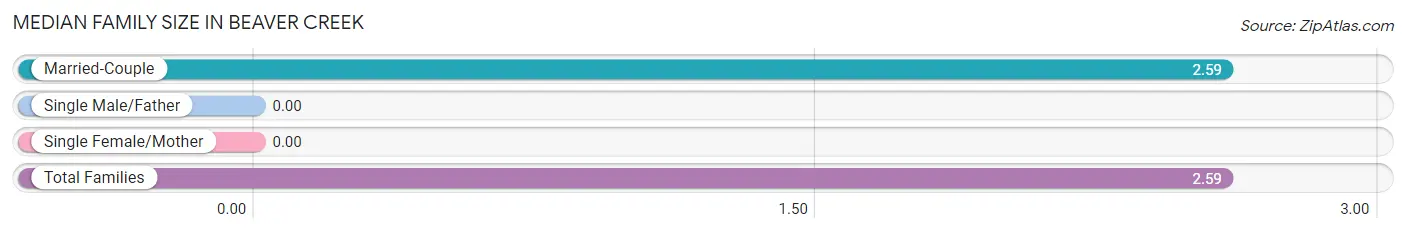
| Family Type | # Families | Family Size |
| Married-Couple | 108 (100.0%) | 2.59 |
| Single Male/Father | 0 (0.0%) | - |
| Single Female/Mother | 0 (0.0%) | - |
| Total Families | 108 (100.0%) | 2.59 |
Median Household Size in Beaver Creek
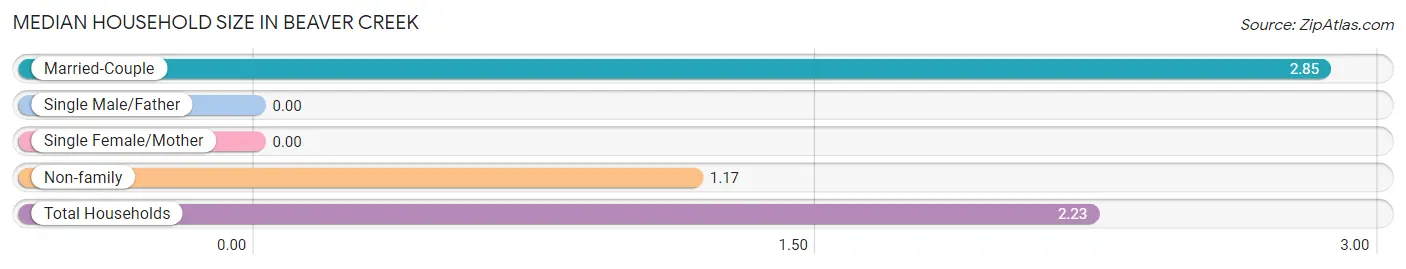
| Household Type | # Households | Household Size |
| Married-Couple | 108 (63.2%) | 2.85 |
| Single Male/Father | 0 (0.0%) | - |
| Single Female/Mother | 0 (0.0%) | - |
| Non-family | 63 (36.8%) | 1.17 |
| Total Households | 171 (100.0%) | 2.23 |
Household Size by Marriage Status in Beaver Creek
Out of a total of 171 households in Beaver Creek, 108 (63.2%) are family households, while 63 (36.8%) are nonfamily households. The most numerous type of family households are 2-person households, comprising 67, and the most common type of nonfamily households are 1-person households, comprising 49.
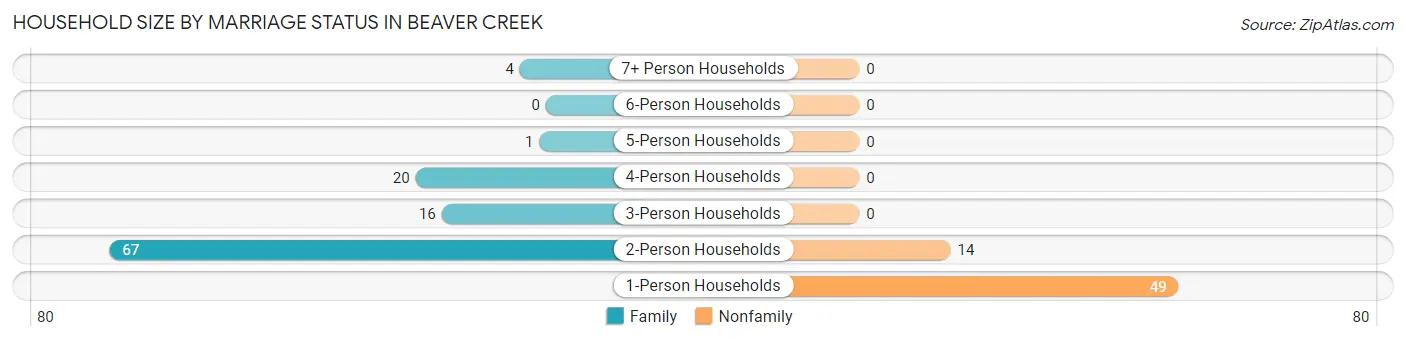
| Household Size | Family Households | Nonfamily Households |
| 1-Person Households | - | 49 (28.6%) |
| 2-Person Households | 67 (39.2%) | 14 (8.2%) |
| 3-Person Households | 16 (9.4%) | 0 (0.0%) |
| 4-Person Households | 20 (11.7%) | 0 (0.0%) |
| 5-Person Households | 1 (0.6%) | 0 (0.0%) |
| 6-Person Households | 0 (0.0%) | 0 (0.0%) |
| 7+ Person Households | 4 (2.3%) | 0 (0.0%) |
| Total | 108 (63.2%) | 63 (36.8%) |
Female Fertility in Beaver Creek
Fertility by Age in Beaver Creek
| Age Bracket | Women with Births | Births / 1,000 Women |
| 15 to 19 years | 0 (0.0%) | 0.0 |
| 20 to 34 years | 0 (0.0%) | 0.0 |
| 35 to 50 years | 0 (0.0%) | 0.0 |
| Total | 0 (0.0%) | 0.0 |
Fertility by Age by Marriage Status in Beaver Creek
| Age Bracket | Married | Unmarried |
| 15 to 19 years | 0 (0.0%) | 0 (0.0%) |
| 20 to 34 years | 0 (0.0%) | 0 (0.0%) |
| 35 to 50 years | 0 (0.0%) | 0 (0.0%) |
| Total | 0 (0.0%) | 0 (0.0%) |
Fertility by Education in Beaver Creek
| Educational Attainment | Women with Births | Births / 1,000 Women |
| Less than High School | 0 (0.0%) | 0.0 |
| High School Diploma | 0 (0.0%) | 0.0 |
| College or Associate's Degree | 0 (0.0%) | 0.0 |
| Bachelor's Degree | 0 (0.0%) | 0.0 |
| Graduate Degree | 0 (0.0%) | 0.0 |
| Total | 0 (0.0%) | 0.0 |
Fertility by Education by Marriage Status in Beaver Creek
| Educational Attainment | Married | Unmarried |
| Less than High School | 0 (0.0%) | 0 (0.0%) |
| High School Diploma | 0 (0.0%) | 0 (0.0%) |
| College or Associate's Degree | 0 (0.0%) | 0 (0.0%) |
| Bachelor's Degree | 0 (0.0%) | 0 (0.0%) |
| Graduate Degree | 0 (0.0%) | 0 (0.0%) |
| Total | 0 (0.0%) | 0 (0.0%) |
Employment Characteristics in Beaver Creek
Employment by Class of Employer in Beaver Creek
Among the 260 employed individuals in Beaver Creek, private company employees (195 | 75.0%), local government employees (24 | 9.2%), and state government employees (20 | 7.7%) make up the most common classes of employment.
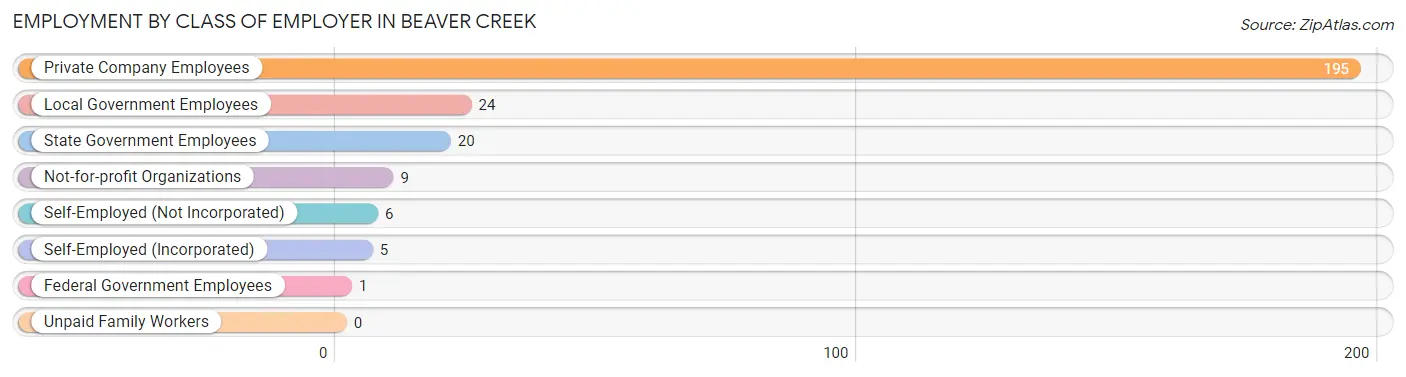
| Employer Class | # Employees | % Employees |
| Private Company Employees | 195 | 75.0% |
| Self-Employed (Incorporated) | 5 | 1.9% |
| Self-Employed (Not Incorporated) | 6 | 2.3% |
| Not-for-profit Organizations | 9 | 3.5% |
| Local Government Employees | 24 | 9.2% |
| State Government Employees | 20 | 7.7% |
| Federal Government Employees | 1 | 0.4% |
| Unpaid Family Workers | 0 | 0.0% |
| Total | 260 | 100.0% |
Employment Status by Age in Beaver Creek
According to the labor force statistics for Beaver Creek, out of the total population over 16 years of age (319), 82.8% or 264 individuals are in the labor force, with 0.8% or 2 of them unemployed. The age group with the highest labor force participation rate is 25 to 29 years, with 100.0% or 35 individuals in the labor force. Within the labor force, the 30 to 34 years age range has the highest percentage of unemployed individuals, with 100.0% or 2 of them being unemployed.
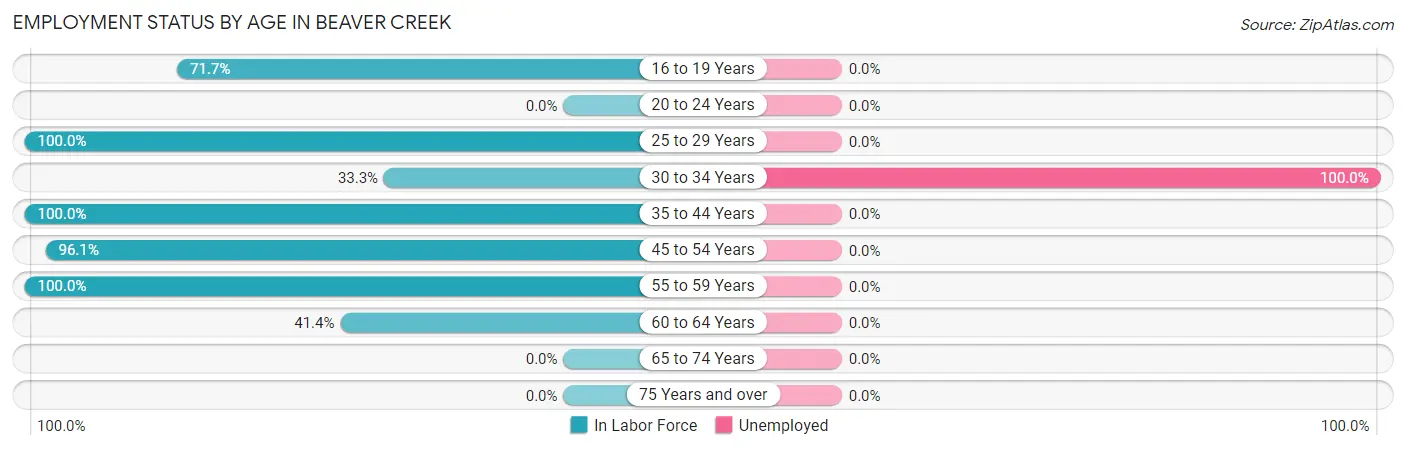
| Age Bracket | In Labor Force | Unemployed |
| 16 to 19 Years | 33 (71.7%) | 0 (0.0%) |
| 20 to 24 Years | 0 (0.0%) | 0 (0.0%) |
| 25 to 29 Years | 35 (100.0%) | 0 (0.0%) |
| 30 to 34 Years | 2 (33.3%) | 2 (100.0%) |
| 35 to 44 Years | 6 (100.0%) | 0 (0.0%) |
| 45 to 54 Years | 123 (96.1%) | 0 (0.0%) |
| 55 to 59 Years | 53 (100.0%) | 0 (0.0%) |
| 60 to 64 Years | 12 (41.4%) | 0 (0.0%) |
| 65 to 74 Years | 0 (0.0%) | 0 (0.0%) |
| 75 Years and over | 0 (0.0%) | 0 (0.0%) |
| Total | 264 (82.8%) | 2 (0.8%) |
Employment Status by Educational Attainment in Beaver Creek
According to labor force statistics for Beaver Creek, 89.9% of individuals (231) out of the total population between 25 and 64 years of age (257) are in the labor force, with 0.9% or 2 of them being unemployed. The group with the highest labor force participation rate are those with the educational attainment of less than high school, with 100.0% or 10 individuals in the labor force. Within the labor force, individuals with high school diploma education have the highest percentage of unemployment, with 3.3% or 2 of them being unemployed.
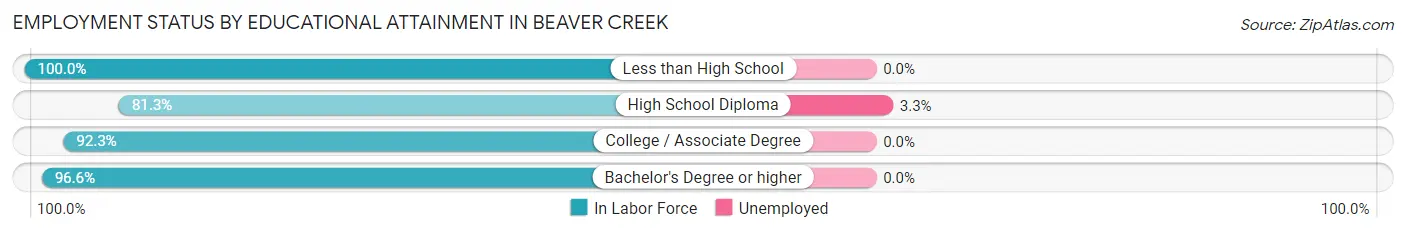
| Educational Attainment | In Labor Force | Unemployed |
| Less than High School | 10 (100.0%) | 0 (0.0%) |
| High School Diploma | 61 (81.3%) | 2 (3.3%) |
| College / Associate Degree | 132 (92.3%) | 0 (0.0%) |
| Bachelor's Degree or higher | 28 (96.6%) | 0 (0.0%) |
| Total | 231 (89.9%) | 2 (0.9%) |
Employment Occupations by Sex in Beaver Creek
Management, Business, Science and Arts Occupations
The most common Management, Business, Science and Arts occupations in Beaver Creek are Management (13 | 5.0%), Business & Financial (11 | 4.2%), Community & Social Service (9 | 3.4%), and Education Instruction & Library (9 | 3.4%).
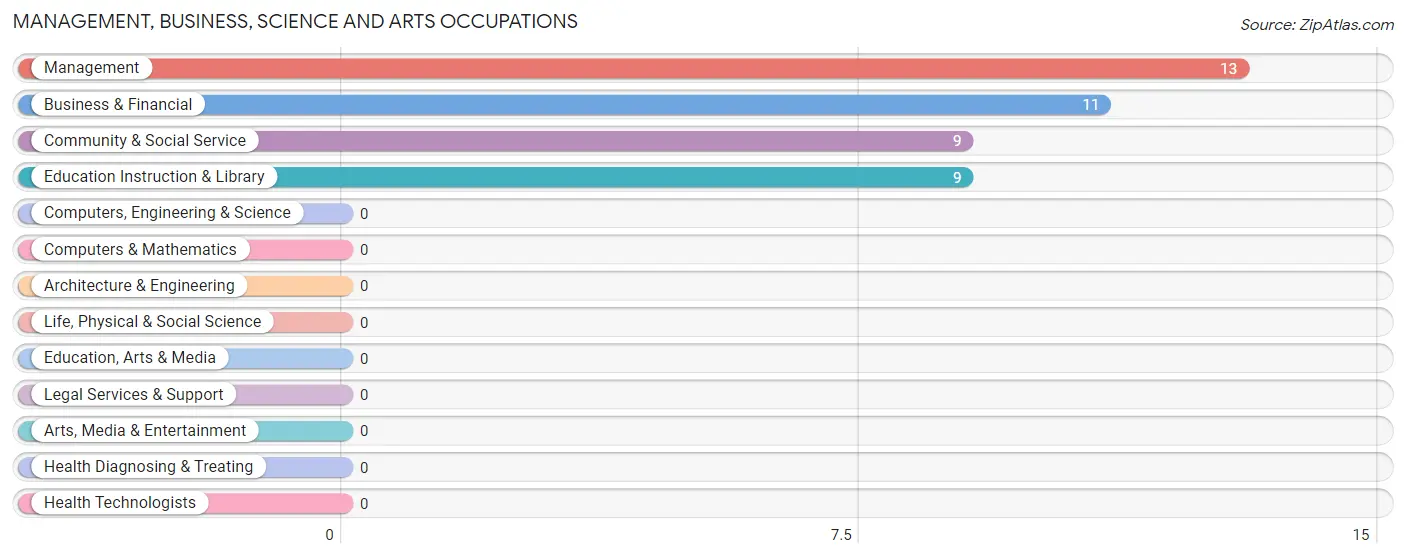
Management, Business, Science and Arts Occupations by Sex
Within the Management, Business, Science and Arts occupations in Beaver Creek, the most male-oriented occupations are Management (92.3%), and Business & Financial (45.5%), while the most female-oriented occupations are Community & Social Service (100.0%), Education Instruction & Library (100.0%), and Business & Financial (54.5%).
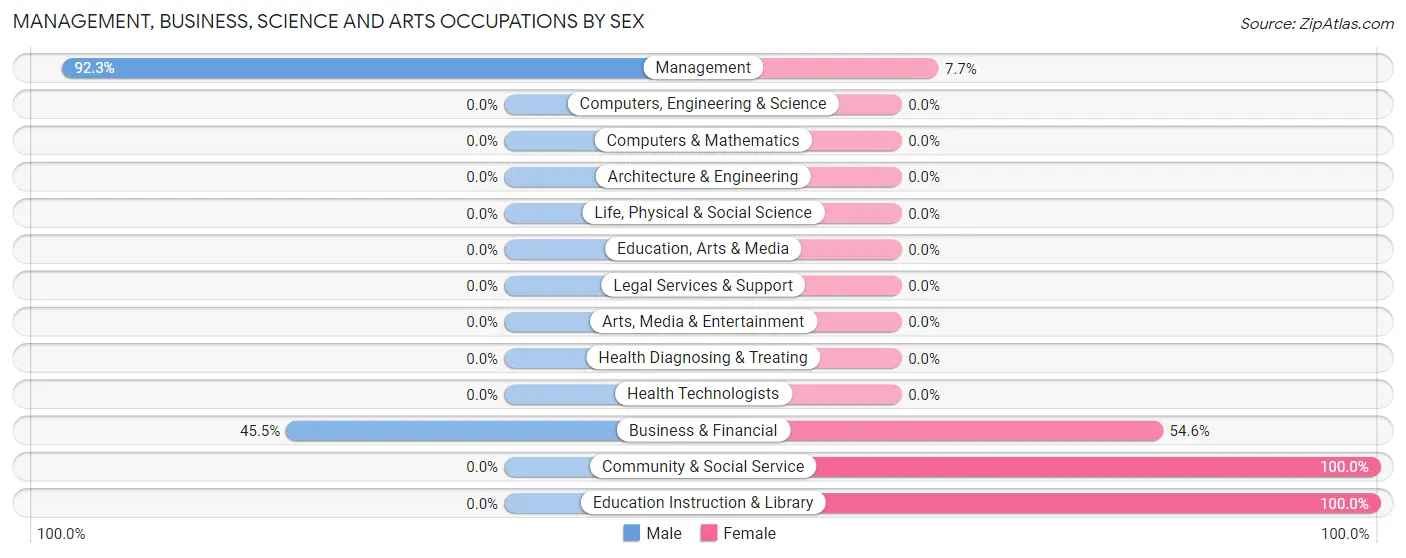
| Occupation | Male | Female |
| Management | 12 (92.3%) | 1 (7.7%) |
| Business & Financial | 5 (45.5%) | 6 (54.5%) |
| Computers, Engineering & Science | 0 (0.0%) | 0 (0.0%) |
| Computers & Mathematics | 0 (0.0%) | 0 (0.0%) |
| Architecture & Engineering | 0 (0.0%) | 0 (0.0%) |
| Life, Physical & Social Science | 0 (0.0%) | 0 (0.0%) |
| Community & Social Service | 0 (0.0%) | 9 (100.0%) |
| Education, Arts & Media | 0 (0.0%) | 0 (0.0%) |
| Legal Services & Support | 0 (0.0%) | 0 (0.0%) |
| Education Instruction & Library | 0 (0.0%) | 9 (100.0%) |
| Arts, Media & Entertainment | 0 (0.0%) | 0 (0.0%) |
| Health Diagnosing & Treating | 0 (0.0%) | 0 (0.0%) |
| Health Technologists | 0 (0.0%) | 0 (0.0%) |
| Total (Category) | 17 (51.5%) | 16 (48.5%) |
| Total (Overall) | 135 (51.5%) | 127 (48.5%) |
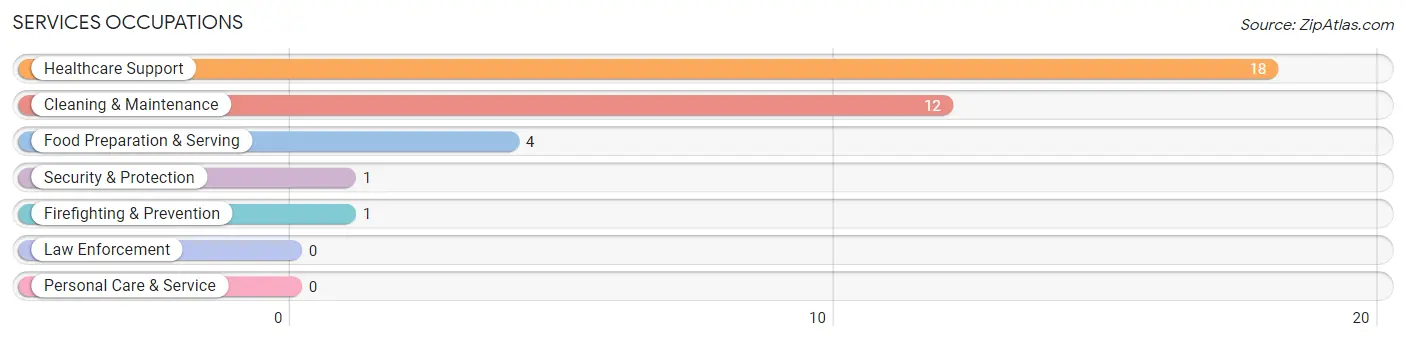
Services Occupations
The most common Services occupations in Beaver Creek are Healthcare Support (18 | 6.9%), Cleaning & Maintenance (12 | 4.6%), Food Preparation & Serving (4 | 1.5%), Security & Protection (1 | 0.4%), and Firefighting & Prevention (1 | 0.4%).
Services Occupations by Sex
Within the Services occupations in Beaver Creek, the most male-oriented occupations are Security & Protection (100.0%), Firefighting & Prevention (100.0%), and Food Preparation & Serving (100.0%), while the most female-oriented occupations are Healthcare Support (100.0%), and Cleaning & Maintenance (41.7%).
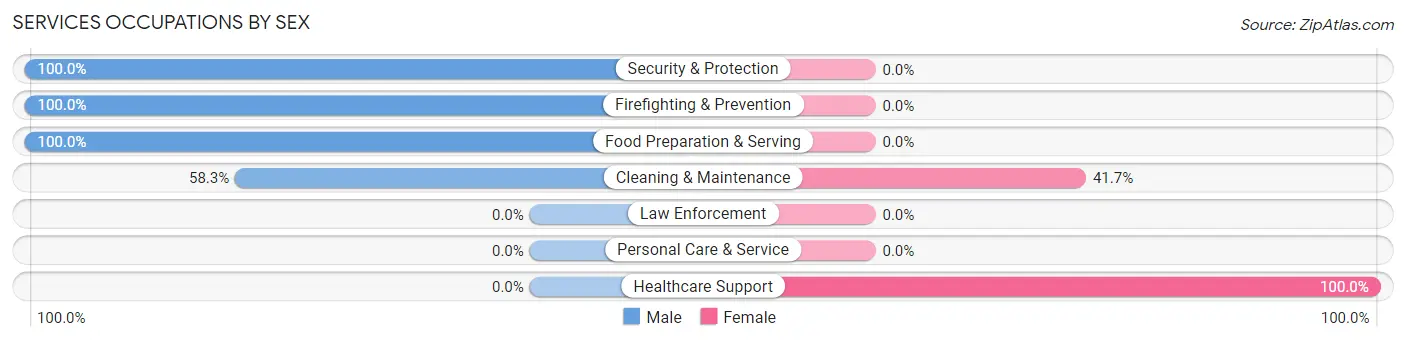
| Occupation | Male | Female |
| Healthcare Support | 0 (0.0%) | 18 (100.0%) |
| Security & Protection | 1 (100.0%) | 0 (0.0%) |
| Firefighting & Prevention | 1 (100.0%) | 0 (0.0%) |
| Law Enforcement | 0 (0.0%) | 0 (0.0%) |
| Food Preparation & Serving | 4 (100.0%) | 0 (0.0%) |
| Cleaning & Maintenance | 7 (58.3%) | 5 (41.7%) |
| Personal Care & Service | 0 (0.0%) | 0 (0.0%) |
| Total (Category) | 12 (34.3%) | 23 (65.7%) |
| Total (Overall) | 135 (51.5%) | 127 (48.5%) |
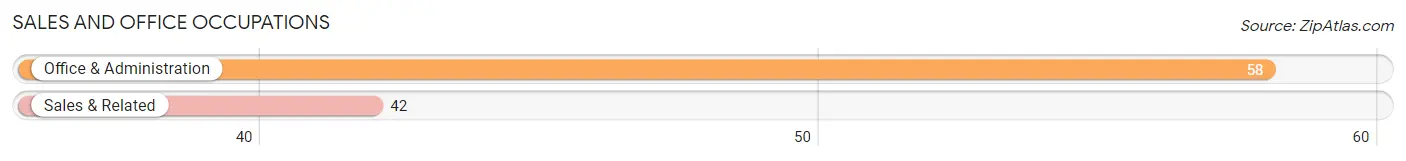
Sales and Office Occupations
The most common Sales and Office occupations in Beaver Creek are Office & Administration (58 | 22.1%), and Sales & Related (42 | 16.0%).
Sales and Office Occupations by Sex

| Occupation | Male | Female |
| Sales & Related | 16 (38.1%) | 26 (61.9%) |
| Office & Administration | 0 (0.0%) | 58 (100.0%) |
| Total (Category) | 16 (16.0%) | 84 (84.0%) |
| Total (Overall) | 135 (51.5%) | 127 (48.5%) |
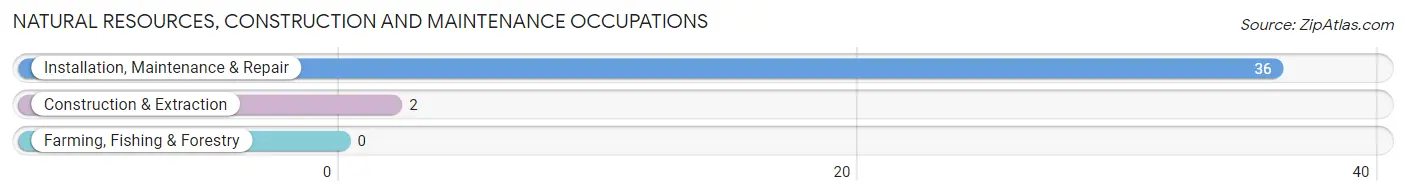
Natural Resources, Construction and Maintenance Occupations
The most common Natural Resources, Construction and Maintenance occupations in Beaver Creek are Installation, Maintenance & Repair (36 | 13.7%), and Construction & Extraction (2 | 0.8%).
Natural Resources, Construction and Maintenance Occupations by Sex
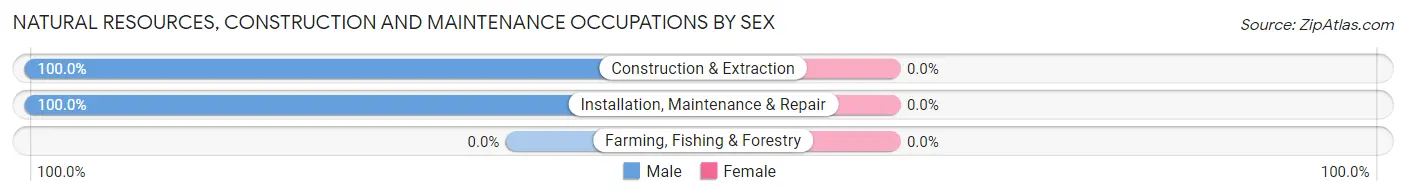
| Occupation | Male | Female |
| Farming, Fishing & Forestry | 0 (0.0%) | 0 (0.0%) |
| Construction & Extraction | 2 (100.0%) | 0 (0.0%) |
| Installation, Maintenance & Repair | 36 (100.0%) | 0 (0.0%) |
| Total (Category) | 38 (100.0%) | 0 (0.0%) |
| Total (Overall) | 135 (51.5%) | 127 (48.5%) |
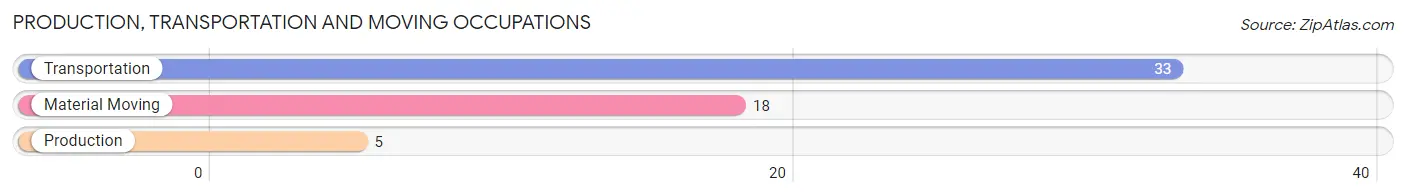
Production, Transportation and Moving Occupations
The most common Production, Transportation and Moving occupations in Beaver Creek are Transportation (33 | 12.6%), Material Moving (18 | 6.9%), and Production (5 | 1.9%).
Production, Transportation and Moving Occupations by Sex
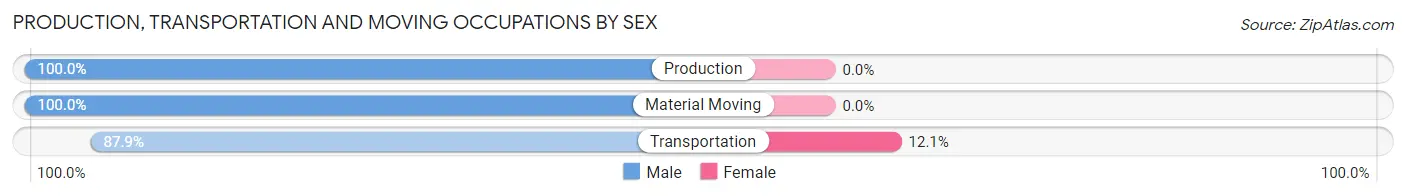
| Occupation | Male | Female |
| Production | 5 (100.0%) | 0 (0.0%) |
| Transportation | 29 (87.9%) | 4 (12.1%) |
| Material Moving | 18 (100.0%) | 0 (0.0%) |
| Total (Category) | 52 (92.9%) | 4 (7.1%) |
| Total (Overall) | 135 (51.5%) | 127 (48.5%) |
Employment Industries by Sex in Beaver Creek
Employment Industries in Beaver Creek
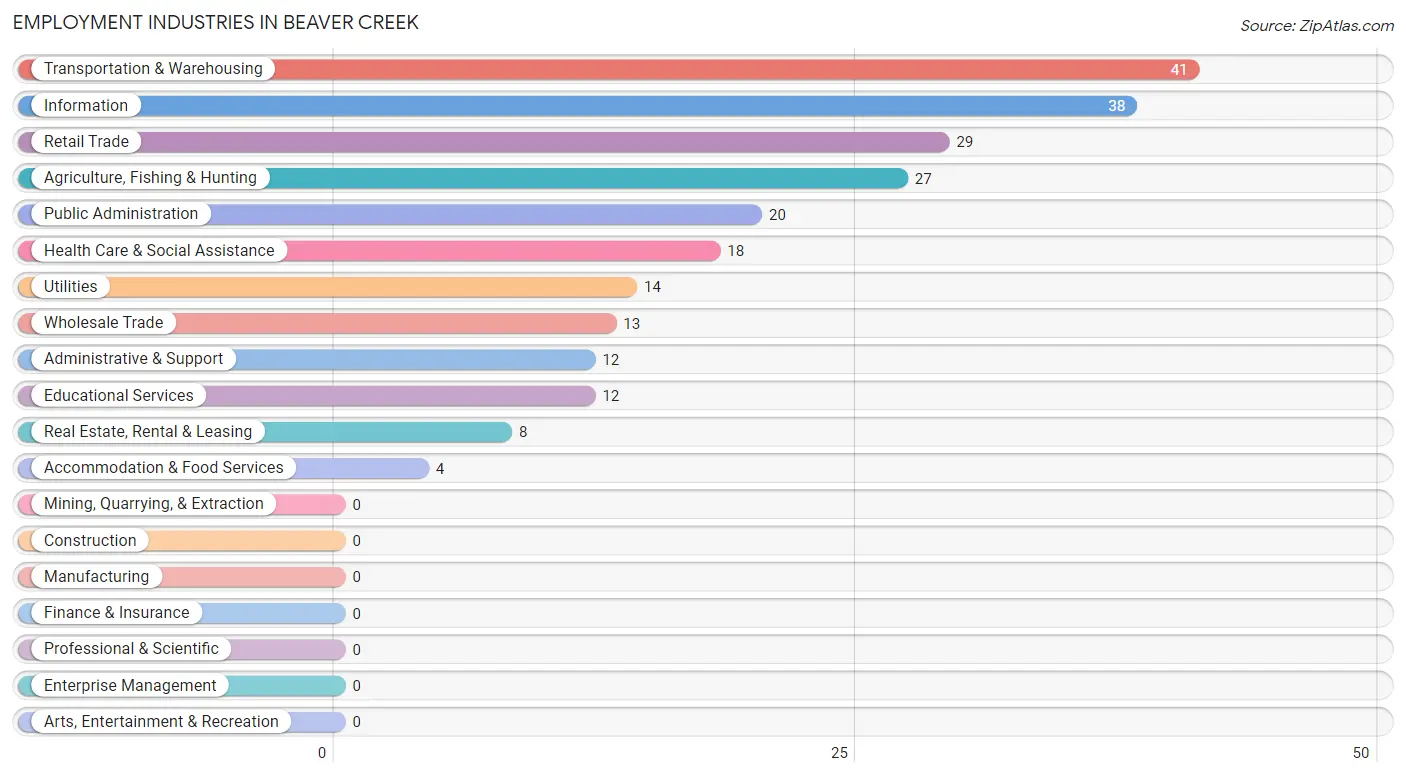
The major employment industries in Beaver Creek include Transportation & Warehousing (41 | 15.7%), Information (38 | 14.5%), Retail Trade (29 | 11.1%), Agriculture, Fishing & Hunting (27 | 10.3%), and Public Administration (20 | 7.6%).
Employment Industries by Sex in Beaver Creek
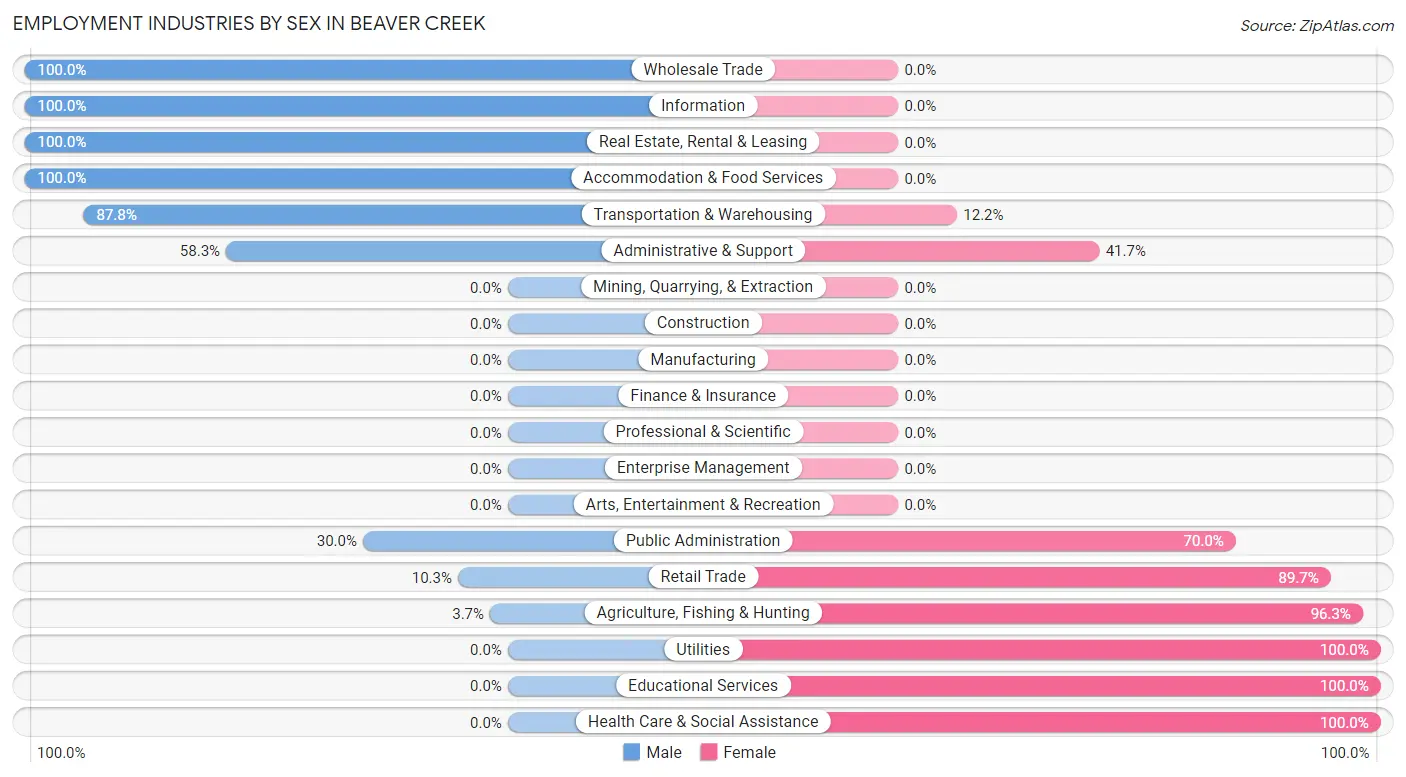
The Beaver Creek industries that see more men than women are Wholesale Trade (100.0%), Information (100.0%), and Real Estate, Rental & Leasing (100.0%), whereas the industries that tend to have a higher number of women are Utilities (100.0%), Educational Services (100.0%), and Health Care & Social Assistance (100.0%).
| Industry | Male | Female |
| Agriculture, Fishing & Hunting | 1 (3.7%) | 26 (96.3%) |
| Mining, Quarrying, & Extraction | 0 (0.0%) | 0 (0.0%) |
| Construction | 0 (0.0%) | 0 (0.0%) |
| Manufacturing | 0 (0.0%) | 0 (0.0%) |
| Wholesale Trade | 13 (100.0%) | 0 (0.0%) |
| Retail Trade | 3 (10.3%) | 26 (89.7%) |
| Transportation & Warehousing | 36 (87.8%) | 5 (12.2%) |
| Utilities | 0 (0.0%) | 14 (100.0%) |
| Information | 38 (100.0%) | 0 (0.0%) |
| Finance & Insurance | 0 (0.0%) | 0 (0.0%) |
| Real Estate, Rental & Leasing | 8 (100.0%) | 0 (0.0%) |
| Professional & Scientific | 0 (0.0%) | 0 (0.0%) |
| Enterprise Management | 0 (0.0%) | 0 (0.0%) |
| Administrative & Support | 7 (58.3%) | 5 (41.7%) |
| Educational Services | 0 (0.0%) | 12 (100.0%) |
| Health Care & Social Assistance | 0 (0.0%) | 18 (100.0%) |
| Arts, Entertainment & Recreation | 0 (0.0%) | 0 (0.0%) |
| Accommodation & Food Services | 4 (100.0%) | 0 (0.0%) |
| Public Administration | 6 (30.0%) | 14 (70.0%) |
| Total | 135 (51.5%) | 127 (48.5%) |
Education in Beaver Creek
School Enrollment in Beaver Creek
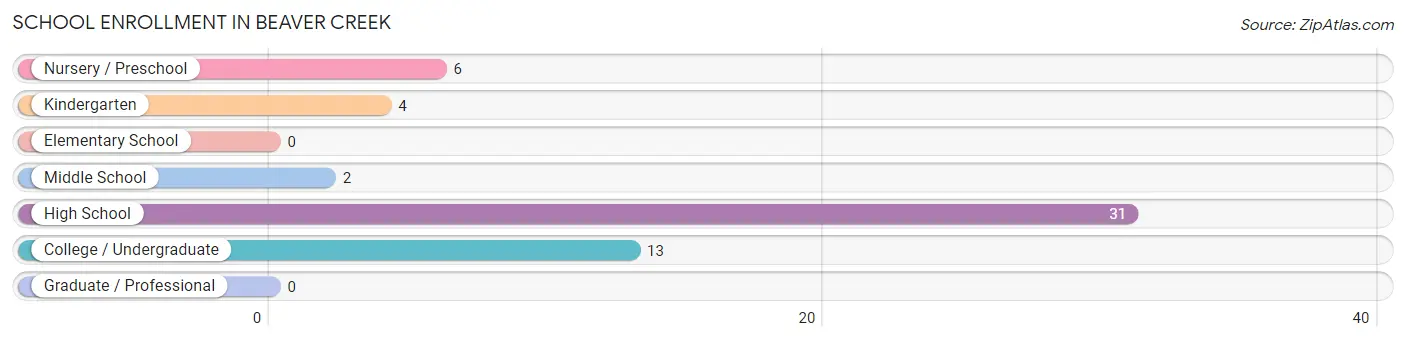
The most common levels of schooling among the 56 students in Beaver Creek are high school (31 | 55.4%), college / undergraduate (13 | 23.2%), and nursery / preschool (6 | 10.7%).
| School Level | # Students | % Students |
| Nursery / Preschool | 6 | 10.7% |
| Kindergarten | 4 | 7.1% |
| Elementary School | 0 | 0.0% |
| Middle School | 2 | 3.6% |
| High School | 31 | 55.4% |
| College / Undergraduate | 13 | 23.2% |
| Graduate / Professional | 0 | 0.0% |
| Total | 56 | 100.0% |
School Enrollment by Age by Funding Source in Beaver Creek

| Age Bracket | Public School | Private School |
| 3 to 4 Year Olds | 1 (100.0%) | 0 (0.0%) |
| 5 to 9 Year Old | 9 (100.0%) | 0 (0.0%) |
| 10 to 14 Year Olds | 3 (100.0%) | 0 (0.0%) |
| 15 to 17 Year Olds | 30 (100.0%) | 0 (0.0%) |
| 18 to 19 Year Olds | 13 (100.0%) | 0 (0.0%) |
| 20 to 24 Year Olds | 0 (0.0%) | 0 (0.0%) |
| 25 to 34 Year Olds | 0 (0.0%) | 0 (0.0%) |
| 35 Years and over | 0 (0.0%) | 0 (0.0%) |
| Total | 56 (100.0%) | 0 (0.0%) |
Educational Attainment by Field of Study in Beaver Creek
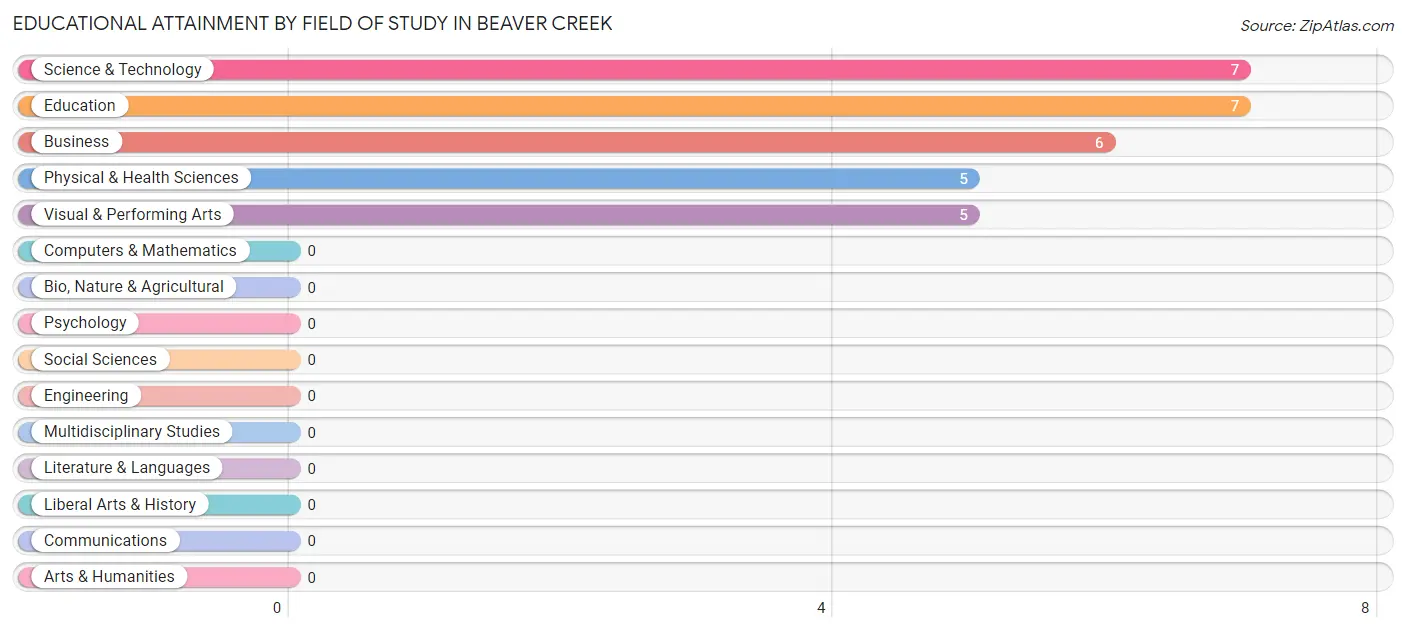
Science & technology (7 | 23.3%), education (7 | 23.3%), business (6 | 20.0%), physical & health sciences (5 | 16.7%), and visual & performing arts (5 | 16.7%) are the most common fields of study among 30 individuals in Beaver Creek who have obtained a bachelor's degree or higher.
| Field of Study | # Graduates | % Graduates |
| Computers & Mathematics | 0 | 0.0% |
| Bio, Nature & Agricultural | 0 | 0.0% |
| Physical & Health Sciences | 5 | 16.7% |
| Psychology | 0 | 0.0% |
| Social Sciences | 0 | 0.0% |
| Engineering | 0 | 0.0% |
| Multidisciplinary Studies | 0 | 0.0% |
| Science & Technology | 7 | 23.3% |
| Business | 6 | 20.0% |
| Education | 7 | 23.3% |
| Literature & Languages | 0 | 0.0% |
| Liberal Arts & History | 0 | 0.0% |
| Visual & Performing Arts | 5 | 16.7% |
| Communications | 0 | 0.0% |
| Arts & Humanities | 0 | 0.0% |
| Total | 30 | 100.0% |
Transportation & Commute in Beaver Creek
Vehicle Availability by Sex in Beaver Creek
The most prevalent vehicle ownership categories in Beaver Creek are males with 3 vehicles (65, accounting for 48.1%) and females with 3 vehicles (51, making up 52.0%).
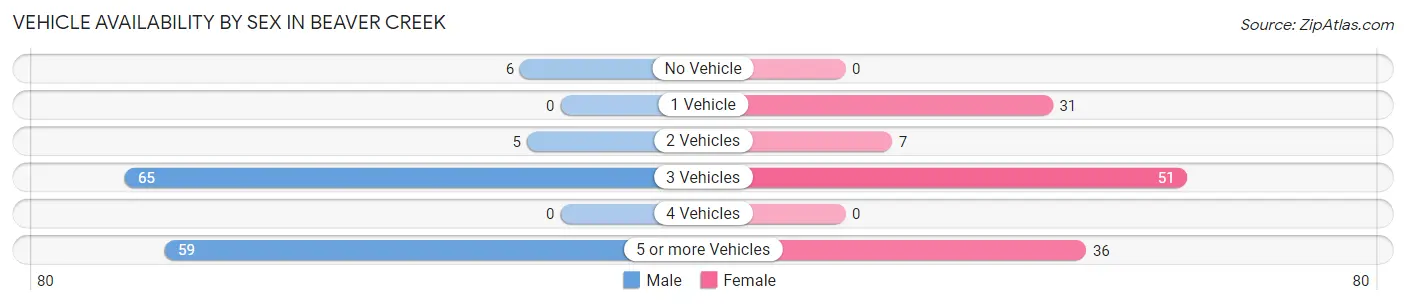
| Vehicles Available | Male | Female |
| No Vehicle | 6 (4.4%) | 0 (0.0%) |
| 1 Vehicle | 0 (0.0%) | 31 (24.8%) |
| 2 Vehicles | 5 (3.7%) | 7 (5.6%) |
| 3 Vehicles | 65 (48.1%) | 51 (40.8%) |
| 4 Vehicles | 0 (0.0%) | 0 (0.0%) |
| 5 or more Vehicles | 59 (43.7%) | 36 (28.8%) |
| Total | 135 (100.0%) | 125 (100.0%) |
Commute Time in Beaver Creek
The most frequently occuring commute durations in Beaver Creek are 20 to 24 minutes (100 commuters, 38.8%), 15 to 19 minutes (76 commuters, 29.5%), and 10 to 14 minutes (42 commuters, 16.3%).
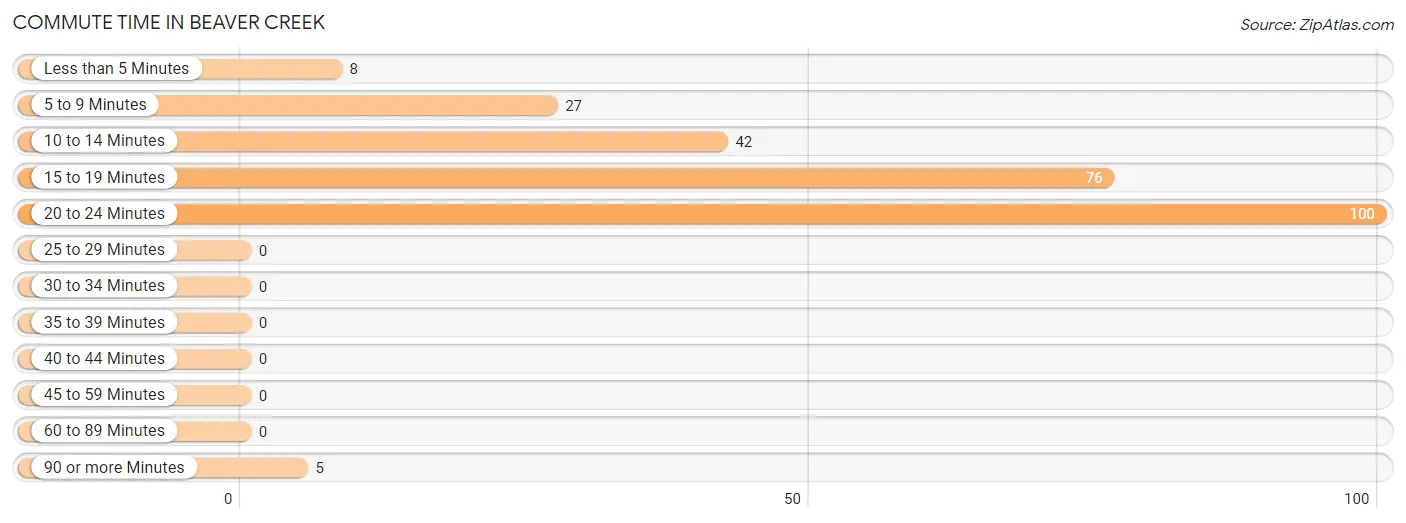
| Commute Time | # Commuters | % Commuters |
| Less than 5 Minutes | 8 | 3.1% |
| 5 to 9 Minutes | 27 | 10.5% |
| 10 to 14 Minutes | 42 | 16.3% |
| 15 to 19 Minutes | 76 | 29.5% |
| 20 to 24 Minutes | 100 | 38.8% |
| 25 to 29 Minutes | 0 | 0.0% |
| 30 to 34 Minutes | 0 | 0.0% |
| 35 to 39 Minutes | 0 | 0.0% |
| 40 to 44 Minutes | 0 | 0.0% |
| 45 to 59 Minutes | 0 | 0.0% |
| 60 to 89 Minutes | 0 | 0.0% |
| 90 or more Minutes | 5 | 1.9% |
Commute Time by Sex in Beaver Creek
The most common commute times in Beaver Creek are 20 to 24 minutes (67 commuters, 50.0%) for males and 15 to 19 minutes (75 commuters, 60.5%) for females.
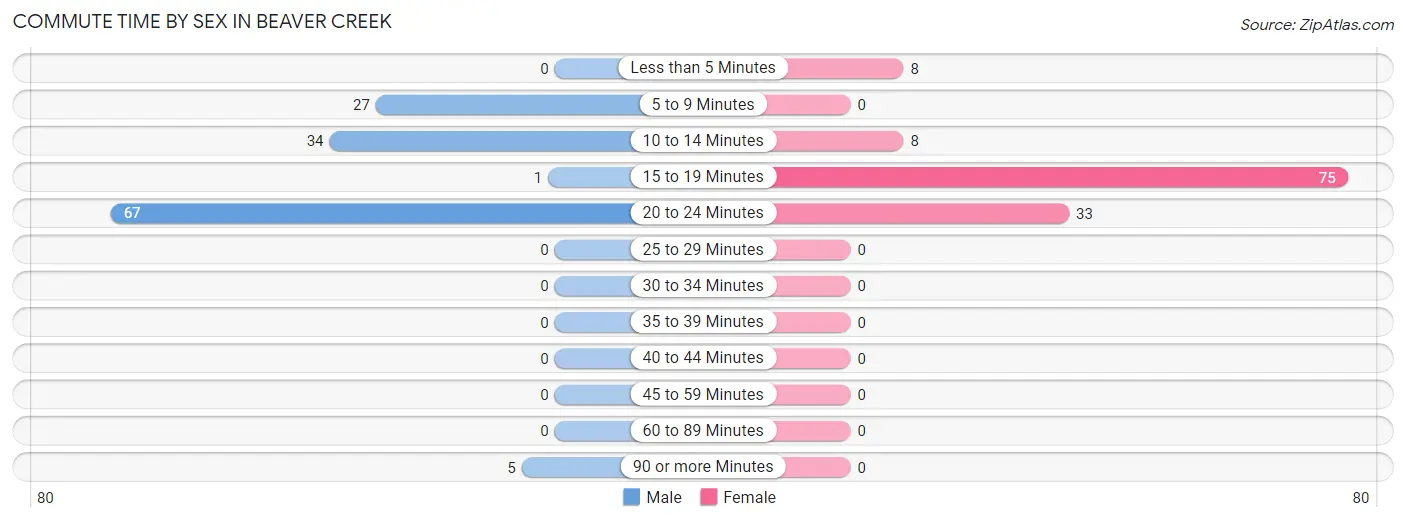
| Commute Time | Male | Female |
| Less than 5 Minutes | 0 (0.0%) | 8 (6.5%) |
| 5 to 9 Minutes | 27 (20.2%) | 0 (0.0%) |
| 10 to 14 Minutes | 34 (25.4%) | 8 (6.5%) |
| 15 to 19 Minutes | 1 (0.7%) | 75 (60.5%) |
| 20 to 24 Minutes | 67 (50.0%) | 33 (26.6%) |
| 25 to 29 Minutes | 0 (0.0%) | 0 (0.0%) |
| 30 to 34 Minutes | 0 (0.0%) | 0 (0.0%) |
| 35 to 39 Minutes | 0 (0.0%) | 0 (0.0%) |
| 40 to 44 Minutes | 0 (0.0%) | 0 (0.0%) |
| 45 to 59 Minutes | 0 (0.0%) | 0 (0.0%) |
| 60 to 89 Minutes | 0 (0.0%) | 0 (0.0%) |
| 90 or more Minutes | 5 (3.7%) | 0 (0.0%) |
Time of Departure to Work by Sex in Beaver Creek
The most frequent times of departure to work in Beaver Creek are 7:30 AM to 7:59 AM (43, 32.1%) for males and 7:30 AM to 7:59 AM (56, 45.2%) for females.
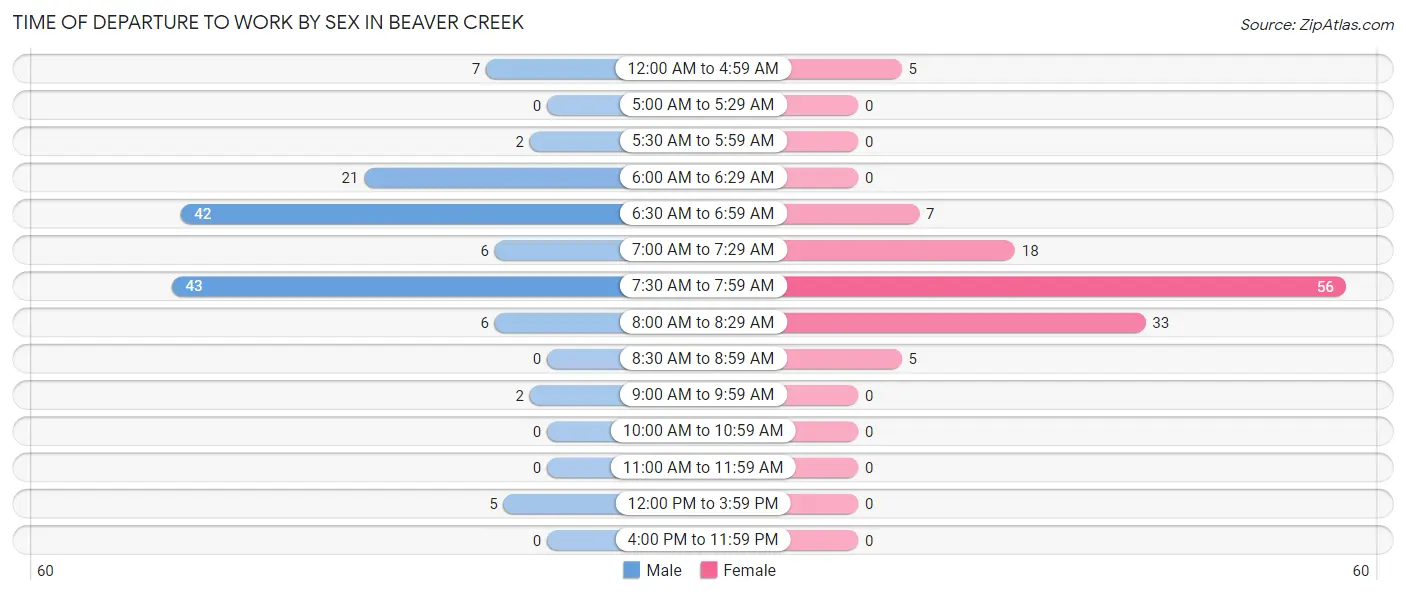
| Time of Departure | Male | Female |
| 12:00 AM to 4:59 AM | 7 (5.2%) | 5 (4.0%) |
| 5:00 AM to 5:29 AM | 0 (0.0%) | 0 (0.0%) |
| 5:30 AM to 5:59 AM | 2 (1.5%) | 0 (0.0%) |
| 6:00 AM to 6:29 AM | 21 (15.7%) | 0 (0.0%) |
| 6:30 AM to 6:59 AM | 42 (31.3%) | 7 (5.7%) |
| 7:00 AM to 7:29 AM | 6 (4.5%) | 18 (14.5%) |
| 7:30 AM to 7:59 AM | 43 (32.1%) | 56 (45.2%) |
| 8:00 AM to 8:29 AM | 6 (4.5%) | 33 (26.6%) |
| 8:30 AM to 8:59 AM | 0 (0.0%) | 5 (4.0%) |
| 9:00 AM to 9:59 AM | 2 (1.5%) | 0 (0.0%) |
| 10:00 AM to 10:59 AM | 0 (0.0%) | 0 (0.0%) |
| 11:00 AM to 11:59 AM | 0 (0.0%) | 0 (0.0%) |
| 12:00 PM to 3:59 PM | 5 (3.7%) | 0 (0.0%) |
| 4:00 PM to 11:59 PM | 0 (0.0%) | 0 (0.0%) |
| Total | 134 (100.0%) | 124 (100.0%) |
Housing Occupancy in Beaver Creek
Occupancy by Ownership in Beaver Creek
Of the total 171 dwellings in Beaver Creek, owner-occupied units account for 135 (78.9%), while renter-occupied units make up 36 (21.0%).
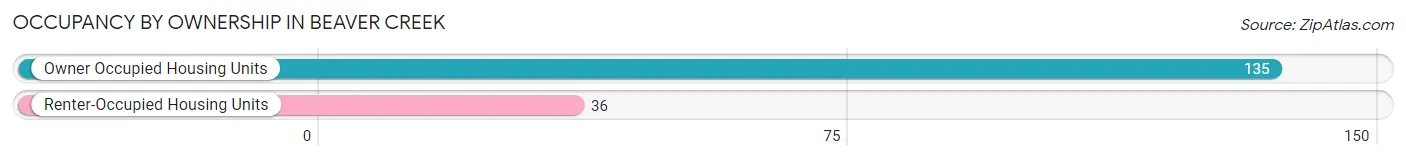
| Occupancy | # Housing Units | % Housing Units |
| Owner Occupied Housing Units | 135 | 78.9% |
| Renter-Occupied Housing Units | 36 | 21.0% |
| Total Occupied Housing Units | 171 | 100.0% |
Occupancy by Household Size in Beaver Creek
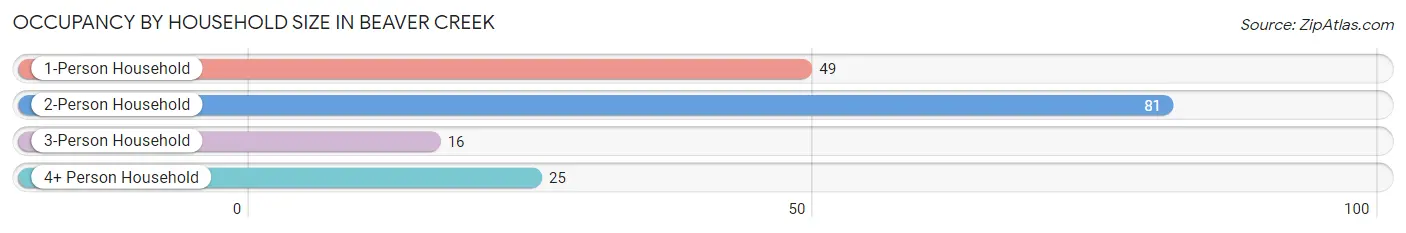
| Household Size | # Housing Units | % Housing Units |
| 1-Person Household | 49 | 28.6% |
| 2-Person Household | 81 | 47.4% |
| 3-Person Household | 16 | 9.4% |
| 4+ Person Household | 25 | 14.6% |
| Total Housing Units | 171 | 100.0% |
Occupancy by Ownership by Household Size in Beaver Creek
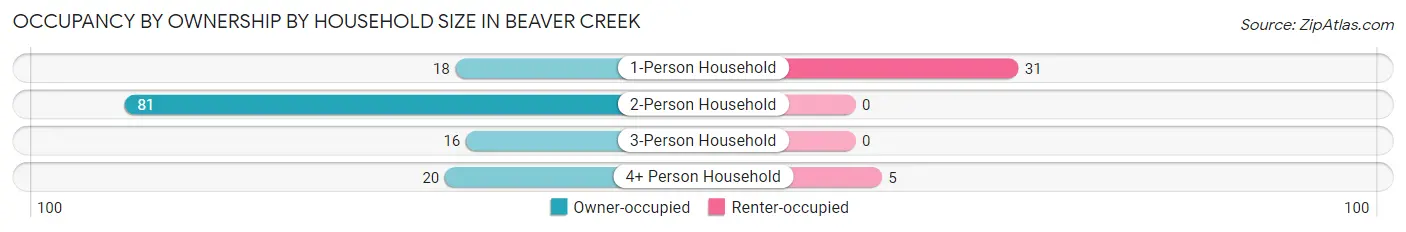
| Household Size | Owner-occupied | Renter-occupied |
| 1-Person Household | 18 (36.7%) | 31 (63.3%) |
| 2-Person Household | 81 (100.0%) | 0 (0.0%) |
| 3-Person Household | 16 (100.0%) | 0 (0.0%) |
| 4+ Person Household | 20 (80.0%) | 5 (20.0%) |
| Total Housing Units | 135 (78.9%) | 36 (21.0%) |
Occupancy by Educational Attainment in Beaver Creek
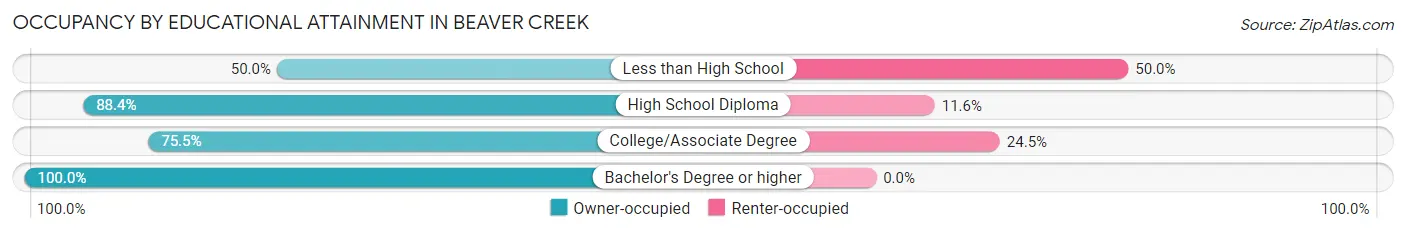
| Household Size | Owner-occupied | Renter-occupied |
| Less than High School | 5 (50.0%) | 5 (50.0%) |
| High School Diploma | 38 (88.4%) | 5 (11.6%) |
| College/Associate Degree | 80 (75.5%) | 26 (24.5%) |
| Bachelor's Degree or higher | 12 (100.0%) | 0 (0.0%) |
Occupancy by Age of Householder in Beaver Creek
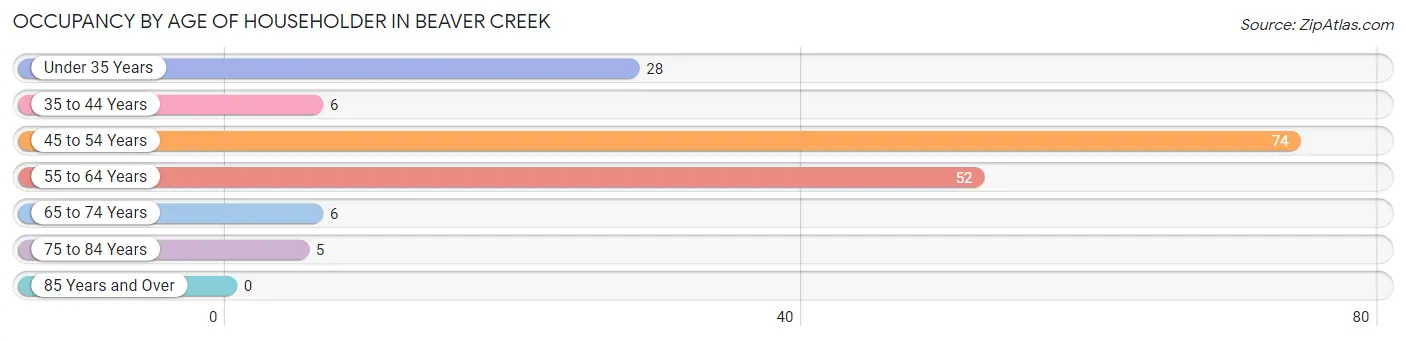
| Age Bracket | # Households | % Households |
| Under 35 Years | 28 | 16.4% |
| 35 to 44 Years | 6 | 3.5% |
| 45 to 54 Years | 74 | 43.3% |
| 55 to 64 Years | 52 | 30.4% |
| 65 to 74 Years | 6 | 3.5% |
| 75 to 84 Years | 5 | 2.9% |
| 85 Years and Over | 0 | 0.0% |
| Total | 171 | 100.0% |
Housing Finances in Beaver Creek
Median Income by Occupancy in Beaver Creek
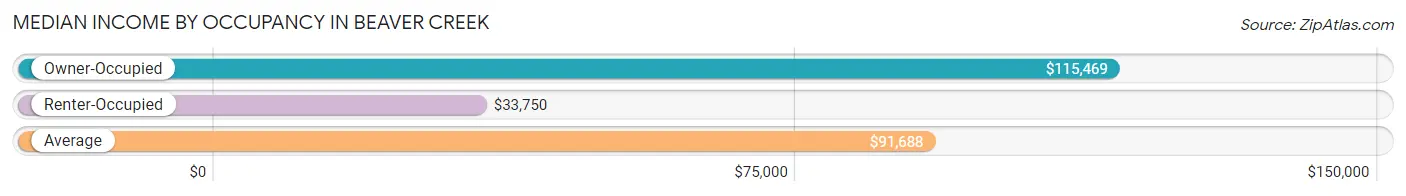
| Occupancy Type | # Households | Median Income |
| Owner-Occupied | 135 (78.9%) | $115,469 |
| Renter-Occupied | 36 (21.0%) | $33,750 |
| Average | 171 (100.0%) | $91,688 |
Occupancy by Householder Income Bracket in Beaver Creek
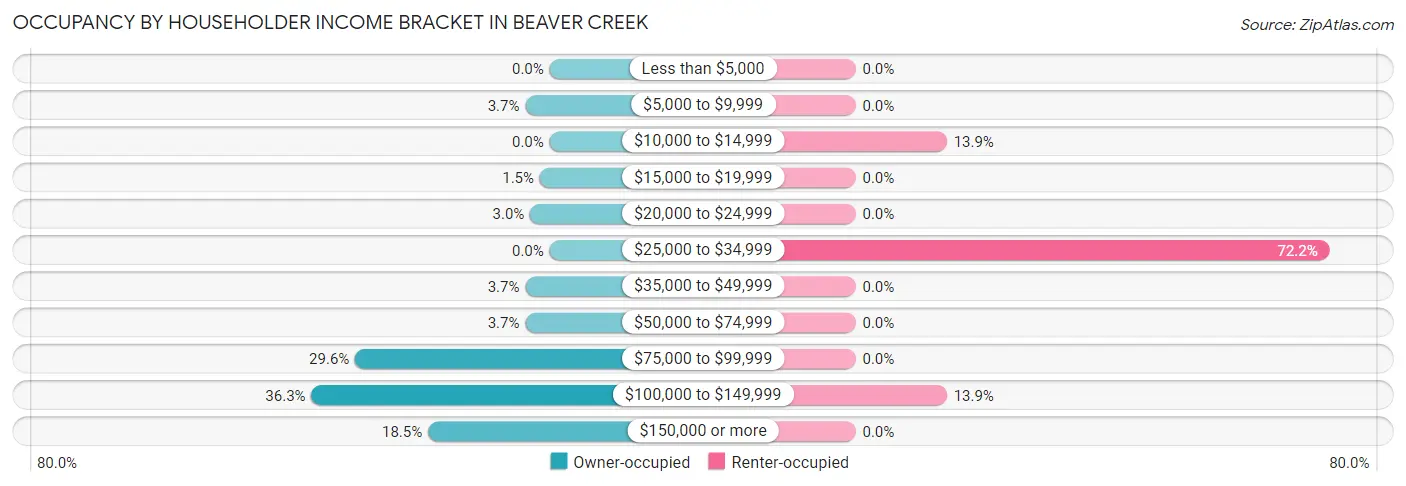
| Income Bracket | Owner-occupied | Renter-occupied |
| Less than $5,000 | 0 (0.0%) | 0 (0.0%) |
| $5,000 to $9,999 | 5 (3.7%) | 0 (0.0%) |
| $10,000 to $14,999 | 0 (0.0%) | 5 (13.9%) |
| $15,000 to $19,999 | 2 (1.5%) | 0 (0.0%) |
| $20,000 to $24,999 | 4 (3.0%) | 0 (0.0%) |
| $25,000 to $34,999 | 0 (0.0%) | 26 (72.2%) |
| $35,000 to $49,999 | 5 (3.7%) | 0 (0.0%) |
| $50,000 to $74,999 | 5 (3.7%) | 0 (0.0%) |
| $75,000 to $99,999 | 40 (29.6%) | 0 (0.0%) |
| $100,000 to $149,999 | 49 (36.3%) | 5 (13.9%) |
| $150,000 or more | 25 (18.5%) | 0 (0.0%) |
| Total | 135 (100.0%) | 36 (100.0%) |
Monthly Housing Cost Tiers in Beaver Creek
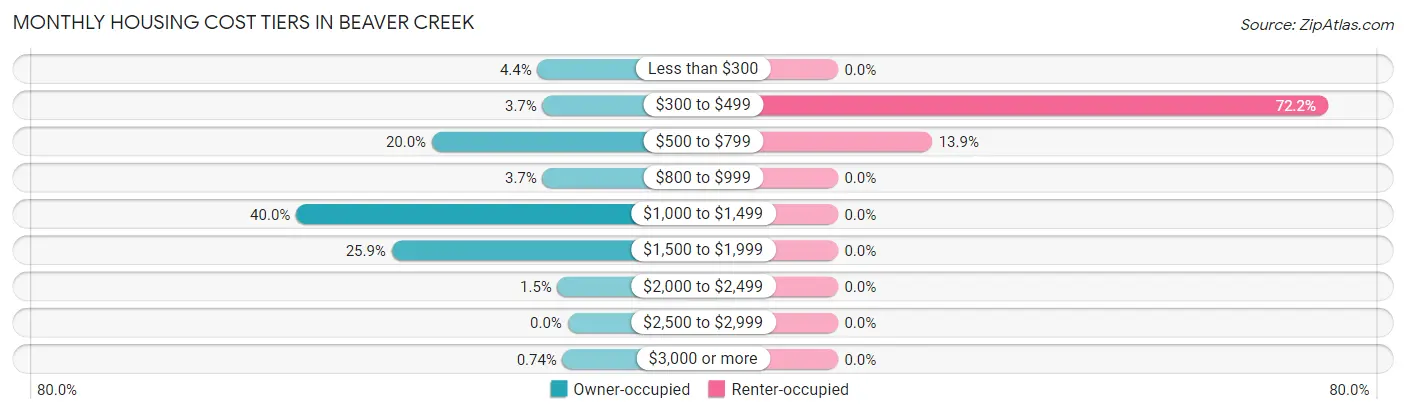
| Monthly Cost | Owner-occupied | Renter-occupied |
| Less than $300 | 6 (4.4%) | 0 (0.0%) |
| $300 to $499 | 5 (3.7%) | 26 (72.2%) |
| $500 to $799 | 27 (20.0%) | 5 (13.9%) |
| $800 to $999 | 5 (3.7%) | 0 (0.0%) |
| $1,000 to $1,499 | 54 (40.0%) | 0 (0.0%) |
| $1,500 to $1,999 | 35 (25.9%) | 0 (0.0%) |
| $2,000 to $2,499 | 2 (1.5%) | 0 (0.0%) |
| $2,500 to $2,999 | 0 (0.0%) | 0 (0.0%) |
| $3,000 or more | 1 (0.7%) | 0 (0.0%) |
| Total | 135 (100.0%) | 36 (100.0%) |
Physical Housing Characteristics in Beaver Creek
Housing Structures in Beaver Creek
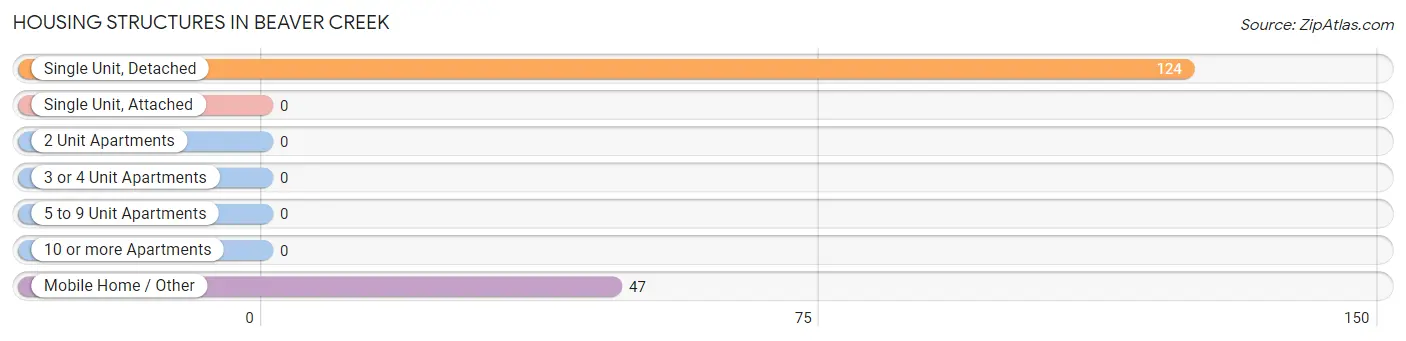
| Structure Type | # Housing Units | % Housing Units |
| Single Unit, Detached | 124 | 72.5% |
| Single Unit, Attached | 0 | 0.0% |
| 2 Unit Apartments | 0 | 0.0% |
| 3 or 4 Unit Apartments | 0 | 0.0% |
| 5 to 9 Unit Apartments | 0 | 0.0% |
| 10 or more Apartments | 0 | 0.0% |
| Mobile Home / Other | 47 | 27.5% |
| Total | 171 | 100.0% |
Housing Structures by Occupancy in Beaver Creek
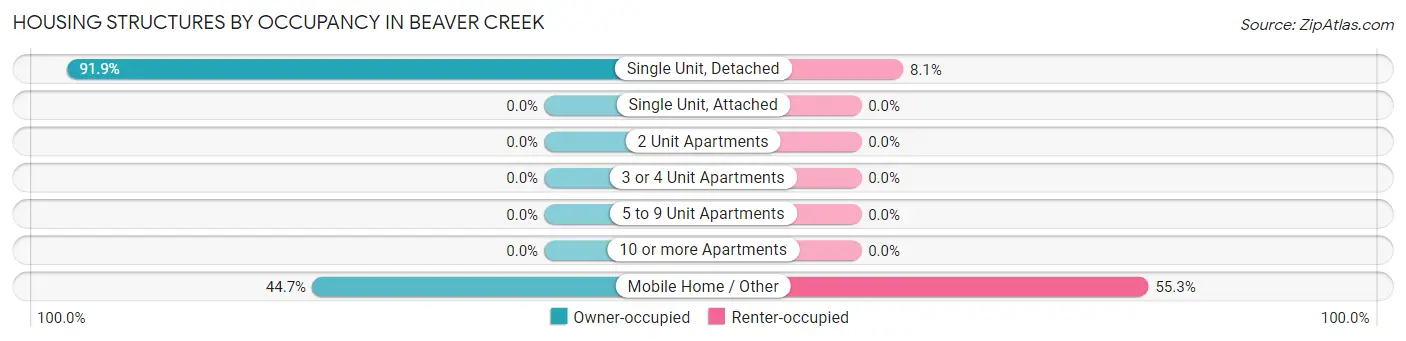
| Structure Type | Owner-occupied | Renter-occupied |
| Single Unit, Detached | 114 (91.9%) | 10 (8.1%) |
| Single Unit, Attached | 0 (0.0%) | 0 (0.0%) |
| 2 Unit Apartments | 0 (0.0%) | 0 (0.0%) |
| 3 or 4 Unit Apartments | 0 (0.0%) | 0 (0.0%) |
| 5 to 9 Unit Apartments | 0 (0.0%) | 0 (0.0%) |
| 10 or more Apartments | 0 (0.0%) | 0 (0.0%) |
| Mobile Home / Other | 21 (44.7%) | 26 (55.3%) |
| Total | 135 (78.9%) | 36 (21.0%) |
Housing Structures by Number of Rooms in Beaver Creek
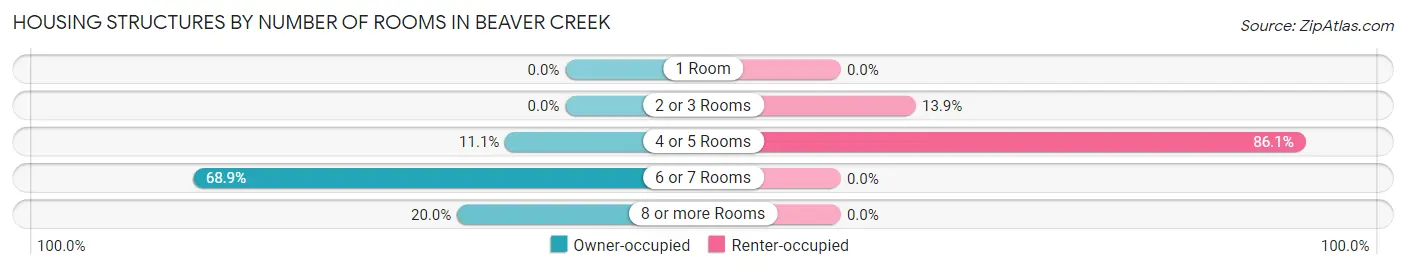
| Number of Rooms | Owner-occupied | Renter-occupied |
| 1 Room | 0 (0.0%) | 0 (0.0%) |
| 2 or 3 Rooms | 0 (0.0%) | 5 (13.9%) |
| 4 or 5 Rooms | 15 (11.1%) | 31 (86.1%) |
| 6 or 7 Rooms | 93 (68.9%) | 0 (0.0%) |
| 8 or more Rooms | 27 (20.0%) | 0 (0.0%) |
| Total | 135 (100.0%) | 36 (100.0%) |
Housing Structure by Heating Type in Beaver Creek
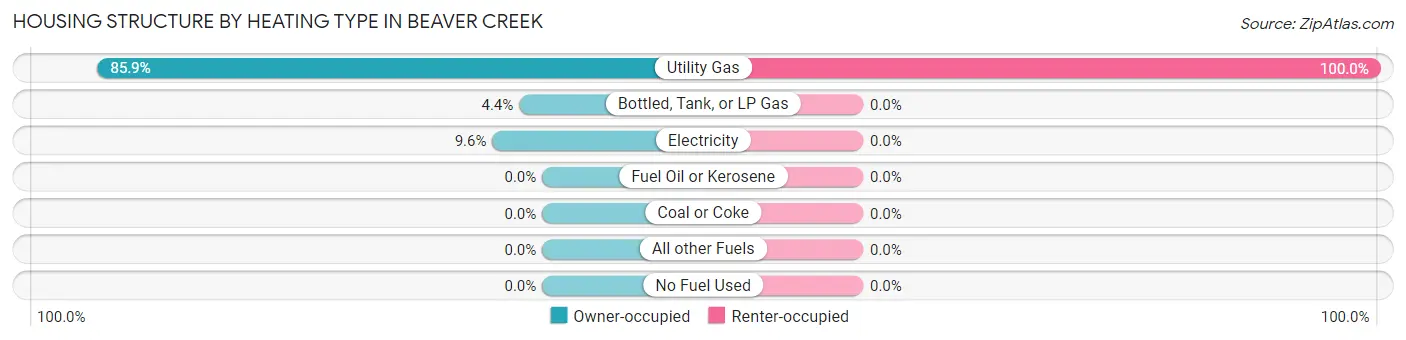
| Heating Type | Owner-occupied | Renter-occupied |
| Utility Gas | 116 (85.9%) | 36 (100.0%) |
| Bottled, Tank, or LP Gas | 6 (4.4%) | 0 (0.0%) |
| Electricity | 13 (9.6%) | 0 (0.0%) |
| Fuel Oil or Kerosene | 0 (0.0%) | 0 (0.0%) |
| Coal or Coke | 0 (0.0%) | 0 (0.0%) |
| All other Fuels | 0 (0.0%) | 0 (0.0%) |
| No Fuel Used | 0 (0.0%) | 0 (0.0%) |
| Total | 135 (100.0%) | 36 (100.0%) |
Household Vehicle Usage in Beaver Creek
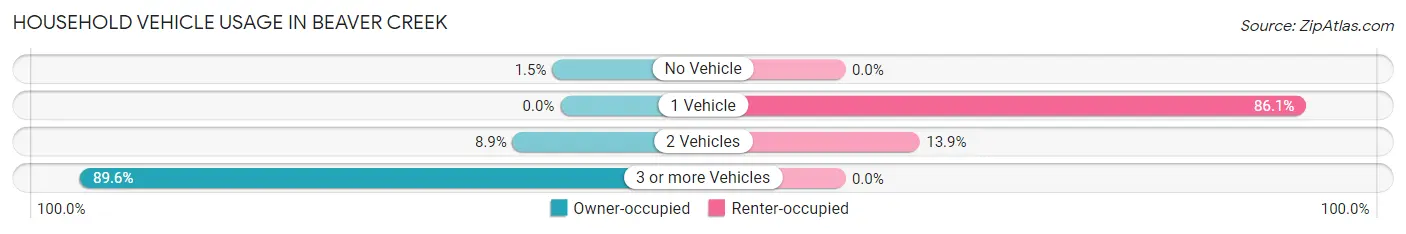
| Vehicles per Household | Owner-occupied | Renter-occupied |
| No Vehicle | 2 (1.5%) | 0 (0.0%) |
| 1 Vehicle | 0 (0.0%) | 31 (86.1%) |
| 2 Vehicles | 12 (8.9%) | 5 (13.9%) |
| 3 or more Vehicles | 121 (89.6%) | 0 (0.0%) |
| Total | 135 (100.0%) | 36 (100.0%) |
Real Estate & Mortgages in Beaver Creek
Real Estate and Mortgage Overview in Beaver Creek
| Characteristic | Without Mortgage | With Mortgage |
| Housing Units | 22 | 113 |
| Median Property Value | $220,000 | $252,700 |
| Median Household Income | - | - |
| Monthly Housing Costs | $500 | $1 |
| Real Estate Taxes | $867 | $0 |
Property Value by Mortgage Status in Beaver Creek
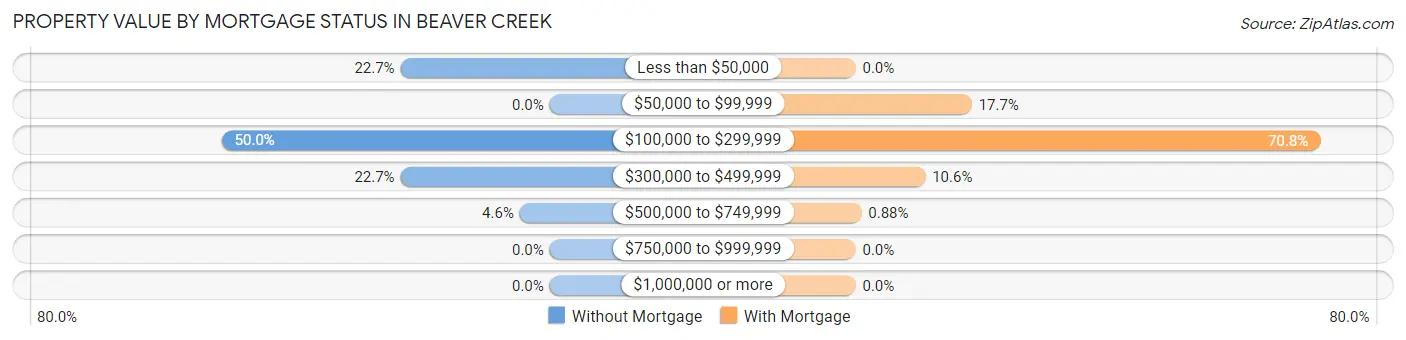
| Property Value | Without Mortgage | With Mortgage |
| Less than $50,000 | 5 (22.7%) | 0 (0.0%) |
| $50,000 to $99,999 | 0 (0.0%) | 20 (17.7%) |
| $100,000 to $299,999 | 11 (50.0%) | 80 (70.8%) |
| $300,000 to $499,999 | 5 (22.7%) | 12 (10.6%) |
| $500,000 to $749,999 | 1 (4.5%) | 1 (0.9%) |
| $750,000 to $999,999 | 0 (0.0%) | 0 (0.0%) |
| $1,000,000 or more | 0 (0.0%) | 0 (0.0%) |
| Total | 22 (100.0%) | 113 (100.0%) |
Household Income by Mortgage Status in Beaver Creek
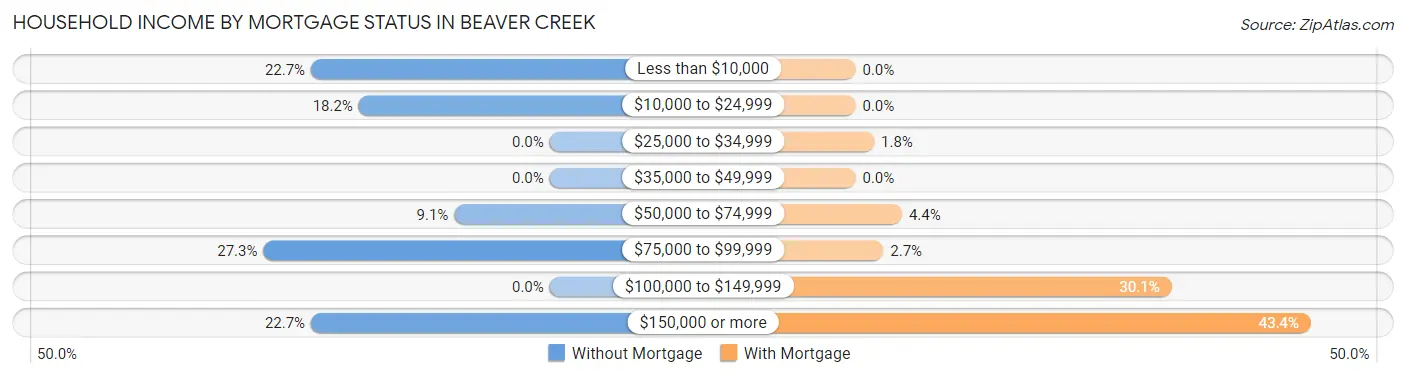
| Household Income | Without Mortgage | With Mortgage |
| Less than $10,000 | 5 (22.7%) | 0 (0.0%) |
| $10,000 to $24,999 | 4 (18.2%) | 0 (0.0%) |
| $25,000 to $34,999 | 0 (0.0%) | 2 (1.8%) |
| $35,000 to $49,999 | 0 (0.0%) | 0 (0.0%) |
| $50,000 to $74,999 | 2 (9.1%) | 5 (4.4%) |
| $75,000 to $99,999 | 6 (27.3%) | 3 (2.6%) |
| $100,000 to $149,999 | 0 (0.0%) | 34 (30.1%) |
| $150,000 or more | 5 (22.7%) | 49 (43.4%) |
| Total | 22 (100.0%) | 113 (100.0%) |
Property Value to Household Income Ratio in Beaver Creek
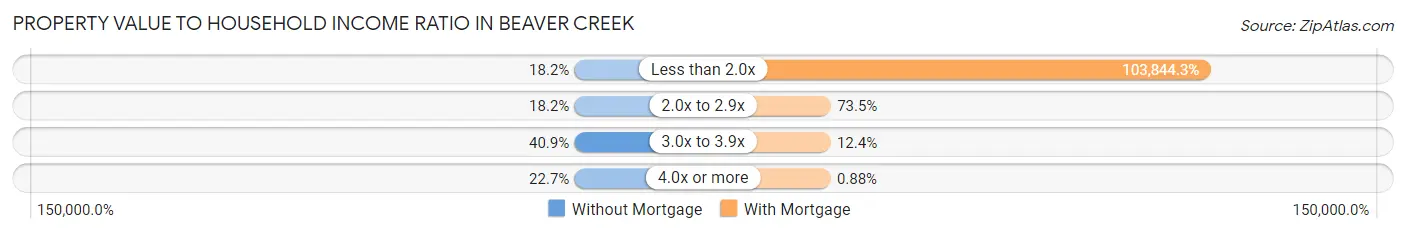
| Value-to-Income Ratio | Without Mortgage | With Mortgage |
| Less than 2.0x | 4 (18.2%) | 117,344 (103,844.3%) |
| 2.0x to 2.9x | 4 (18.2%) | 83 (73.5%) |
| 3.0x to 3.9x | 9 (40.9%) | 14 (12.4%) |
| 4.0x or more | 5 (22.7%) | 1 (0.9%) |
| Total | 22 (100.0%) | 113 (100.0%) |
Real Estate Taxes by Mortgage Status in Beaver Creek
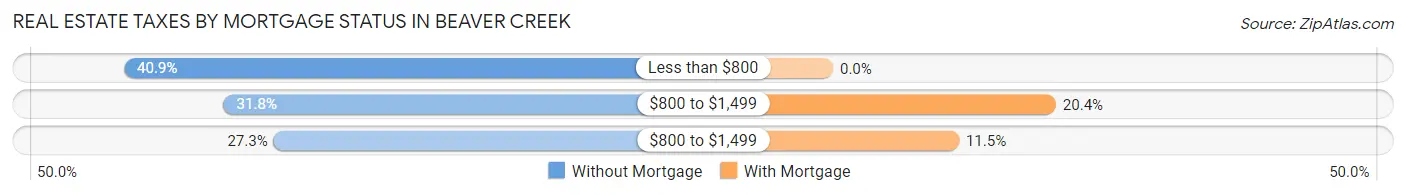
| Property Taxes | Without Mortgage | With Mortgage |
| Less than $800 | 9 (40.9%) | 0 (0.0%) |
| $800 to $1,499 | 7 (31.8%) | 23 (20.3%) |
| $800 to $1,499 | 6 (27.3%) | 13 (11.5%) |
| Total | 22 (100.0%) | 113 (100.0%) |
Health & Disability in Beaver Creek
Health Insurance Coverage by Age in Beaver Creek
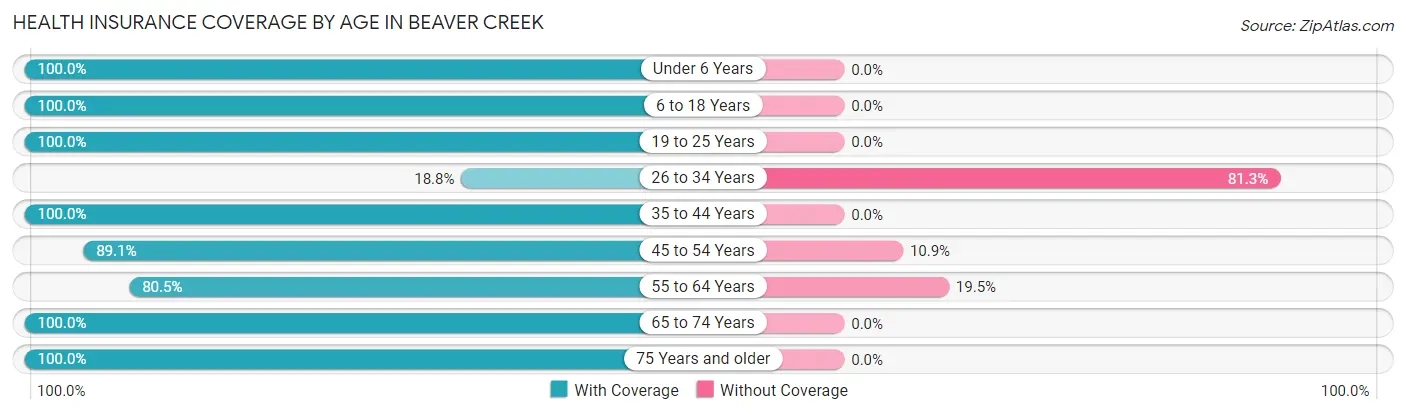
| Age Bracket | With Coverage | Without Coverage |
| Under 6 Years | 55 (100.0%) | 0 (0.0%) |
| 6 to 18 Years | 33 (100.0%) | 0 (0.0%) |
| 19 to 25 Years | 30 (100.0%) | 0 (0.0%) |
| 26 to 34 Years | 6 (18.8%) | 26 (81.2%) |
| 35 to 44 Years | 6 (100.0%) | 0 (0.0%) |
| 45 to 54 Years | 114 (89.1%) | 14 (10.9%) |
| 55 to 64 Years | 66 (80.5%) | 16 (19.5%) |
| 65 to 74 Years | 10 (100.0%) | 0 (0.0%) |
| 75 Years and older | 6 (100.0%) | 0 (0.0%) |
| Total | 326 (85.3%) | 56 (14.7%) |
Health Insurance Coverage by Citizenship Status in Beaver Creek
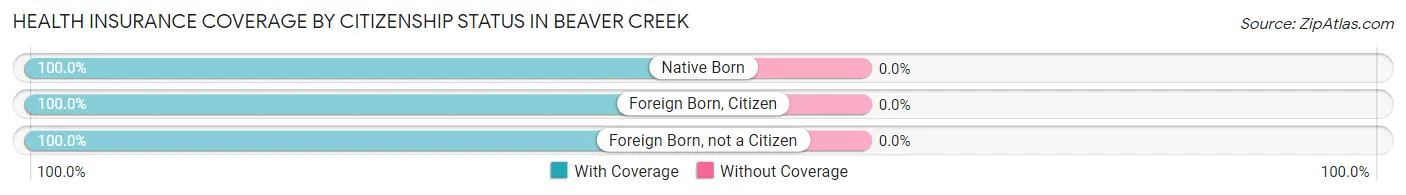
| Citizenship Status | With Coverage | Without Coverage |
| Native Born | 55 (100.0%) | 0 (0.0%) |
| Foreign Born, Citizen | 33 (100.0%) | 0 (0.0%) |
| Foreign Born, not a Citizen | 30 (100.0%) | 0 (0.0%) |
Health Insurance Coverage by Household Income in Beaver Creek
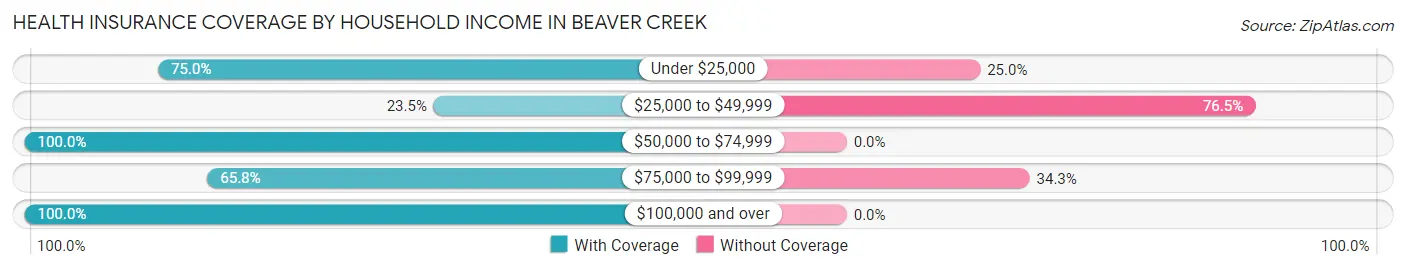
| Household Income | With Coverage | Without Coverage |
| Under $25,000 | 15 (75.0%) | 5 (25.0%) |
| $25,000 to $49,999 | 8 (23.5%) | 26 (76.5%) |
| $50,000 to $74,999 | 6 (100.0%) | 0 (0.0%) |
| $75,000 to $99,999 | 48 (65.7%) | 25 (34.3%) |
| $100,000 and over | 249 (100.0%) | 0 (0.0%) |
Public vs Private Health Insurance Coverage by Age in Beaver Creek
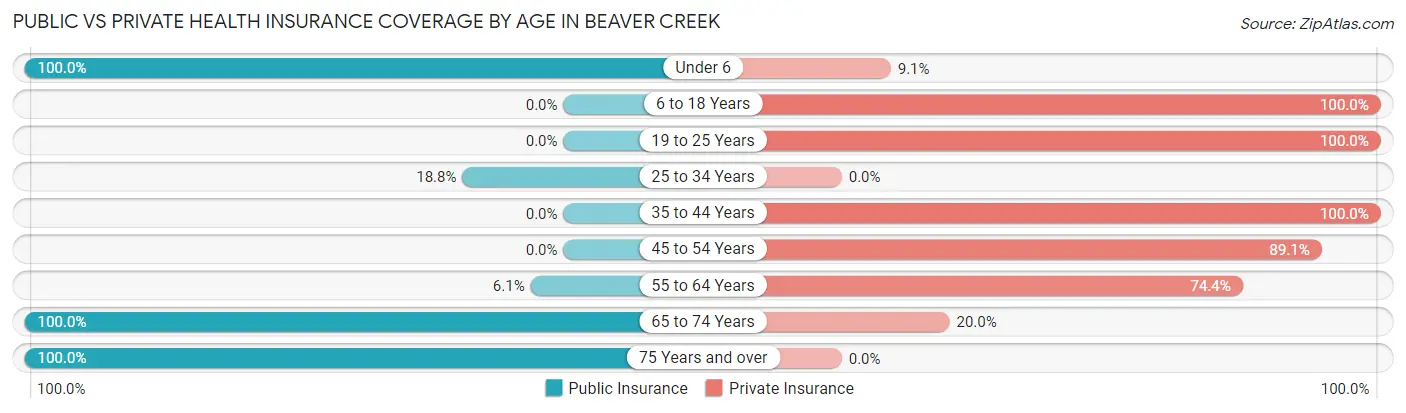
| Age Bracket | Public Insurance | Private Insurance |
| Under 6 | 55 (100.0%) | 5 (9.1%) |
| 6 to 18 Years | 0 (0.0%) | 33 (100.0%) |
| 19 to 25 Years | 0 (0.0%) | 30 (100.0%) |
| 25 to 34 Years | 6 (18.8%) | 0 (0.0%) |
| 35 to 44 Years | 0 (0.0%) | 6 (100.0%) |
| 45 to 54 Years | 0 (0.0%) | 114 (89.1%) |
| 55 to 64 Years | 5 (6.1%) | 61 (74.4%) |
| 65 to 74 Years | 10 (100.0%) | 2 (20.0%) |
| 75 Years and over | 6 (100.0%) | 0 (0.0%) |
| Total | 82 (21.5%) | 251 (65.7%) |
Disability Status by Sex by Age in Beaver Creek
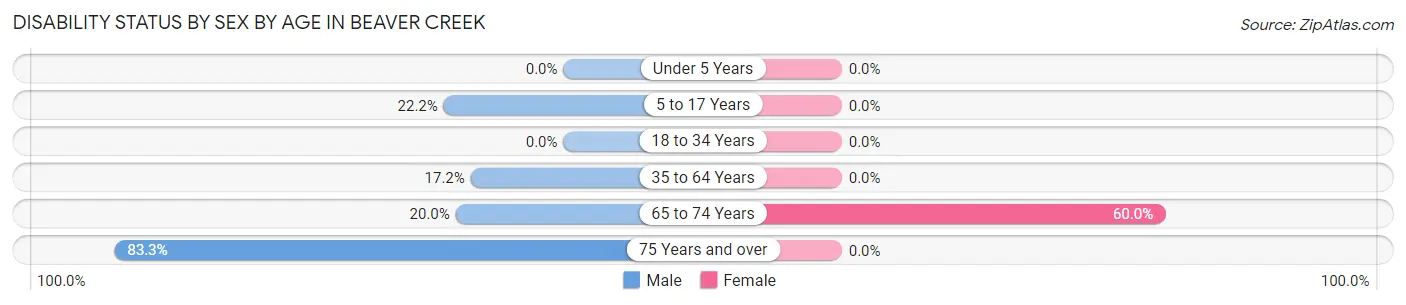
| Age Bracket | Male | Female |
| Under 5 Years | 0 (0.0%) | 0 (0.0%) |
| 5 to 17 Years | 6 (22.2%) | 0 (0.0%) |
| 18 to 34 Years | 0 (0.0%) | 0 (0.0%) |
| 35 to 64 Years | 21 (17.2%) | 0 (0.0%) |
| 65 to 74 Years | 1 (20.0%) | 3 (60.0%) |
| 75 Years and over | 5 (83.3%) | 0 (0.0%) |
Disability Class by Sex by Age in Beaver Creek
Disability Class: Hearing Difficulty
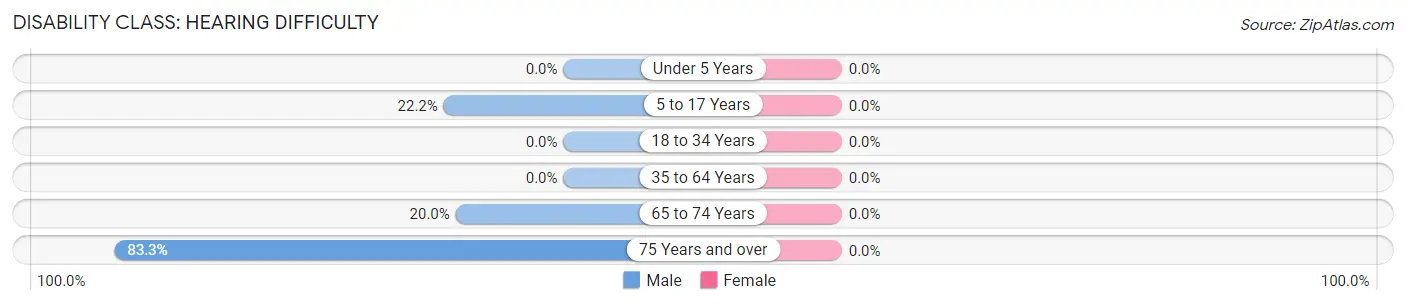
| Age Bracket | Male | Female |
| Under 5 Years | 0 (0.0%) | 0 (0.0%) |
| 5 to 17 Years | 6 (22.2%) | 0 (0.0%) |
| 18 to 34 Years | 0 (0.0%) | 0 (0.0%) |
| 35 to 64 Years | 0 (0.0%) | 0 (0.0%) |
| 65 to 74 Years | 1 (20.0%) | 0 (0.0%) |
| 75 Years and over | 5 (83.3%) | 0 (0.0%) |
Disability Class: Vision Difficulty
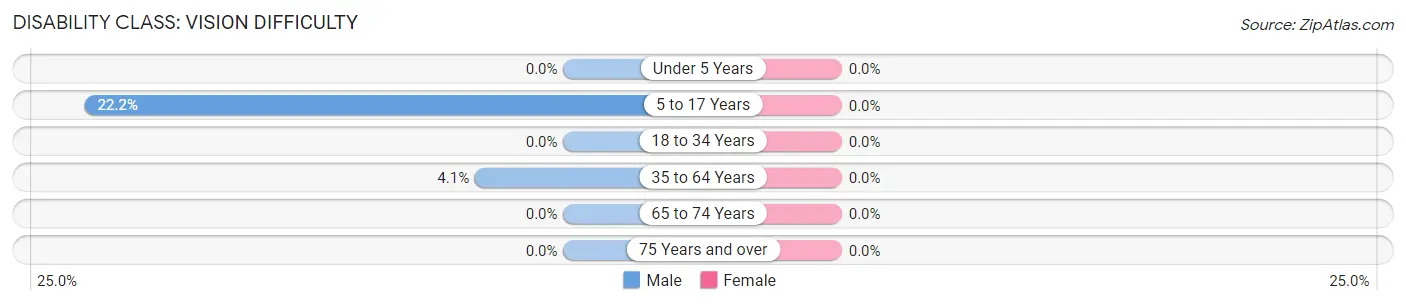
| Age Bracket | Male | Female |
| Under 5 Years | 0 (0.0%) | 0 (0.0%) |
| 5 to 17 Years | 6 (22.2%) | 0 (0.0%) |
| 18 to 34 Years | 0 (0.0%) | 0 (0.0%) |
| 35 to 64 Years | 5 (4.1%) | 0 (0.0%) |
| 65 to 74 Years | 0 (0.0%) | 0 (0.0%) |
| 75 Years and over | 0 (0.0%) | 0 (0.0%) |
Disability Class: Cognitive Difficulty
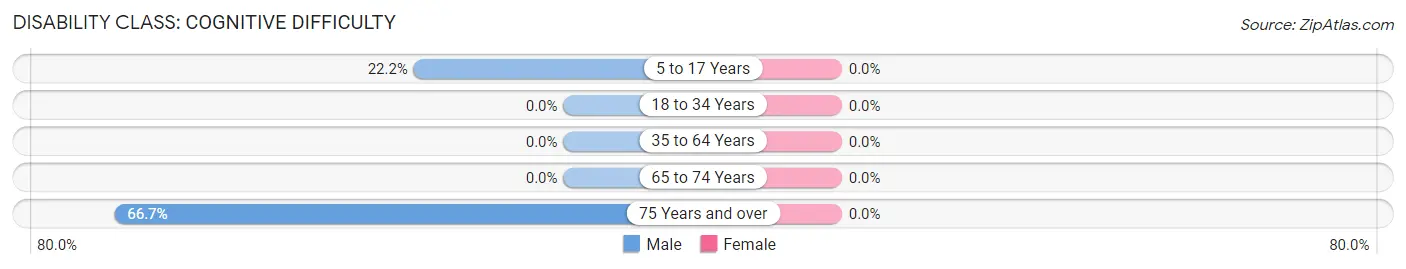
| Age Bracket | Male | Female |
| 5 to 17 Years | 6 (22.2%) | 0 (0.0%) |
| 18 to 34 Years | 0 (0.0%) | 0 (0.0%) |
| 35 to 64 Years | 0 (0.0%) | 0 (0.0%) |
| 65 to 74 Years | 0 (0.0%) | 0 (0.0%) |
| 75 Years and over | 4 (66.7%) | 0 (0.0%) |
Disability Class: Ambulatory Difficulty
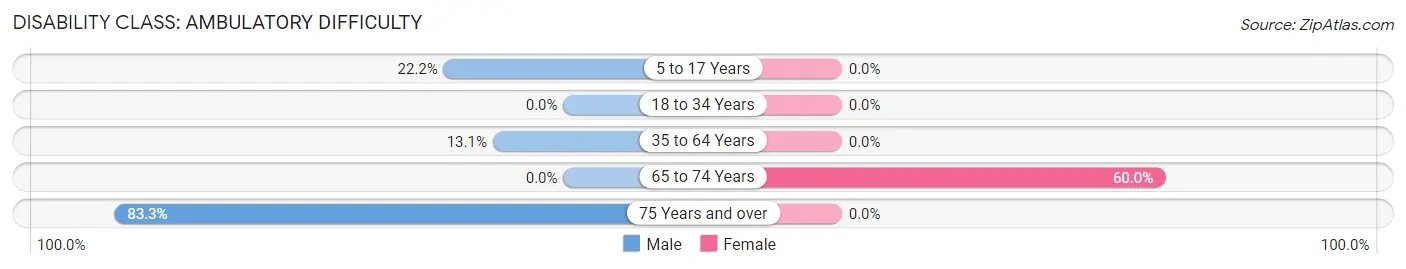
| Age Bracket | Male | Female |
| 5 to 17 Years | 6 (22.2%) | 0 (0.0%) |
| 18 to 34 Years | 0 (0.0%) | 0 (0.0%) |
| 35 to 64 Years | 16 (13.1%) | 0 (0.0%) |
| 65 to 74 Years | 0 (0.0%) | 3 (60.0%) |
| 75 Years and over | 5 (83.3%) | 0 (0.0%) |
Disability Class: Self-Care Difficulty
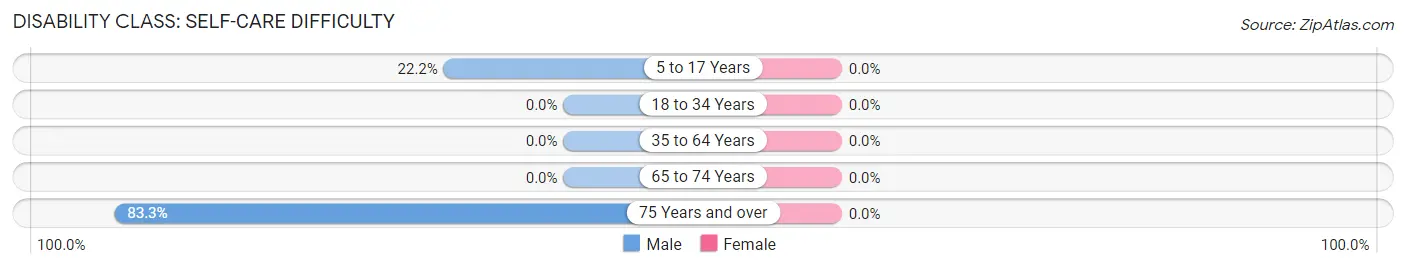
| Age Bracket | Male | Female |
| 5 to 17 Years | 6 (22.2%) | 0 (0.0%) |
| 18 to 34 Years | 0 (0.0%) | 0 (0.0%) |
| 35 to 64 Years | 0 (0.0%) | 0 (0.0%) |
| 65 to 74 Years | 0 (0.0%) | 0 (0.0%) |
| 75 Years and over | 5 (83.3%) | 0 (0.0%) |
Technology Access in Beaver Creek
Computing Device Access in Beaver Creek
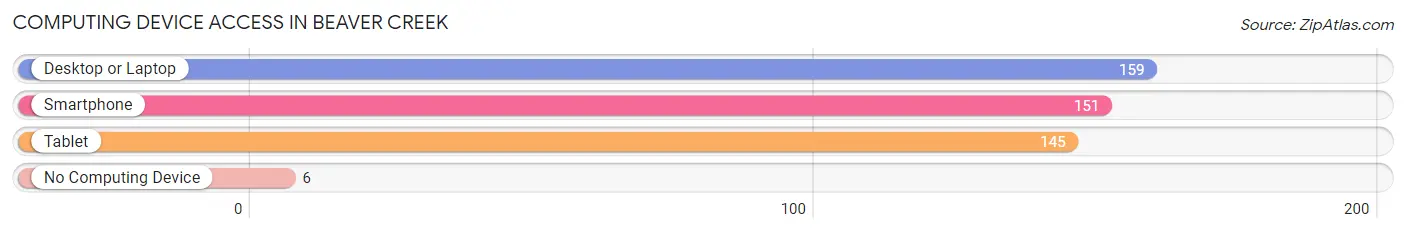
| Device Type | # Households | % Households |
| Desktop or Laptop | 159 | 93.0% |
| Smartphone | 151 | 88.3% |
| Tablet | 145 | 84.8% |
| No Computing Device | 6 | 3.5% |
| Total | 171 | 100.0% |
Internet Access in Beaver Creek
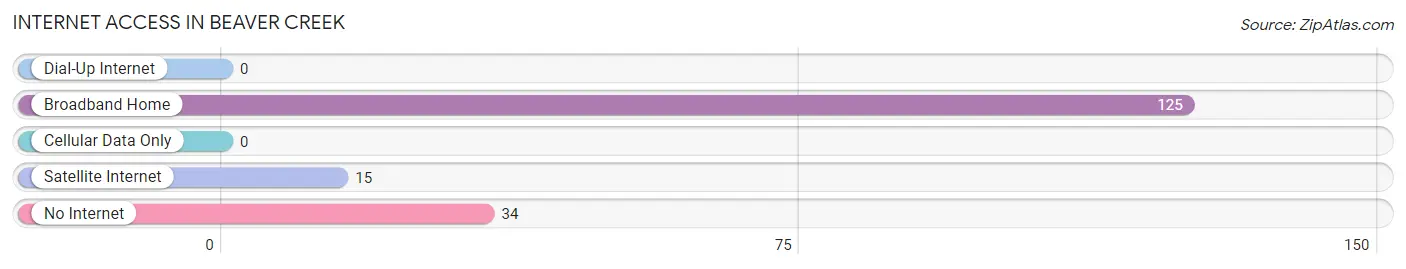
| Internet Type | # Households | % Households |
| Dial-Up Internet | 0 | 0.0% |
| Broadband Home | 125 | 73.1% |
| Cellular Data Only | 0 | 0.0% |
| Satellite Internet | 15 | 8.8% |
| No Internet | 34 | 19.9% |
| Total | 171 | 100.0% |
Beaver Creek Summary
Beaver Creek, Montana is a small unincorporated community located in the western part of the state. It is situated in the Beaverhead-Deerlodge National Forest, and is surrounded by the Beaverhead Mountains. The town is located on the banks of the Beaver Creek, which is a tributary of the Big Hole River. The population of Beaver Creek was estimated to be around 200 people in 2020.
History
Beaver Creek was first settled in the late 1800s by miners and ranchers. The town was originally known as "Beaver Creek Station" and was a stop on the stagecoach line between Butte and Dillon. The town was officially incorporated in 1909 and was named after the creek that runs through it.
The town was a popular destination for miners and ranchers, and it was also a popular stop for travelers. The town was home to a number of businesses, including a hotel, saloon, general store, and post office.
In the early 1900s, the town was a hub for the timber industry. The timber industry was a major source of employment for the town, and it was also a major source of revenue for the town.
Geography
Beaver Creek is located in the western part of Montana, in the Beaverhead-Deerlodge National Forest. The town is situated on the banks of the Beaver Creek, which is a tributary of the Big Hole River. The town is surrounded by the Beaverhead Mountains, which are part of the Rocky Mountains.
The town is located at an elevation of 4,890 feet, and the average annual temperature is around 45 degrees Fahrenheit. The town receives an average of 18 inches of precipitation per year.
Economy
The economy of Beaver Creek is largely based on tourism and recreation. The town is a popular destination for hikers, campers, and hunters. The town is also home to a number of businesses, including a hotel, saloon, general store, and post office.
The town is also home to a number of small businesses, including a gas station, restaurant, and grocery store. The town is also home to a number of small-scale farms and ranches.
Demographics
The population of Beaver Creek was estimated to be around 200 people in 2020. The town is predominantly white, with a small percentage of Native American and Hispanic residents. The median household income in the town is around $35,000, and the median home value is around $150,000. The town has a high rate of poverty, with around 25% of the population living below the poverty line.
Common Questions
What is Per Capita Income in Beaver Creek?
Per Capita income in Beaver Creek is $42,751.
What is the Median Family Income in Beaver Creek?
Median Family Income in Beaver Creek is $135,161.
What is the Median Household income in Beaver Creek?
Median Household Income in Beaver Creek is $91,688.
What is Inequality or Gini Index in Beaver Creek?
Inequality or Gini Index in Beaver Creek is 0.32.
What is the Total Population of Beaver Creek?
Total Population of Beaver Creek is 382.
What is the Total Male Population of Beaver Creek?
Total Male Population of Beaver Creek is 206.
What is the Total Female Population of Beaver Creek?
Total Female Population of Beaver Creek is 176.
What is the Ratio of Males per 100 Females in Beaver Creek?
There are 117.05 Males per 100 Females in Beaver Creek.
What is the Ratio of Females per 100 Males in Beaver Creek?
There are 85.44 Females per 100 Males in Beaver Creek.
What is the Median Population Age in Beaver Creek?
Median Population Age in Beaver Creek is 50.0 Years.
What is the Average Family Size in Beaver Creek
Average Family Size in Beaver Creek is 2.6 People.
What is the Average Household Size in Beaver Creek
Average Household Size in Beaver Creek is 2.2 People.
How Large is the Labor Force in Beaver Creek?
There are 264 People in the Labor Forcein in Beaver Creek.
What is the Percentage of People in the Labor Force in Beaver Creek?
82.8% of People are in the Labor Force in Beaver Creek.
What is the Unemployment Rate in Beaver Creek?
Unemployment Rate in Beaver Creek is 0.8%.