Zip Codes with the Highest Percentage of Households Without a Vehicle in Columbus, MS
RELATED REPORTS & OPTIONS
Households without a Cars
Columbus
Compare Zip Codes
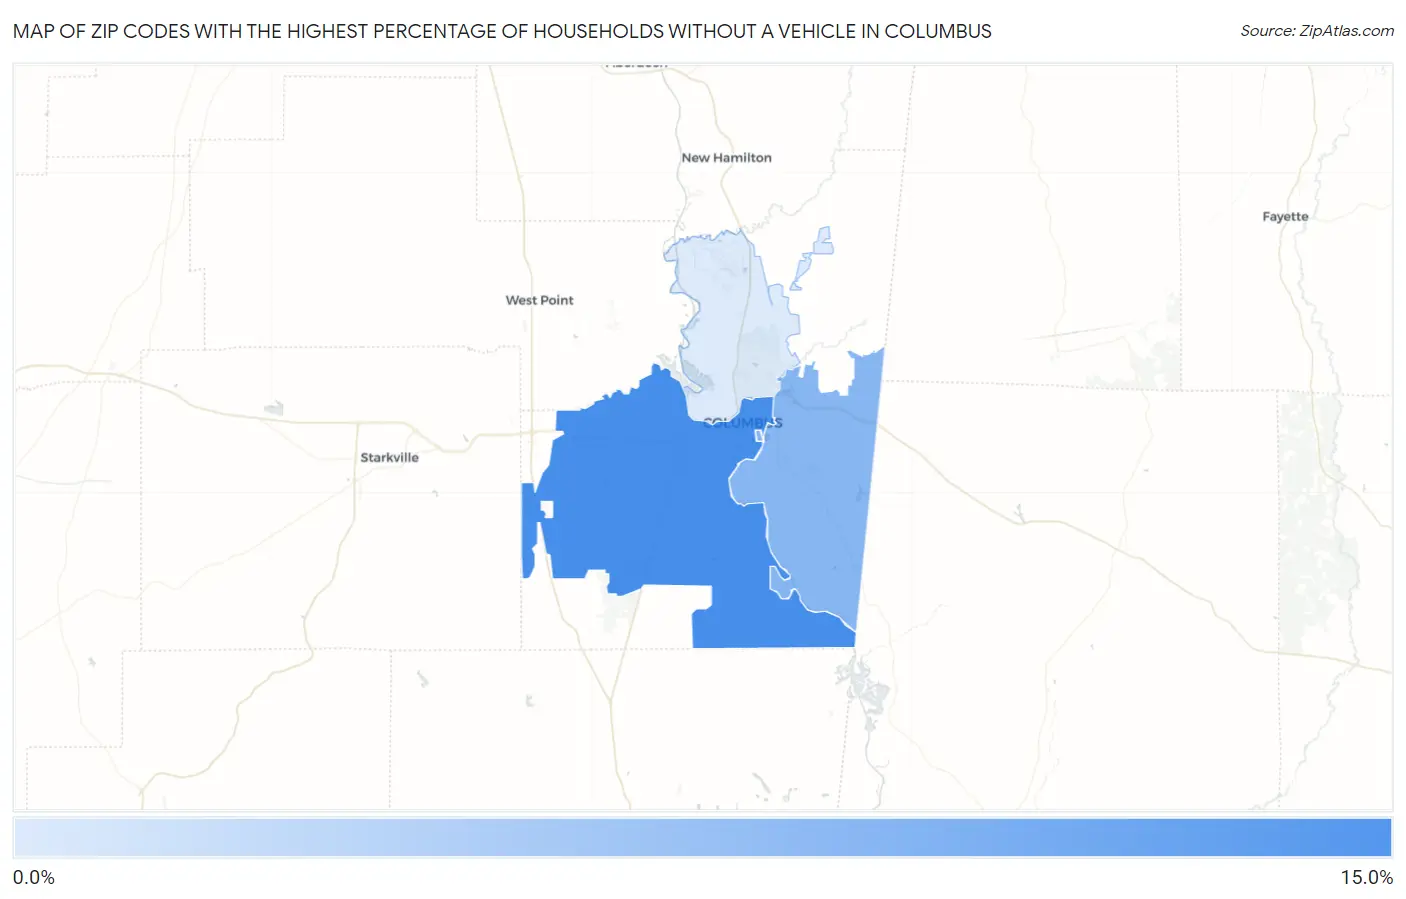
Map of Zip Codes with the Highest Percentage of Households Without a Vehicle in Columbus
2.3%
12.1%
Zip Codes with the Highest Percentage of Households Without a Vehicle in Columbus, MS
| Zip Code | Housholds Without a Car | vs State | vs National | |
| 1. | 39701 | 12.1% | 6.1%(+6.00)#51 | 8.3%(+3.80)#3,517 |
| 2. | 39702 | 7.7% | 6.1%(+1.60)#130 | 8.3%(-0.600)#7,393 |
| 3. | 39705 | 2.3% | 6.1%(-3.80)#308 | 8.3%(-6.00)#21,433 |
1
Common Questions
What are the Top Zip Codes with the Highest Percentage of Households Without a Vehicle in Columbus, MS?
Top Zip Codes with the Highest Percentage of Households Without a Vehicle in Columbus, MS are:
What zip code has the Highest Percentage of Households Without a Vehicle in Columbus, MS?
39701 has the Highest Percentage of Households Without a Vehicle in Columbus, MS with 12.1%.
What is the Percentage of Households Without a Vehicle in Columbus, MS?
Percentage of Households Without a Vehicle in Columbus is 11.1%.
What is the Percentage of Households Without a Vehicle in Mississippi?
Percentage of Households Without a Vehicle in Mississippi is 6.1%.
What is the Percentage of Households Without a Vehicle in the United States?
Percentage of Households Without a Vehicle in the United States is 8.3%.