Zip Codes with the Highest Percentage of Households Without a Vehicle in Laurel, MS
RELATED REPORTS & OPTIONS
Households without a Cars
Laurel
Compare Zip Codes
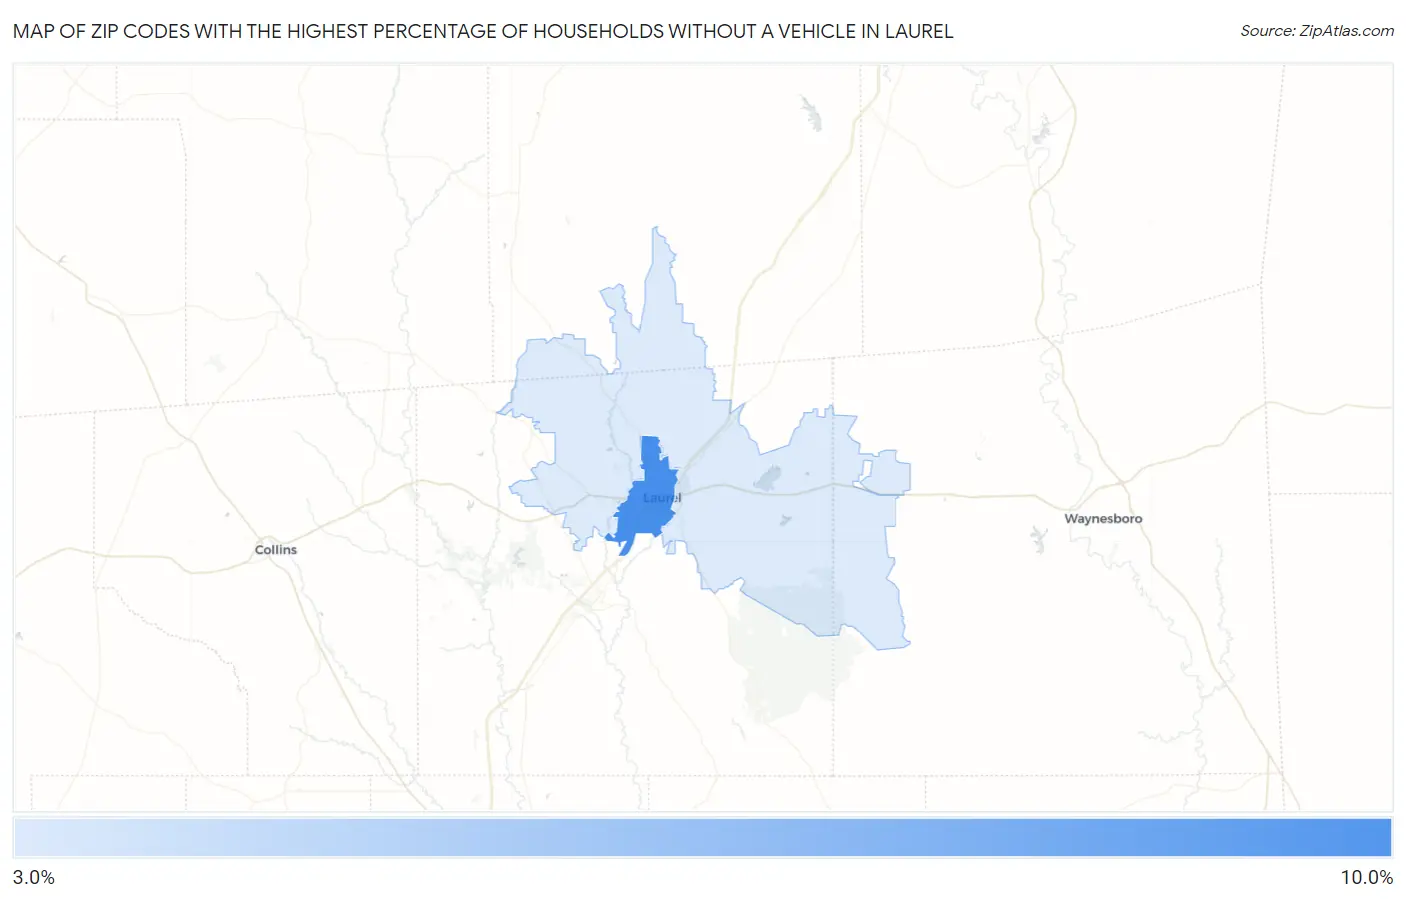
Map of Zip Codes with the Highest Percentage of Households Without a Vehicle in Laurel
3.6%
8.6%
Zip Codes with the Highest Percentage of Households Without a Vehicle in Laurel, MS
| Zip Code | Housholds Without a Car | vs State | vs National | |
| 1. | 39440 | 8.6% | 6.1%(+2.50)#108 | 8.3%(+0.300)#6,195 |
| 2. | 39443 | 3.6% | 6.1%(-2.50)#268 | 8.3%(-4.70)#17,036 |
1
Common Questions
What are the Top Zip Codes with the Highest Percentage of Households Without a Vehicle in Laurel, MS?
Top Zip Codes with the Highest Percentage of Households Without a Vehicle in Laurel, MS are:
What zip code has the Highest Percentage of Households Without a Vehicle in Laurel, MS?
39440 has the Highest Percentage of Households Without a Vehicle in Laurel, MS with 8.6%.
What is the Percentage of Households Without a Vehicle in Laurel, MS?
Percentage of Households Without a Vehicle in Laurel is 10.2%.
What is the Percentage of Households Without a Vehicle in Mississippi?
Percentage of Households Without a Vehicle in Mississippi is 6.1%.
What is the Percentage of Households Without a Vehicle in the United States?
Percentage of Households Without a Vehicle in the United States is 8.3%.