Zip Codes with the Highest Percentage of Households Without a Vehicle in Southaven, MS
RELATED REPORTS & OPTIONS
Households without a Cars
Southaven
Compare Zip Codes
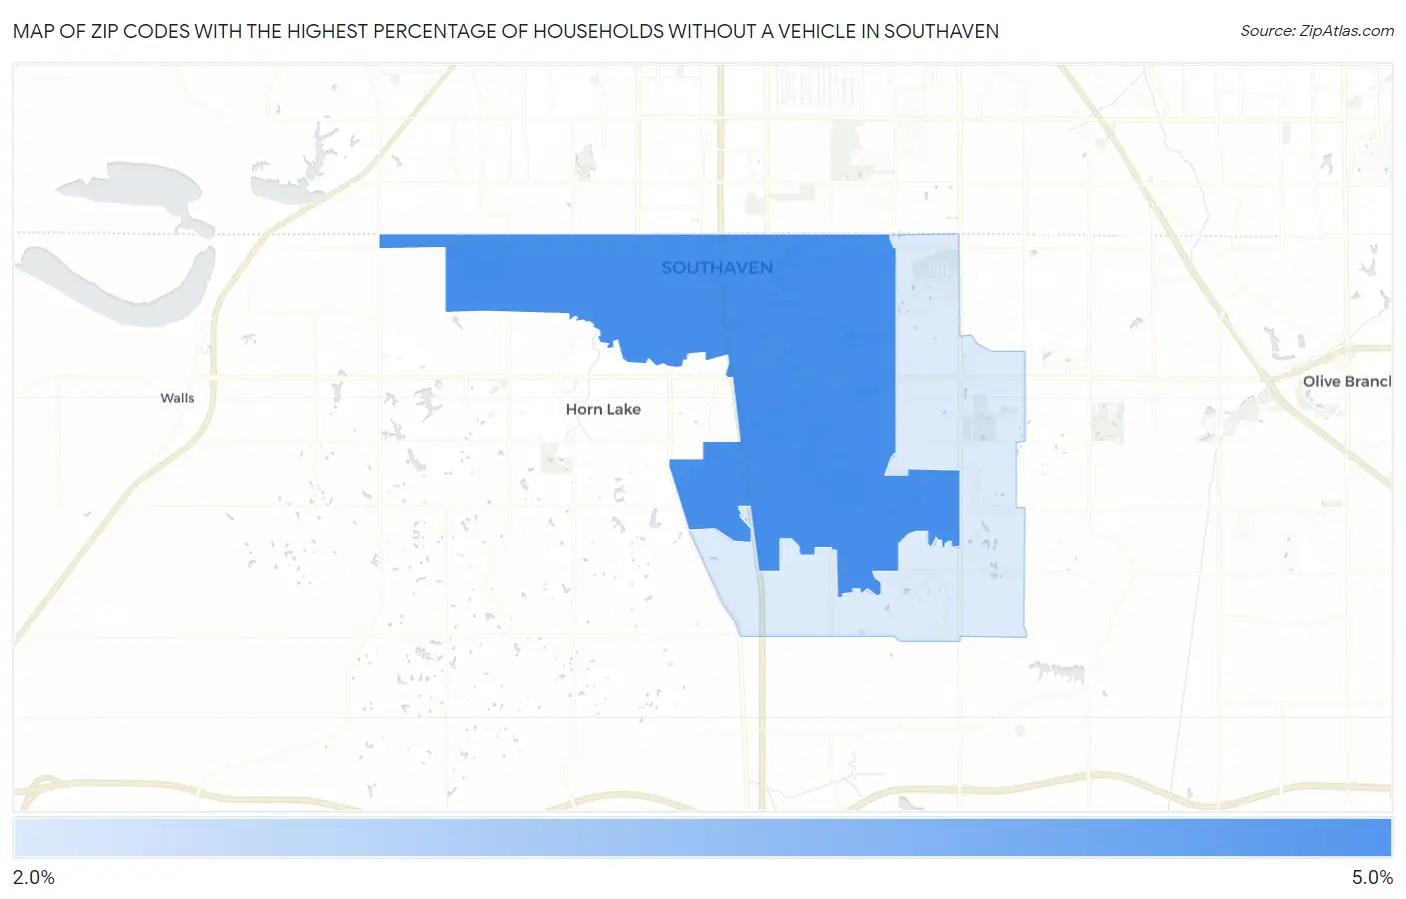
Map of Zip Codes with the Highest Percentage of Households Without a Vehicle in Southaven
2.7%
4.6%
Zip Codes with the Highest Percentage of Households Without a Vehicle in Southaven, MS
| Zip Code | Housholds Without a Car | vs State | vs National | |
| 1. | 38671 | 4.6% | 6.1%(-1.50)#233 | 8.3%(-3.70)#13,906 |
| 2. | 38672 | 2.7% | 6.1%(-3.40)#292 | 8.3%(-5.60)#20,133 |
1
Common Questions
What are the Top Zip Codes with the Highest Percentage of Households Without a Vehicle in Southaven, MS?
Top Zip Codes with the Highest Percentage of Households Without a Vehicle in Southaven, MS are:
What zip code has the Highest Percentage of Households Without a Vehicle in Southaven, MS?
38671 has the Highest Percentage of Households Without a Vehicle in Southaven, MS with 4.6%.
What is the Percentage of Households Without a Vehicle in Southaven, MS?
Percentage of Households Without a Vehicle in Southaven is 3.9%.
What is the Percentage of Households Without a Vehicle in Mississippi?
Percentage of Households Without a Vehicle in Mississippi is 6.1%.
What is the Percentage of Households Without a Vehicle in the United States?
Percentage of Households Without a Vehicle in the United States is 8.3%.