Zip Codes with the Highest Percentage of Households Without a Vehicle in Moss Point, MS
RELATED REPORTS & OPTIONS
Households without a Cars
Moss Point
Compare Zip Codes
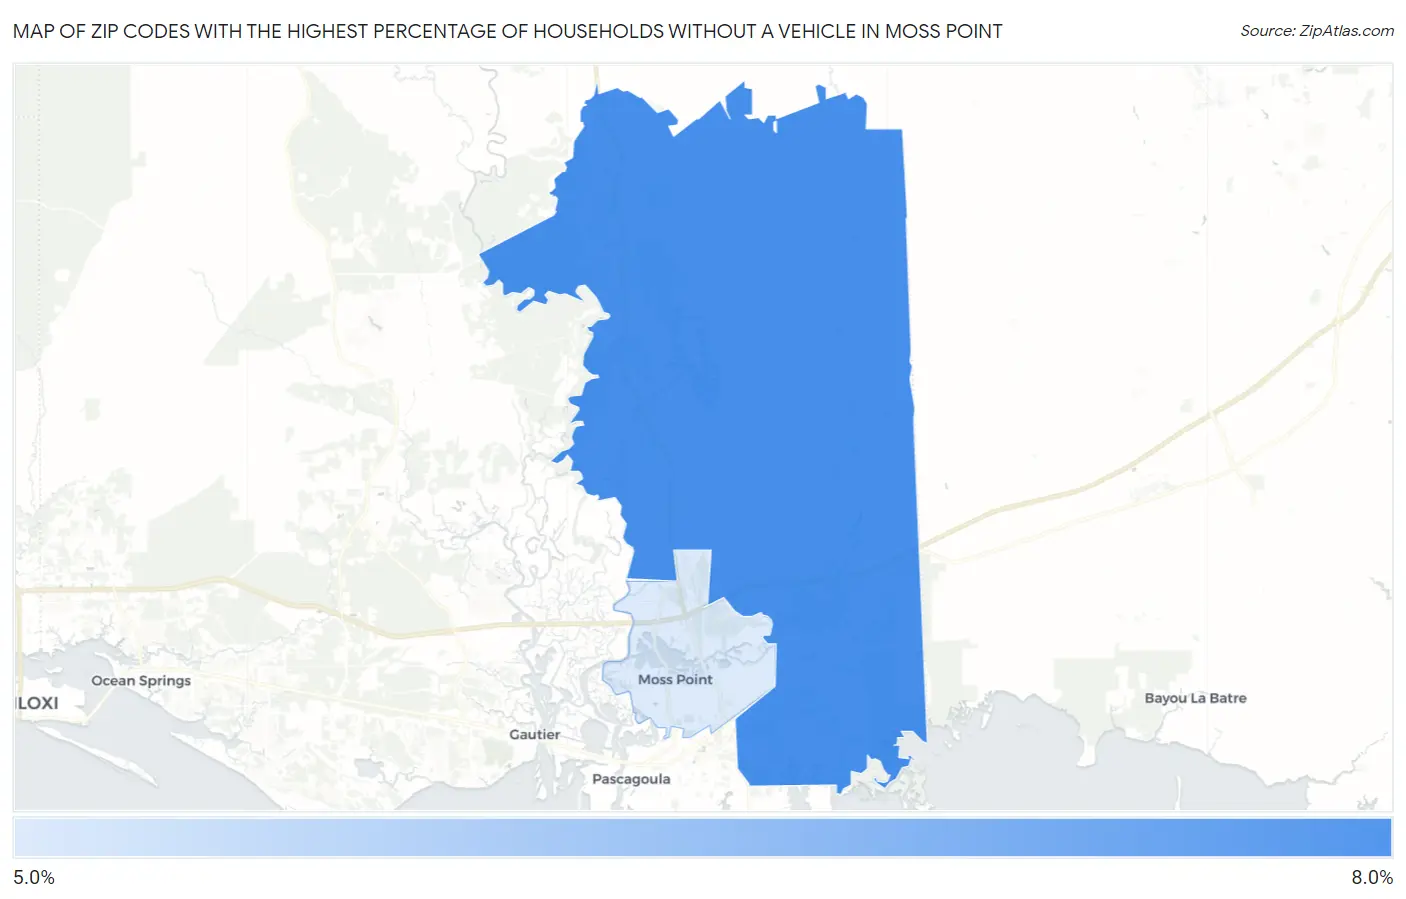
Map of Zip Codes with the Highest Percentage of Households Without a Vehicle in Moss Point
5.2%
6.3%
Zip Codes with the Highest Percentage of Households Without a Vehicle in Moss Point, MS
| Zip Code | Housholds Without a Car | vs State | vs National | |
| 1. | 39562 | 6.3% | 6.1%(+0.200)#172 | 8.3%(-2.00)#9,826 |
| 2. | 39563 | 5.2% | 6.1%(-0.900)#208 | 8.3%(-3.10)#12,401 |
1
Common Questions
What are the Top Zip Codes with the Highest Percentage of Households Without a Vehicle in Moss Point, MS?
Top Zip Codes with the Highest Percentage of Households Without a Vehicle in Moss Point, MS are:
What zip code has the Highest Percentage of Households Without a Vehicle in Moss Point, MS?
39562 has the Highest Percentage of Households Without a Vehicle in Moss Point, MS with 6.3%.
What is the Percentage of Households Without a Vehicle in Moss Point, MS?
Percentage of Households Without a Vehicle in Moss Point is 5.4%.
What is the Percentage of Households Without a Vehicle in Mississippi?
Percentage of Households Without a Vehicle in Mississippi is 6.1%.
What is the Percentage of Households Without a Vehicle in the United States?
Percentage of Households Without a Vehicle in the United States is 8.3%.