Russell Springs, KS Map & Demographics
Russell Springs Map
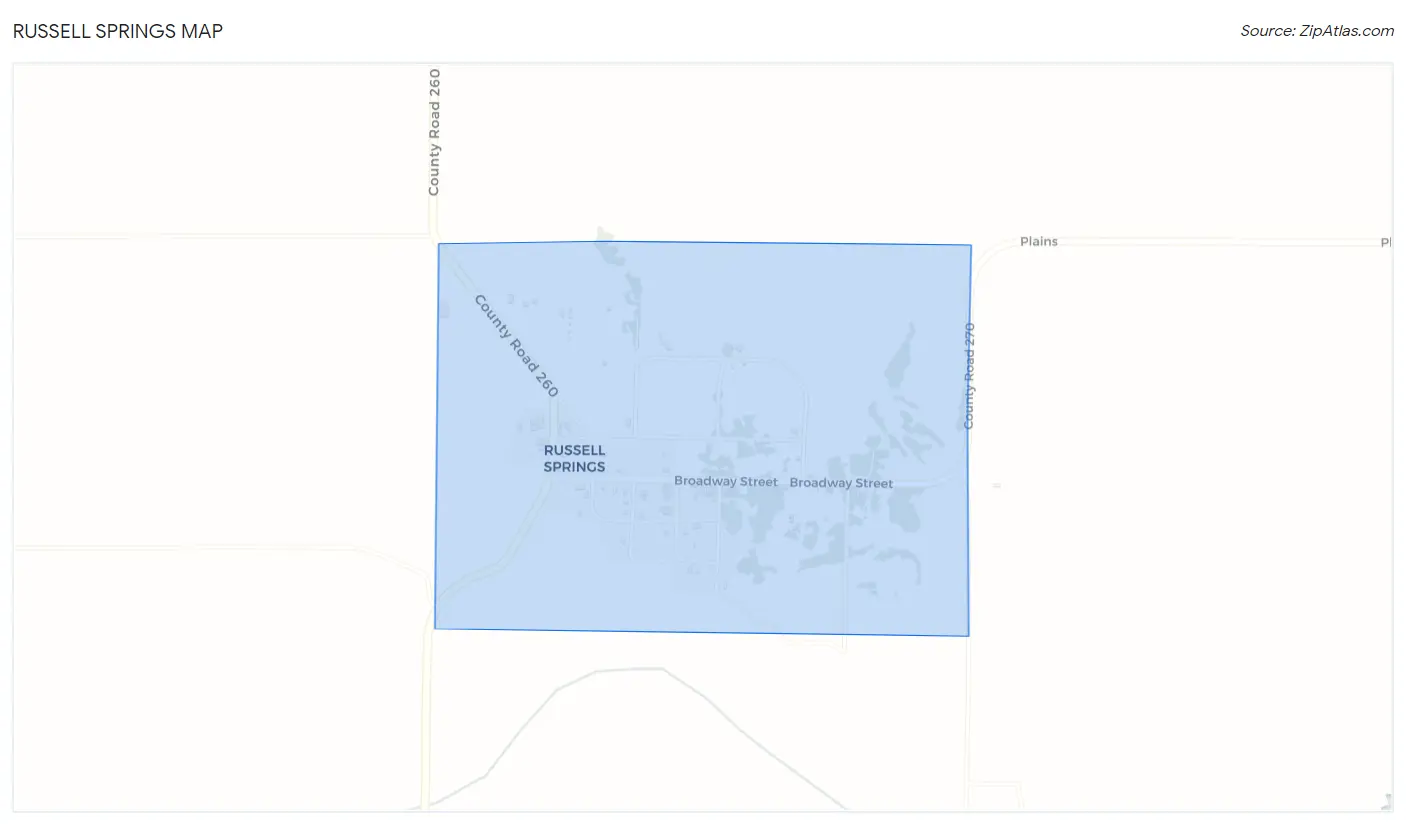
Russell Springs Overview
$65,254
PER CAPITA INCOME
$71,250
AVG FAMILY INCOME
$61,250
AVG HOUSEHOLD INCOME
0.52
INEQUALITY / GINI INDEX
28
TOTAL POPULATION
13
MALE POPULATION
15
FEMALE POPULATION
86.67
MALES / 100 FEMALES
115.38
FEMALES / 100 MALES
63.0
MEDIAN AGE
2.0
AVG FAMILY SIZE
1.5
AVG HOUSEHOLD SIZE
13
LABOR FORCE [ PEOPLE ]
52.0%
PERCENT IN LABOR FORCE
Russell Springs Area Codes
Income in Russell Springs
Income Overview in Russell Springs
Per Capita Income in Russell Springs is $65,254, while median incomes of families and households are $71,250 and $61,250 respectively.
| Characteristic | Number | Measure |
| Per Capita Income | 28 | $65,254 |
| Median Family Income | 8 | $71,250 |
| Mean Family Income | 8 | $71,263 |
| Median Household Income | 19 | $61,250 |
| Mean Household Income | 19 | $102,947 |
| Income Deficit | 8 | $0 |
| Wage / Income Gap (%) | 28 | 0.00% |
| Wage / Income Gap ($) | 28 | 100.00¢ per $1 |
| Gini / Inequality Index | 28 | 0.52 |
Earnings by Sex in Russell Springs
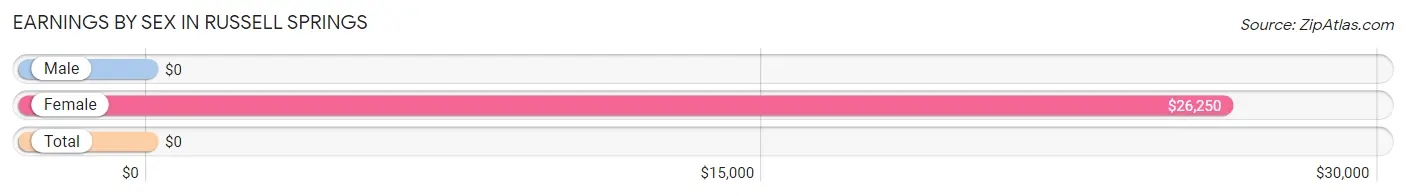
| Sex | Number | Average Earnings |
| Male | 11 (73.3%) | $0 |
| Female | 4 (26.7%) | $26,250 |
| Total | 15 (100.0%) | $0 |
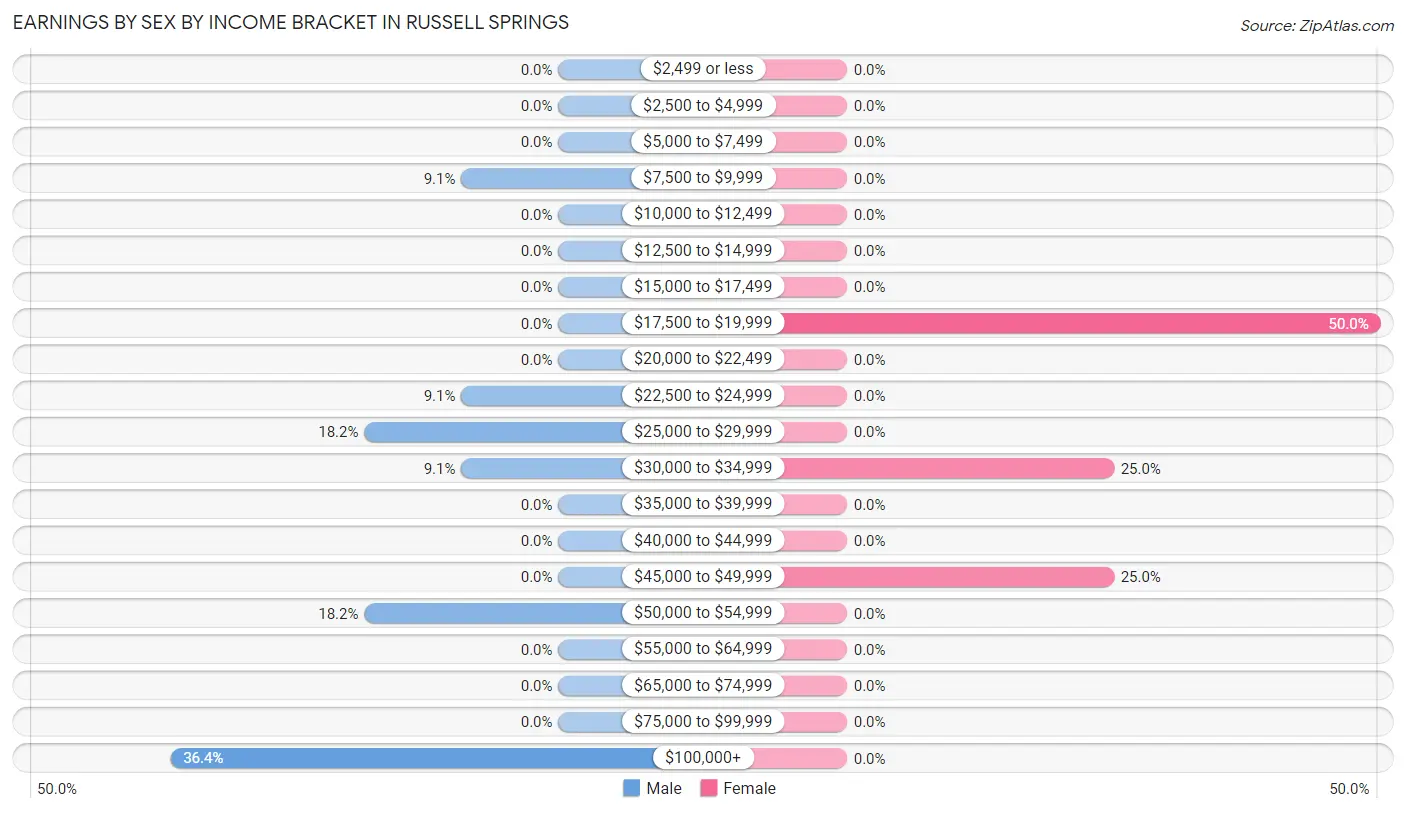
Earnings by Sex by Income Bracket in Russell Springs
The most common earnings brackets in Russell Springs are $100,000+ for men (4 | 36.4%) and $17,500 to $19,999 for women (2 | 50.0%).
| Income | Male | Female |
| $2,499 or less | 0 (0.0%) | 0 (0.0%) |
| $2,500 to $4,999 | 0 (0.0%) | 0 (0.0%) |
| $5,000 to $7,499 | 0 (0.0%) | 0 (0.0%) |
| $7,500 to $9,999 | 1 (9.1%) | 0 (0.0%) |
| $10,000 to $12,499 | 0 (0.0%) | 0 (0.0%) |
| $12,500 to $14,999 | 0 (0.0%) | 0 (0.0%) |
| $15,000 to $17,499 | 0 (0.0%) | 0 (0.0%) |
| $17,500 to $19,999 | 0 (0.0%) | 2 (50.0%) |
| $20,000 to $22,499 | 0 (0.0%) | 0 (0.0%) |
| $22,500 to $24,999 | 1 (9.1%) | 0 (0.0%) |
| $25,000 to $29,999 | 2 (18.2%) | 0 (0.0%) |
| $30,000 to $34,999 | 1 (9.1%) | 1 (25.0%) |
| $35,000 to $39,999 | 0 (0.0%) | 0 (0.0%) |
| $40,000 to $44,999 | 0 (0.0%) | 0 (0.0%) |
| $45,000 to $49,999 | 0 (0.0%) | 1 (25.0%) |
| $50,000 to $54,999 | 2 (18.2%) | 0 (0.0%) |
| $55,000 to $64,999 | 0 (0.0%) | 0 (0.0%) |
| $65,000 to $74,999 | 0 (0.0%) | 0 (0.0%) |
| $75,000 to $99,999 | 0 (0.0%) | 0 (0.0%) |
| $100,000+ | 4 (36.4%) | 0 (0.0%) |
| Total | 11 (100.0%) | 4 (100.0%) |
Earnings by Sex by Educational Attainment in Russell Springs
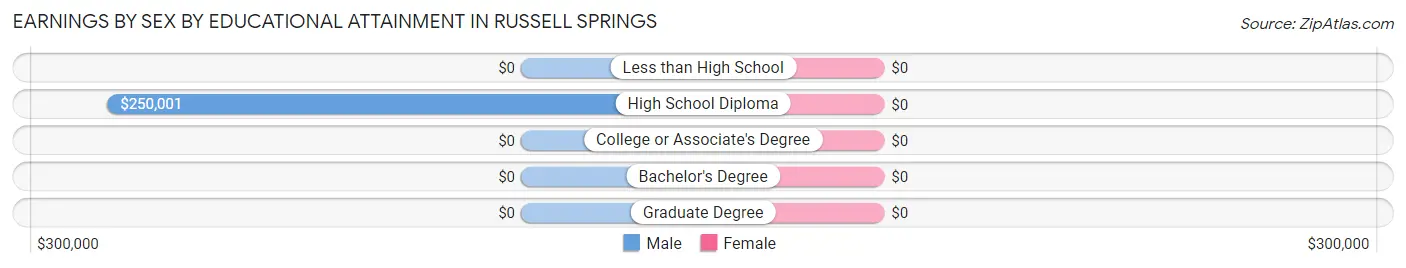
| Educational Attainment | Male Income | Female Income |
| Less than High School | - | - |
| High School Diploma | $250,001 | $0 |
| College or Associate's Degree | - | - |
| Bachelor's Degree | - | - |
| Graduate Degree | - | - |
| Total | - | - |
Family Income in Russell Springs
Family Income Brackets in Russell Springs
According to the Russell Springs family income data, there are 3 families falling into the $75,000 to $99,999 income range, which is the most common income bracket and makes up 37.5% of all families.
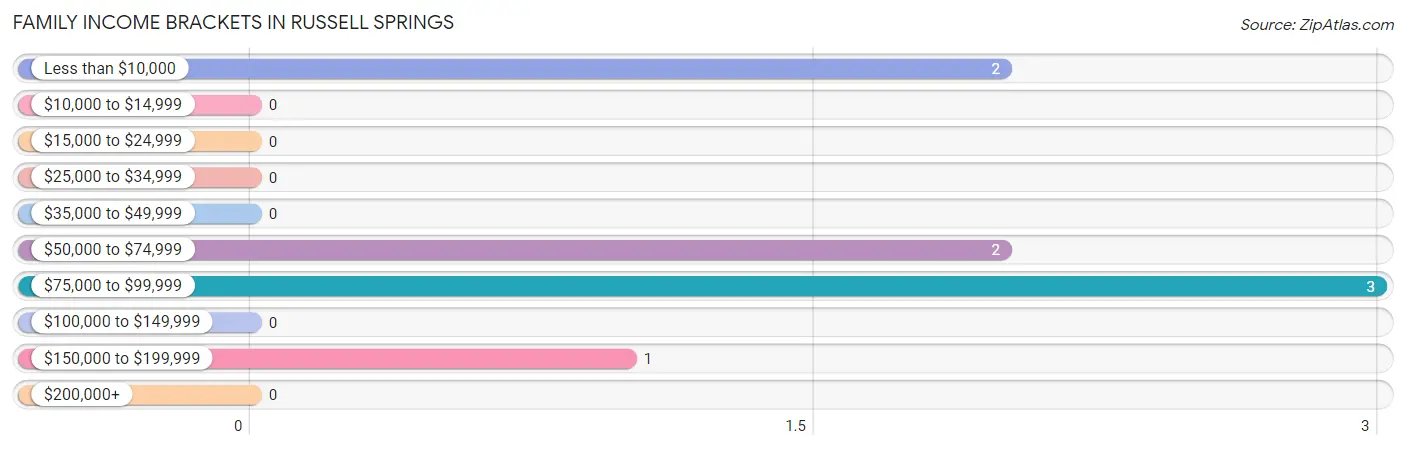
| Income Bracket | # Families | % Families |
| Less than $10,000 | 2 | 25.0% |
| $10,000 to $14,999 | 0 | 0.0% |
| $15,000 to $24,999 | 0 | 0.0% |
| $25,000 to $34,999 | 0 | 0.0% |
| $35,000 to $49,999 | 0 | 0.0% |
| $50,000 to $74,999 | 2 | 25.0% |
| $75,000 to $99,999 | 3 | 37.5% |
| $100,000 to $149,999 | 0 | 0.0% |
| $150,000 to $199,999 | 1 | 12.5% |
| $200,000+ | 0 | 0.0% |
Family Income by Famaliy Size in Russell Springs
| Income Bracket | # Families | Median Income |
| 2-Person Families | 3 (37.5%) | $0 |
| 3-Person Families | 3 (37.5%) | $0 |
| 4-Person Families | 2 (25.0%) | $0 |
| 5-Person Families | 0 (0.0%) | $0 |
| 6-Person Families | 0 (0.0%) | $0 |
| 7+ Person Families | 0 (0.0%) | $0 |
| Total | 8 (100.0%) | $71,250 |
Family Income by Number of Earners in Russell Springs
| Number of Earners | # Families | Median Income |
| No Earners | 3 (37.5%) | $0 |
| 1 Earner | 2 (25.0%) | $0 |
| 2 Earners | 3 (37.5%) | $0 |
| 3+ Earners | 0 (0.0%) | $0 |
| Total | 8 (100.0%) | $71,250 |
Household Income in Russell Springs
Household Income Brackets in Russell Springs
With 7 households falling in the category, the $50,000 to $74,999 income range is the most frequent in Russell Springs, accounting for 36.8% of all households.
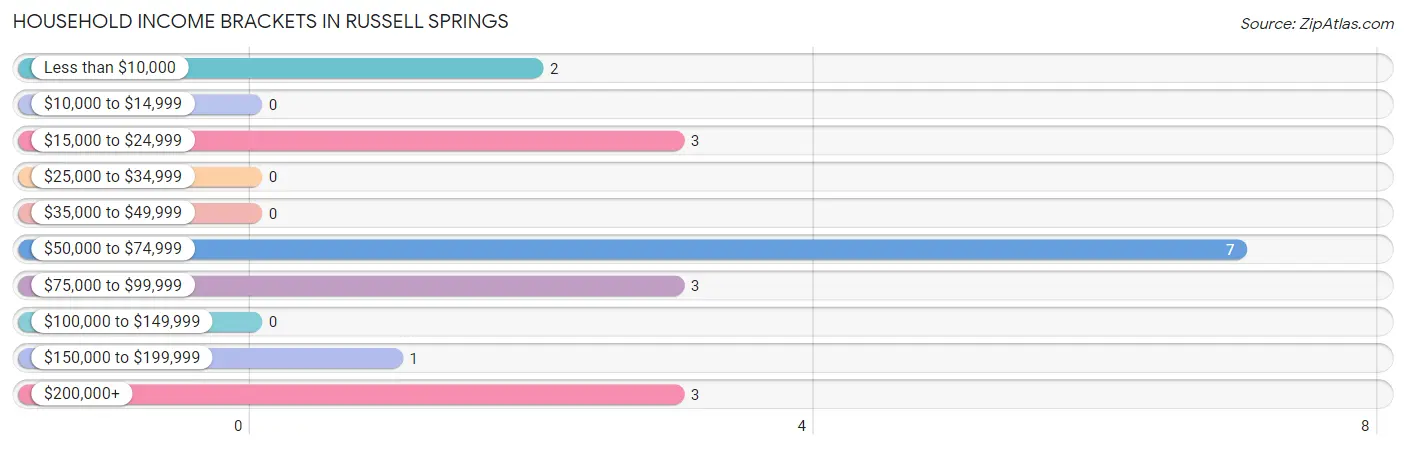
| Income Bracket | # Households | % Households |
| Less than $10,000 | 2 | 10.5% |
| $10,000 to $14,999 | 0 | 0.0% |
| $15,000 to $24,999 | 3 | 15.8% |
| $25,000 to $34,999 | 0 | 0.0% |
| $35,000 to $49,999 | 0 | 0.0% |
| $50,000 to $74,999 | 7 | 36.8% |
| $75,000 to $99,999 | 3 | 15.8% |
| $100,000 to $149,999 | 0 | 0.0% |
| $150,000 to $199,999 | 1 | 5.3% |
| $200,000+ | 3 | 15.8% |
Household Income by Householder Age in Russell Springs
The median household income in Russell Springs is $61,250, with the highest median household income of $77,917 found in the 65+ years age bracket for the primary householder. A total of 5 households (26.3%) fall into this category.
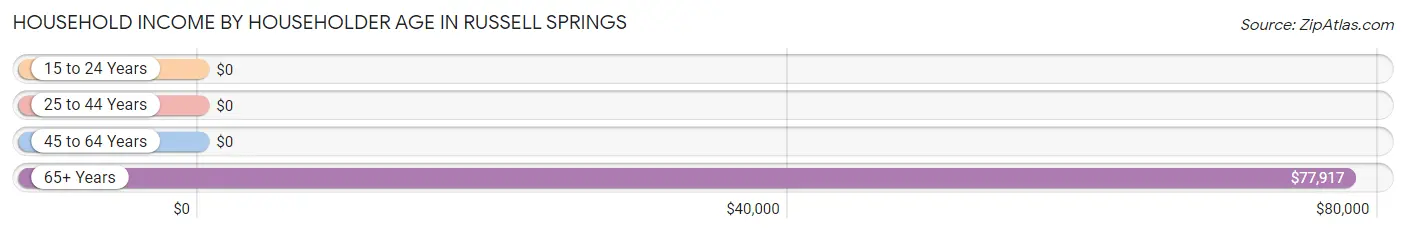
| Income Bracket | # Households | Median Income |
| 15 to 24 Years | 0 (0.0%) | $0 |
| 25 to 44 Years | 2 (10.5%) | $0 |
| 45 to 64 Years | 12 (63.2%) | $0 |
| 65+ Years | 5 (26.3%) | $77,917 |
| Total | 19 (100.0%) | $61,250 |
Poverty in Russell Springs
Income Below Poverty by Sex and Age in Russell Springs
With 7.7% poverty level for males and 13.3% for females among the residents of Russell Springs, 65 to 74 year old males and 55 to 64 year old females are the most vulnerable to poverty, with 1 males (33.3%) and 2 females (28.6%) in their respective age groups living below the poverty level.
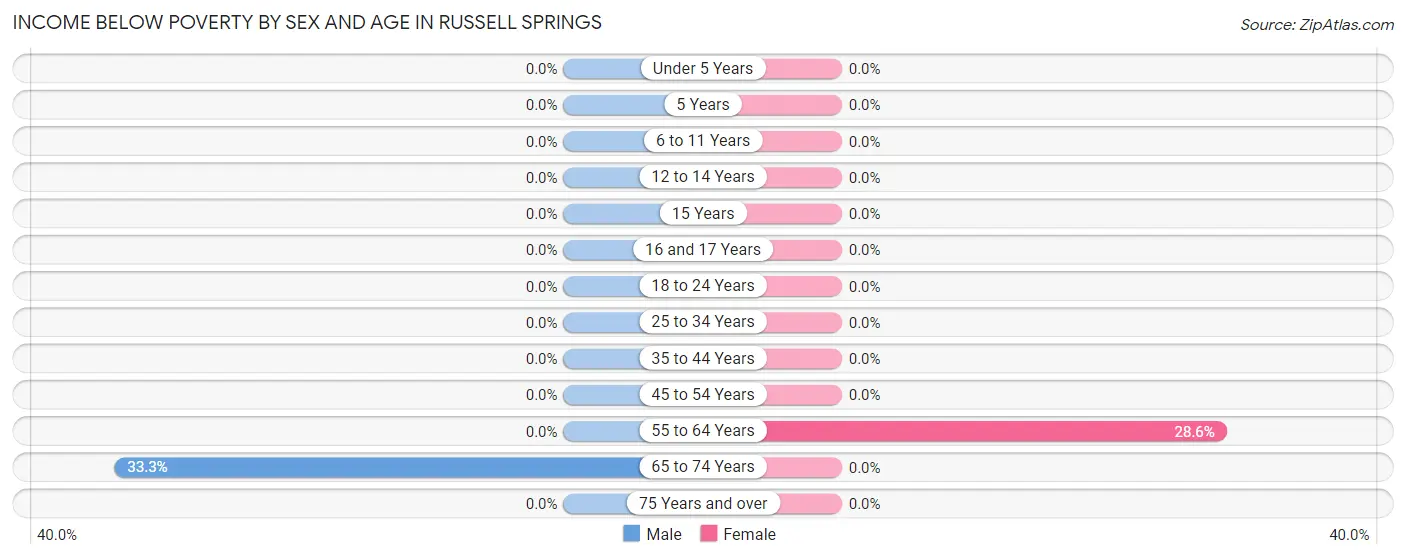
| Age Bracket | Male | Female |
| Under 5 Years | 0 (0.0%) | 0 (0.0%) |
| 5 Years | 0 (0.0%) | 0 (0.0%) |
| 6 to 11 Years | 0 (0.0%) | 0 (0.0%) |
| 12 to 14 Years | 0 (0.0%) | 0 (0.0%) |
| 15 Years | 0 (0.0%) | 0 (0.0%) |
| 16 and 17 Years | 0 (0.0%) | 0 (0.0%) |
| 18 to 24 Years | 0 (0.0%) | 0 (0.0%) |
| 25 to 34 Years | 0 (0.0%) | 0 (0.0%) |
| 35 to 44 Years | 0 (0.0%) | 0 (0.0%) |
| 45 to 54 Years | 0 (0.0%) | 0 (0.0%) |
| 55 to 64 Years | 0 (0.0%) | 2 (28.6%) |
| 65 to 74 Years | 1 (33.3%) | 0 (0.0%) |
| 75 Years and over | 0 (0.0%) | 0 (0.0%) |
| Total | 1 (7.7%) | 2 (13.3%) |
Income Above Poverty by Sex and Age in Russell Springs
According to the poverty statistics in Russell Springs, males aged 15 years and females aged 6 to 11 years are the age groups that are most secure financially, with 100.0% of males and 100.0% of females in these age groups living above the poverty line.
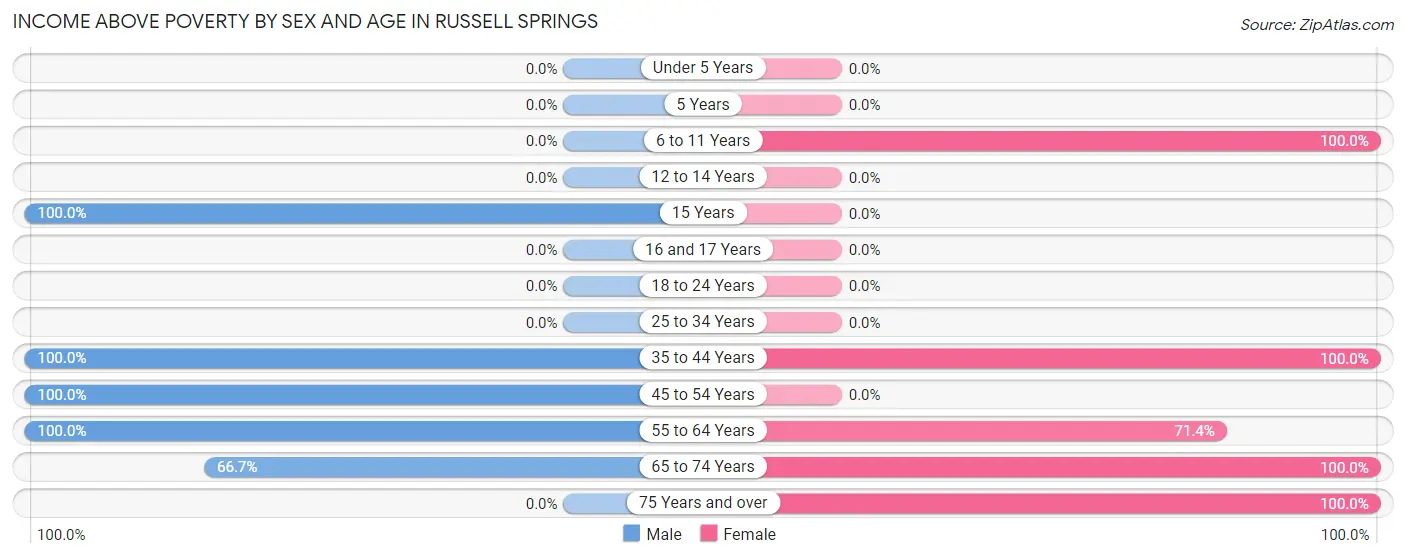
| Age Bracket | Male | Female |
| Under 5 Years | 0 (0.0%) | 0 (0.0%) |
| 5 Years | 0 (0.0%) | 0 (0.0%) |
| 6 to 11 Years | 0 (0.0%) | 2 (100.0%) |
| 12 to 14 Years | 0 (0.0%) | 0 (0.0%) |
| 15 Years | 1 (100.0%) | 0 (0.0%) |
| 16 and 17 Years | 0 (0.0%) | 0 (0.0%) |
| 18 to 24 Years | 0 (0.0%) | 0 (0.0%) |
| 25 to 34 Years | 0 (0.0%) | 0 (0.0%) |
| 35 to 44 Years | 2 (100.0%) | 1 (100.0%) |
| 45 to 54 Years | 3 (100.0%) | 0 (0.0%) |
| 55 to 64 Years | 4 (100.0%) | 5 (71.4%) |
| 65 to 74 Years | 2 (66.7%) | 1 (100.0%) |
| 75 Years and over | 0 (0.0%) | 4 (100.0%) |
| Total | 12 (92.3%) | 13 (86.7%) |
Income Below Poverty Among Married-Couple Families in Russell Springs
The poverty statistics for married-couple families in Russell Springs show that 40.0% or 2 of the total 5 families live below the poverty line. Families with no children have the highest poverty rate of 66.7%, comprising of 2 families. On the other hand, families with 1 or 2 children have the lowest poverty rate of 0.0%, which includes 0 families.
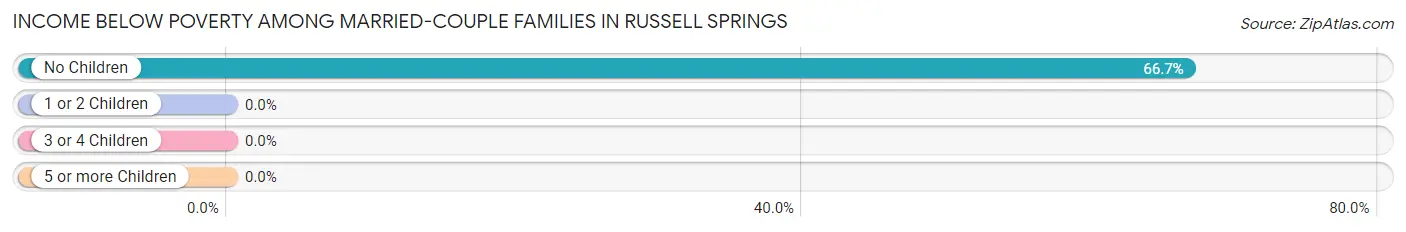
| Children | Above Poverty | Below Poverty |
| No Children | 1 (33.3%) | 2 (66.7%) |
| 1 or 2 Children | 2 (100.0%) | 0 (0.0%) |
| 3 or 4 Children | 0 (0.0%) | 0 (0.0%) |
| 5 or more Children | 0 (0.0%) | 0 (0.0%) |
| Total | 3 (60.0%) | 2 (40.0%) |
Income Below Poverty Among Single-Parent Households in Russell Springs
| Children | Single Father | Single Mother |
| No Children | 0 (0.0%) | 0 (0.0%) |
| 1 or 2 Children | 0 (0.0%) | 0 (0.0%) |
| 3 or 4 Children | 0 (0.0%) | 0 (0.0%) |
| 5 or more Children | 0 (0.0%) | 0 (0.0%) |
| Total | 0 (0.0%) | 0 (0.0%) |
Income Below Poverty Among Married-Couple vs Single-Parent Households in Russell Springs
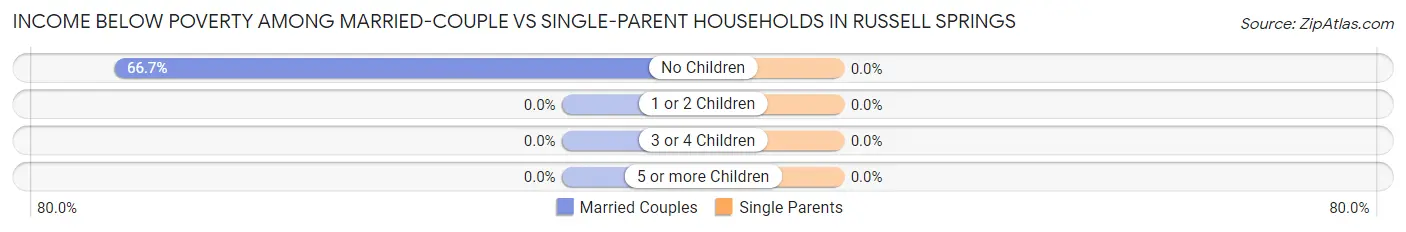
| Children | Married-Couple Families | Single-Parent Households |
| No Children | 2 (66.7%) | 0 (0.0%) |
| 1 or 2 Children | 0 (0.0%) | 0 (0.0%) |
| 3 or 4 Children | 0 (0.0%) | 0 (0.0%) |
| 5 or more Children | 0 (0.0%) | 0 (0.0%) |
| Total | 2 (40.0%) | 0 (0.0%) |
Race in Russell Springs
The most populous races in Russell Springs are White / Caucasian (24 | 85.7%), and Two or more Races (4 | 14.3%).
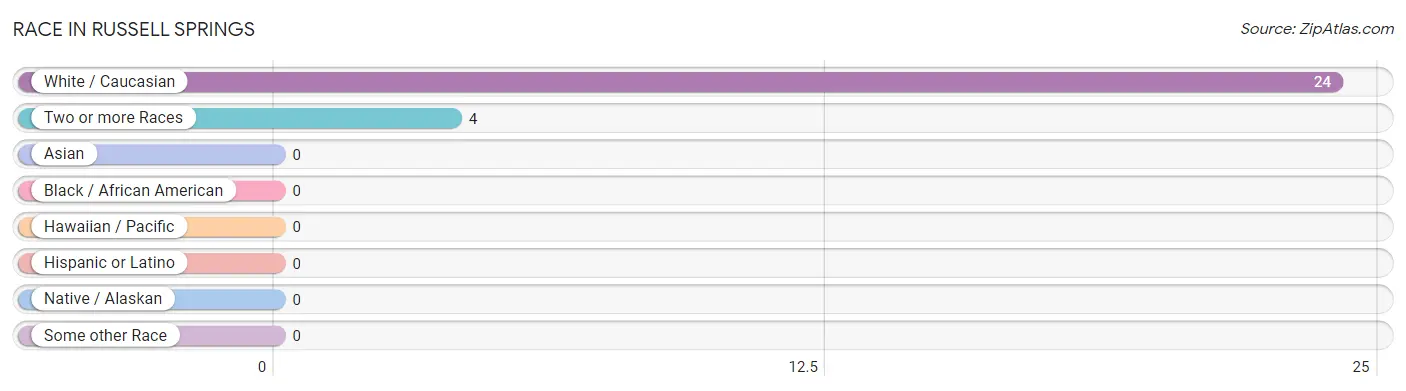
| Race | # Population | % Population |
| Asian | 0 | 0.0% |
| Black / African American | 0 | 0.0% |
| Hawaiian / Pacific | 0 | 0.0% |
| Hispanic or Latino | 0 | 0.0% |
| Native / Alaskan | 0 | 0.0% |
| White / Caucasian | 24 | 85.7% |
| Two or more Races | 4 | 14.3% |
| Some other Race | 0 | 0.0% |
| Total | 28 | 100.0% |
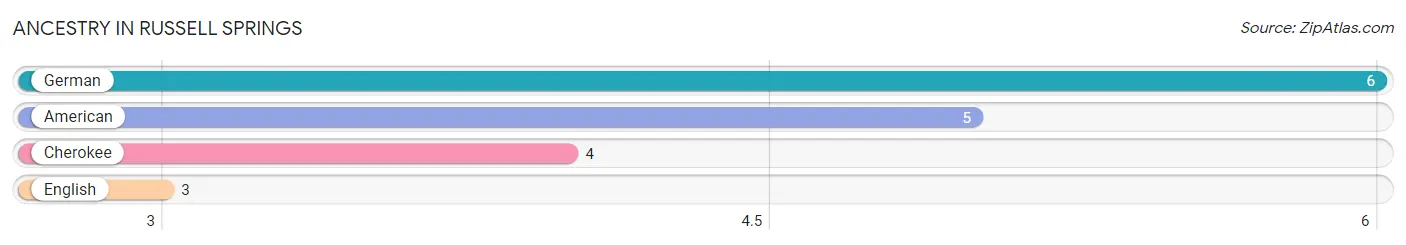
Ancestry in Russell Springs
The most populous ancestries reported in Russell Springs are German (6 | 21.4%), American (5 | 17.9%), Cherokee (4 | 14.3%), and English (3 | 10.7%), together accounting for 64.3% of all Russell Springs residents.
| Ancestry | # Population | % Population |
| American | 5 | 17.9% |
| Cherokee | 4 | 14.3% |
| English | 3 | 10.7% |
| German | 6 | 21.4% | View All 4 Rows |
Immigrants in Russell Springs

| Immigration Origin | # Population | % Population | View All 0 Rows |
Sex and Age in Russell Springs
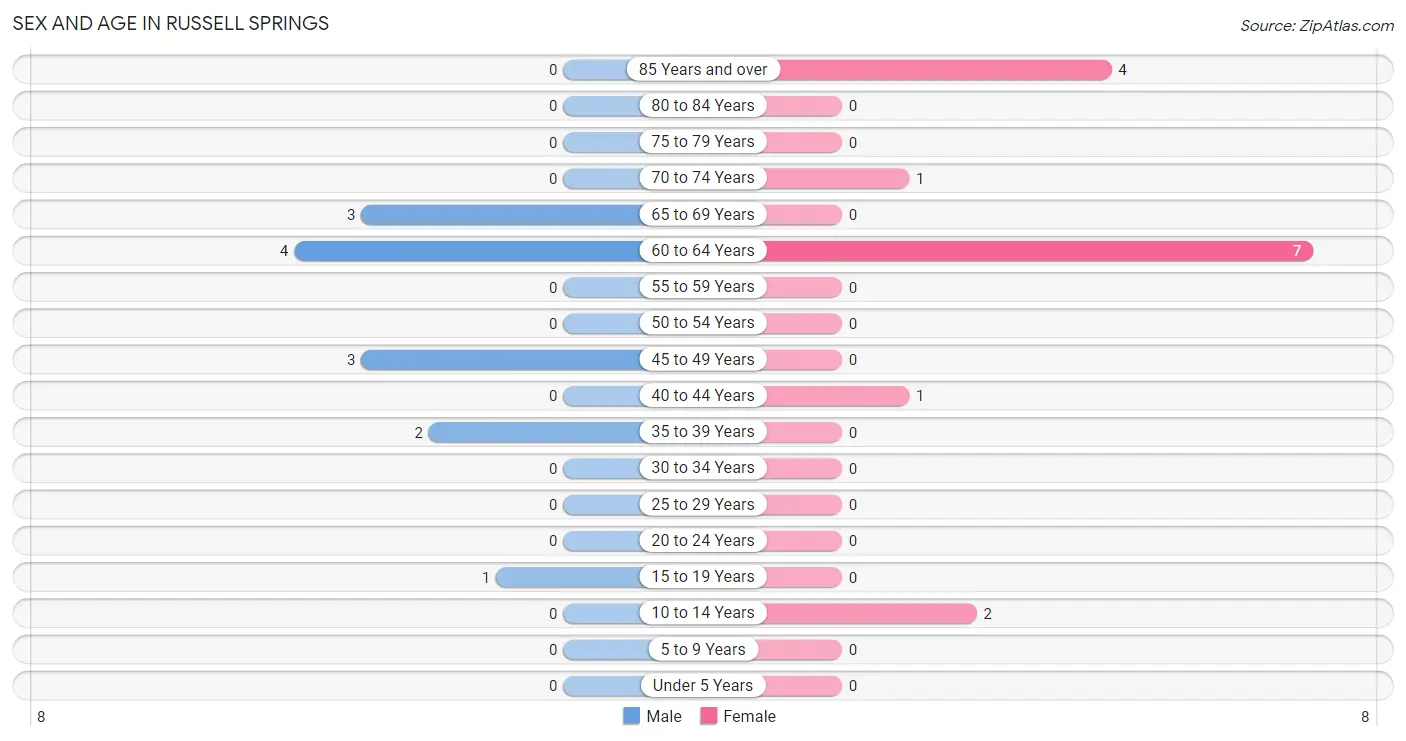
Sex and Age in Russell Springs
The most populous age groups in Russell Springs are 60 to 64 Years (4 | 30.8%) for men and 60 to 64 Years (7 | 46.7%) for women.
| Age Bracket | Male | Female |
| Under 5 Years | 0 (0.0%) | 0 (0.0%) |
| 5 to 9 Years | 0 (0.0%) | 0 (0.0%) |
| 10 to 14 Years | 0 (0.0%) | 2 (13.3%) |
| 15 to 19 Years | 1 (7.7%) | 0 (0.0%) |
| 20 to 24 Years | 0 (0.0%) | 0 (0.0%) |
| 25 to 29 Years | 0 (0.0%) | 0 (0.0%) |
| 30 to 34 Years | 0 (0.0%) | 0 (0.0%) |
| 35 to 39 Years | 2 (15.4%) | 0 (0.0%) |
| 40 to 44 Years | 0 (0.0%) | 1 (6.7%) |
| 45 to 49 Years | 3 (23.1%) | 0 (0.0%) |
| 50 to 54 Years | 0 (0.0%) | 0 (0.0%) |
| 55 to 59 Years | 0 (0.0%) | 0 (0.0%) |
| 60 to 64 Years | 4 (30.8%) | 7 (46.7%) |
| 65 to 69 Years | 3 (23.1%) | 0 (0.0%) |
| 70 to 74 Years | 0 (0.0%) | 1 (6.7%) |
| 75 to 79 Years | 0 (0.0%) | 0 (0.0%) |
| 80 to 84 Years | 0 (0.0%) | 0 (0.0%) |
| 85 Years and over | 0 (0.0%) | 4 (26.7%) |
| Total | 13 (100.0%) | 15 (100.0%) |
Families and Households in Russell Springs
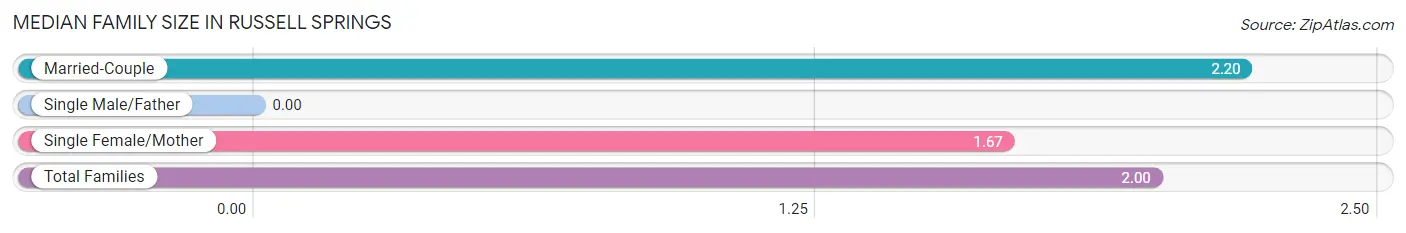
Median Family Size in Russell Springs
| Family Type | # Families | Family Size |
| Married-Couple | 5 (62.5%) | 2.20 |
| Single Male/Father | 0 (0.0%) | - |
| Single Female/Mother | 3 (37.5%) | 1.67 |
| Total Families | 8 (100.0%) | 2.00 |
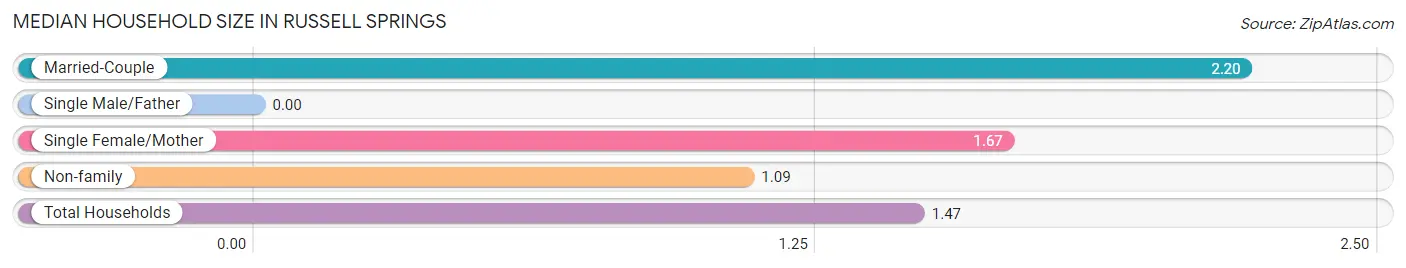
Median Household Size in Russell Springs
| Household Type | # Households | Household Size |
| Married-Couple | 5 (26.3%) | 2.20 |
| Single Male/Father | 0 (0.0%) | - |
| Single Female/Mother | 3 (15.8%) | 1.67 |
| Non-family | 11 (57.9%) | 1.09 |
| Total Households | 19 (100.0%) | 1.47 |
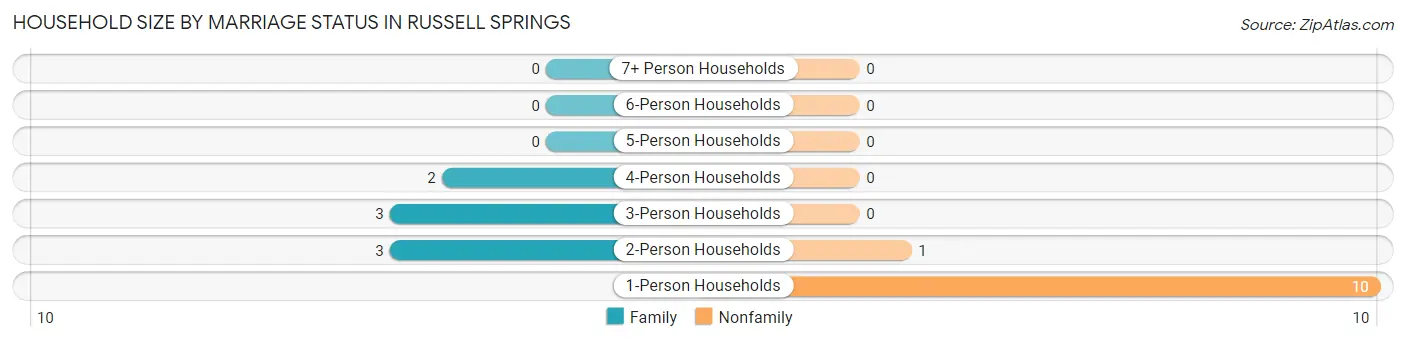
Household Size by Marriage Status in Russell Springs
Out of a total of 19 households in Russell Springs, 8 (42.1%) are family households, while 11 (57.9%) are nonfamily households. The most numerous type of family households are 2-person households, comprising 3, and the most common type of nonfamily households are 1-person households, comprising 10.
| Household Size | Family Households | Nonfamily Households |
| 1-Person Households | - | 10 (52.6%) |
| 2-Person Households | 3 (15.8%) | 1 (5.3%) |
| 3-Person Households | 3 (15.8%) | 0 (0.0%) |
| 4-Person Households | 2 (10.5%) | 0 (0.0%) |
| 5-Person Households | 0 (0.0%) | 0 (0.0%) |
| 6-Person Households | 0 (0.0%) | 0 (0.0%) |
| 7+ Person Households | 0 (0.0%) | 0 (0.0%) |
| Total | 8 (42.1%) | 11 (57.9%) |
Female Fertility in Russell Springs
Fertility by Age in Russell Springs
| Age Bracket | Women with Births | Births / 1,000 Women |
| 15 to 19 years | 0 (0.0%) | 0.0 |
| 20 to 34 years | 0 (0.0%) | 0.0 |
| 35 to 50 years | 0 (0.0%) | 0.0 |
| Total | 0 (0.0%) | 0.0 |
Fertility by Age by Marriage Status in Russell Springs
| Age Bracket | Married | Unmarried |
| 15 to 19 years | 0 (0.0%) | 0 (0.0%) |
| 20 to 34 years | 0 (0.0%) | 0 (0.0%) |
| 35 to 50 years | 0 (0.0%) | 0 (0.0%) |
| Total | 0 (0.0%) | 0 (0.0%) |
Fertility by Education in Russell Springs
| Educational Attainment | Women with Births | Births / 1,000 Women |
| Less than High School | 0 (0.0%) | 0.0 |
| High School Diploma | 0 (0.0%) | 0.0 |
| College or Associate's Degree | 0 (0.0%) | 0.0 |
| Bachelor's Degree | 0 (0.0%) | 0.0 |
| Graduate Degree | 0 (0.0%) | 0.0 |
| Total | 0 (0.0%) | 0.0 |
Fertility by Education by Marriage Status in Russell Springs
| Educational Attainment | Married | Unmarried |
| Less than High School | 0 (0.0%) | 0 (0.0%) |
| High School Diploma | 0 (0.0%) | 0 (0.0%) |
| College or Associate's Degree | 0 (0.0%) | 0 (0.0%) |
| Bachelor's Degree | 0 (0.0%) | 0 (0.0%) |
| Graduate Degree | 0 (0.0%) | 0 (0.0%) |
| Total | 0 (0.0%) | 0 (0.0%) |
Employment Characteristics in Russell Springs
Employment by Class of Employer in Russell Springs
Among the 13 employed individuals in Russell Springs, private company employees (5 | 38.5%), self-employed (not incorporated) (5 | 38.5%), and local government employees (2 | 15.4%) make up the most common classes of employment.
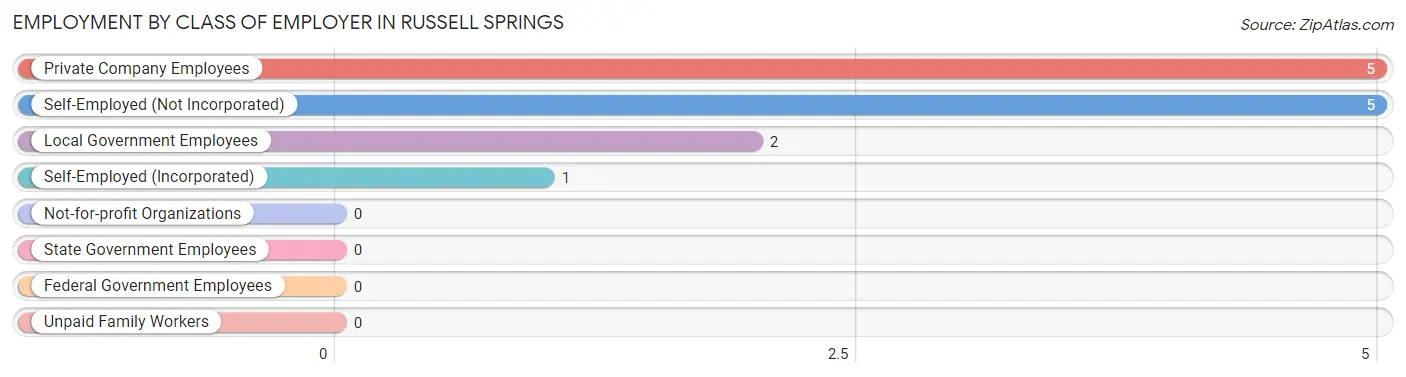
| Employer Class | # Employees | % Employees |
| Private Company Employees | 5 | 38.5% |
| Self-Employed (Incorporated) | 1 | 7.7% |
| Self-Employed (Not Incorporated) | 5 | 38.5% |
| Not-for-profit Organizations | 0 | 0.0% |
| Local Government Employees | 2 | 15.4% |
| State Government Employees | 0 | 0.0% |
| Federal Government Employees | 0 | 0.0% |
| Unpaid Family Workers | 0 | 0.0% |
| Total | 13 | 100.0% |
Employment Status by Age in Russell Springs
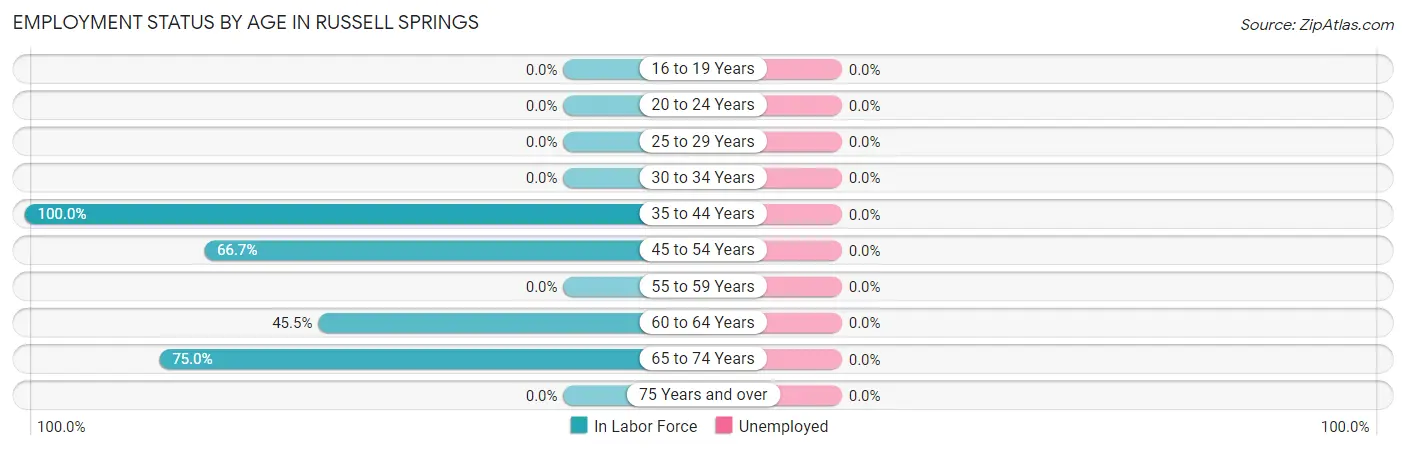
| Age Bracket | In Labor Force | Unemployed |
| 16 to 19 Years | 0 (0.0%) | 0 (0.0%) |
| 20 to 24 Years | 0 (0.0%) | 0 (0.0%) |
| 25 to 29 Years | 0 (0.0%) | 0 (0.0%) |
| 30 to 34 Years | 0 (0.0%) | 0 (0.0%) |
| 35 to 44 Years | 3 (100.0%) | 0 (0.0%) |
| 45 to 54 Years | 2 (66.7%) | 0 (0.0%) |
| 55 to 59 Years | 0 (0.0%) | 0 (0.0%) |
| 60 to 64 Years | 5 (45.5%) | 0 (0.0%) |
| 65 to 74 Years | 3 (75.0%) | 0 (0.0%) |
| 75 Years and over | 0 (0.0%) | 0 (0.0%) |
| Total | 13 (52.0%) | 0 (0.0%) |
Employment Status by Educational Attainment in Russell Springs
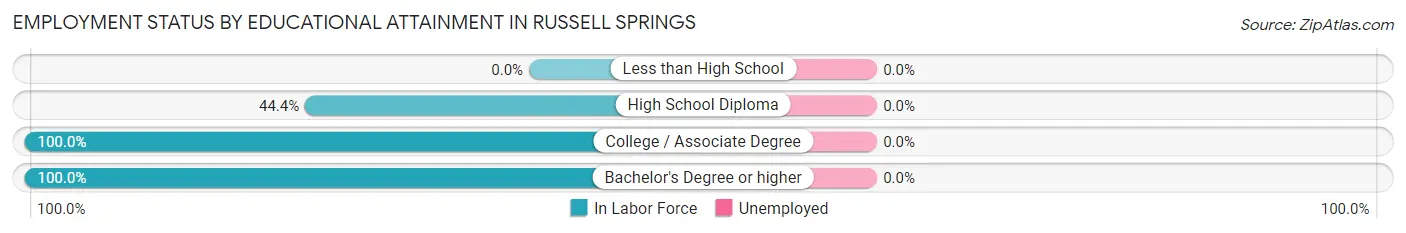
| Educational Attainment | In Labor Force | Unemployed |
| Less than High School | 0 (0.0%) | 0 (0.0%) |
| High School Diploma | 4 (44.4%) | 0 (0.0%) |
| College / Associate Degree | 4 (100.0%) | 0 (0.0%) |
| Bachelor's Degree or higher | 2 (100.0%) | 0 (0.0%) |
| Total | 10 (58.8%) | 0 (0.0%) |
Employment Occupations by Sex in Russell Springs
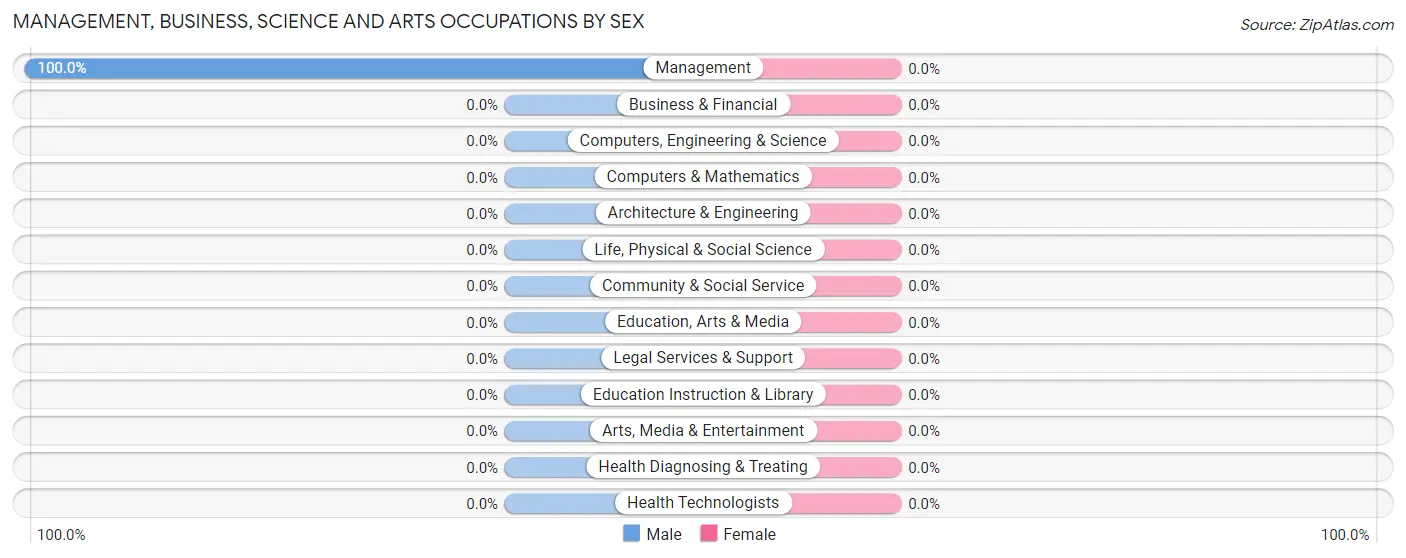
Management, Business, Science and Arts Occupations
The most common Management, Business, Science and Arts occupations in Russell Springs are , and Management (4 | 30.8%).
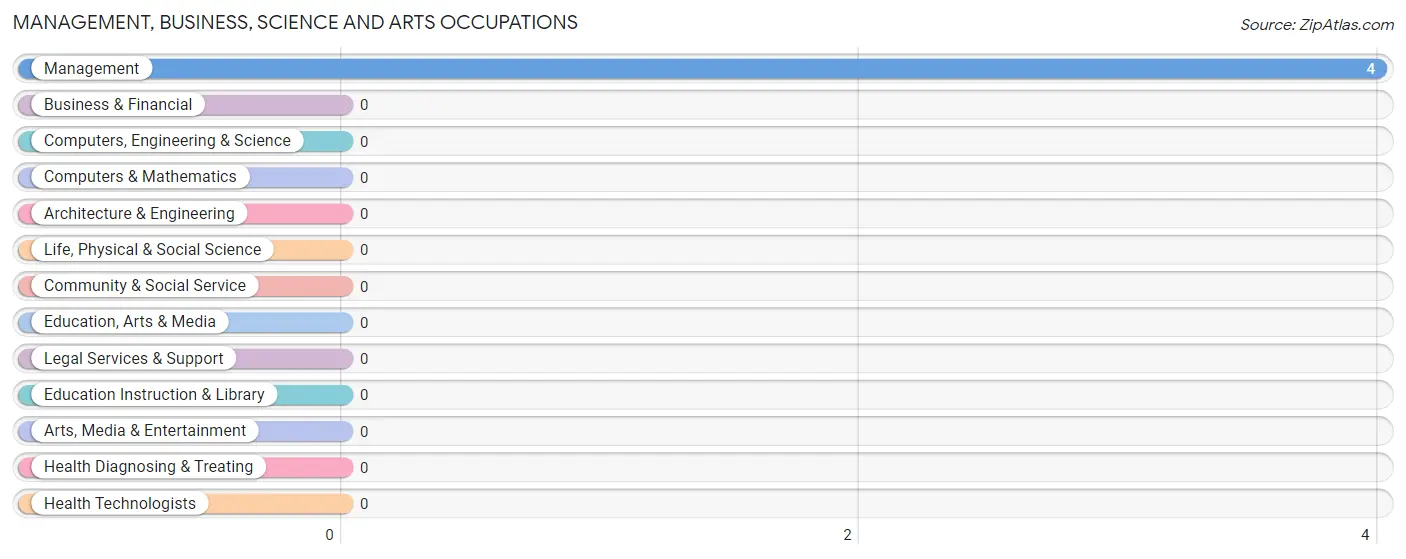
Management, Business, Science and Arts Occupations by Sex
| Occupation | Male | Female |
| Management | 4 (100.0%) | 0 (0.0%) |
| Business & Financial | 0 (0.0%) | 0 (0.0%) |
| Computers, Engineering & Science | 0 (0.0%) | 0 (0.0%) |
| Computers & Mathematics | 0 (0.0%) | 0 (0.0%) |
| Architecture & Engineering | 0 (0.0%) | 0 (0.0%) |
| Life, Physical & Social Science | 0 (0.0%) | 0 (0.0%) |
| Community & Social Service | 0 (0.0%) | 0 (0.0%) |
| Education, Arts & Media | 0 (0.0%) | 0 (0.0%) |
| Legal Services & Support | 0 (0.0%) | 0 (0.0%) |
| Education Instruction & Library | 0 (0.0%) | 0 (0.0%) |
| Arts, Media & Entertainment | 0 (0.0%) | 0 (0.0%) |
| Health Diagnosing & Treating | 0 (0.0%) | 0 (0.0%) |
| Health Technologists | 0 (0.0%) | 0 (0.0%) |
| Total (Category) | 4 (100.0%) | 0 (0.0%) |
| Total (Overall) | 11 (84.6%) | 2 (15.4%) |
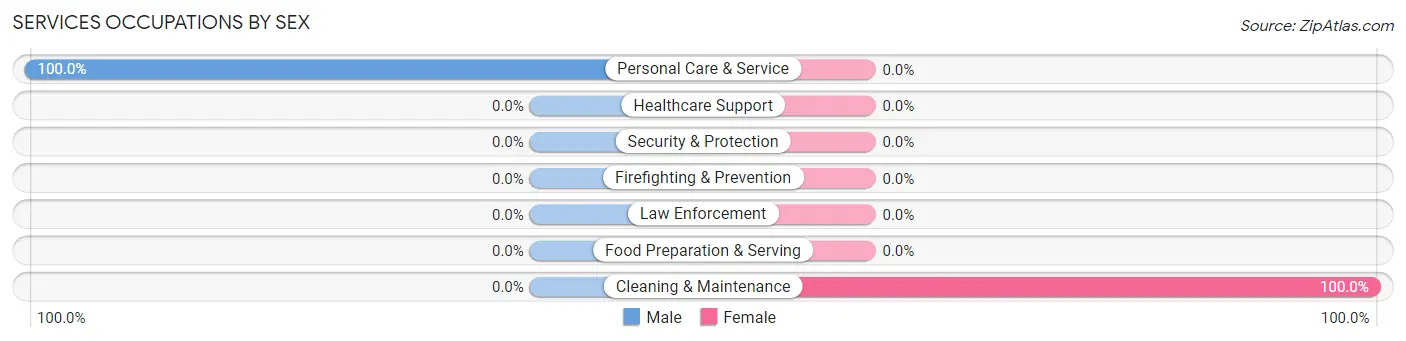
Services Occupations
The most common Services occupations in Russell Springs are Cleaning & Maintenance (1 | 7.7%), and Personal Care & Service (1 | 7.7%).
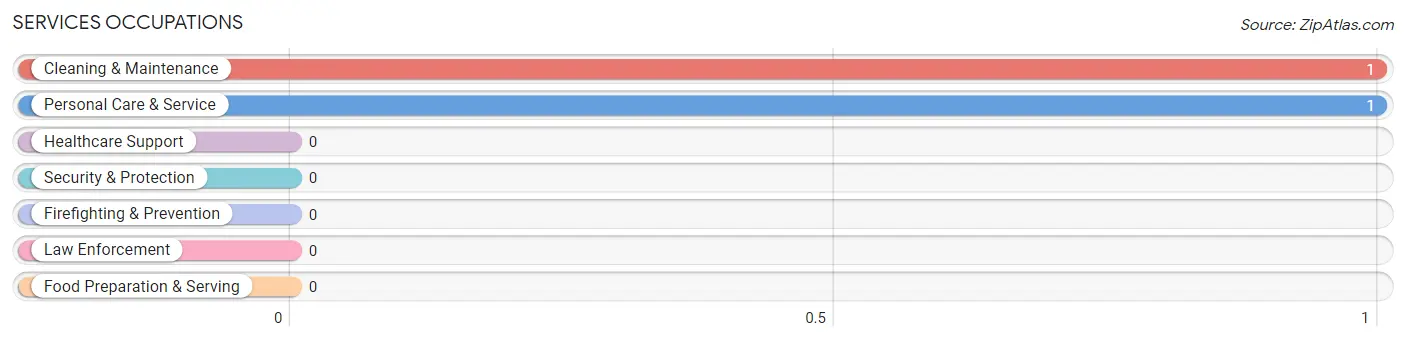
Services Occupations by Sex
| Occupation | Male | Female |
| Healthcare Support | 0 (0.0%) | 0 (0.0%) |
| Security & Protection | 0 (0.0%) | 0 (0.0%) |
| Firefighting & Prevention | 0 (0.0%) | 0 (0.0%) |
| Law Enforcement | 0 (0.0%) | 0 (0.0%) |
| Food Preparation & Serving | 0 (0.0%) | 0 (0.0%) |
| Cleaning & Maintenance | 0 (0.0%) | 1 (100.0%) |
| Personal Care & Service | 1 (100.0%) | 0 (0.0%) |
| Total (Category) | 1 (50.0%) | 1 (50.0%) |
| Total (Overall) | 11 (84.6%) | 2 (15.4%) |
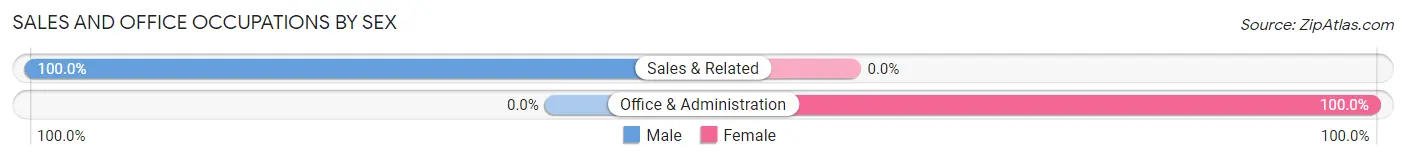
Sales and Office Occupations
The most common Sales and Office occupations in Russell Springs are Sales & Related (2 | 15.4%), and Office & Administration (1 | 7.7%).
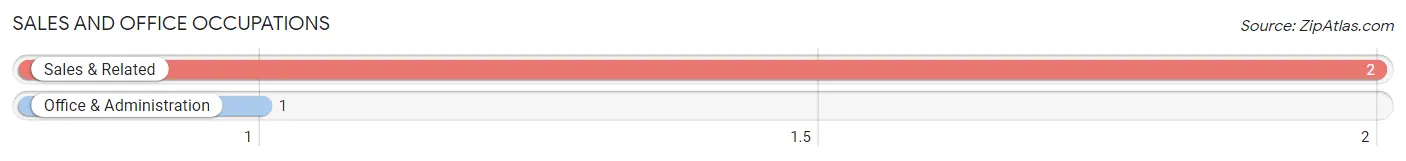
Sales and Office Occupations by Sex
| Occupation | Male | Female |
| Sales & Related | 2 (100.0%) | 0 (0.0%) |
| Office & Administration | 0 (0.0%) | 1 (100.0%) |
| Total (Category) | 2 (66.7%) | 1 (33.3%) |
| Total (Overall) | 11 (84.6%) | 2 (15.4%) |
Natural Resources, Construction and Maintenance Occupations
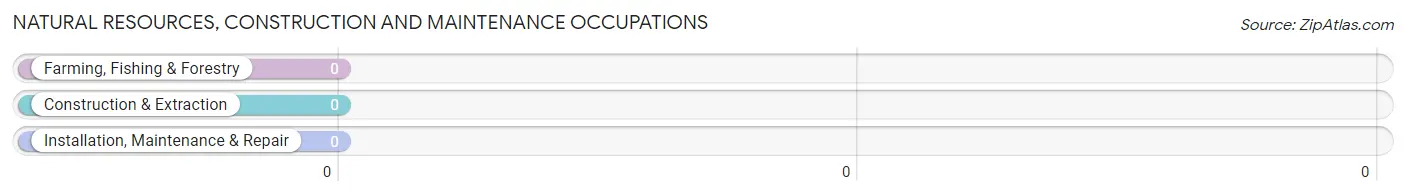
Natural Resources, Construction and Maintenance Occupations by Sex
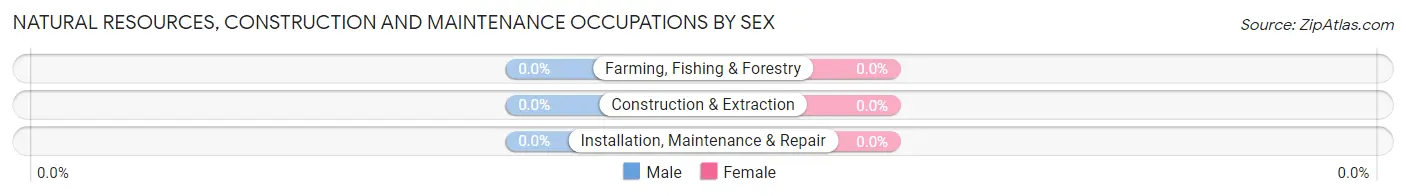
| Occupation | Male | Female |
| Farming, Fishing & Forestry | 0 (0.0%) | 0 (0.0%) |
| Construction & Extraction | 0 (0.0%) | 0 (0.0%) |
| Installation, Maintenance & Repair | 0 (0.0%) | 0 (0.0%) |
| Total (Category) | 0 (0.0%) | 0 (0.0%) |
| Total (Overall) | 11 (84.6%) | 2 (15.4%) |
Production, Transportation and Moving Occupations
The most common Production, Transportation and Moving occupations in Russell Springs are Material Moving (2 | 15.4%), Production (1 | 7.7%), and Transportation (1 | 7.7%).
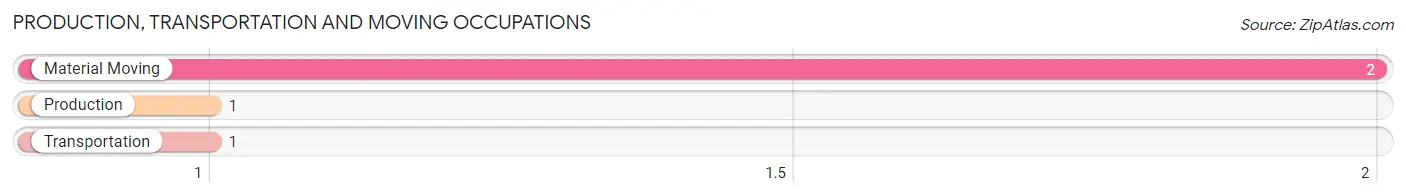
Production, Transportation and Moving Occupations by Sex
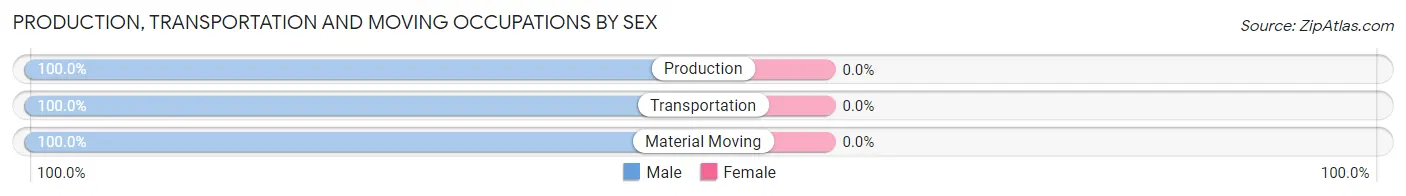
| Occupation | Male | Female |
| Production | 1 (100.0%) | 0 (0.0%) |
| Transportation | 1 (100.0%) | 0 (0.0%) |
| Material Moving | 2 (100.0%) | 0 (0.0%) |
| Total (Category) | 4 (100.0%) | 0 (0.0%) |
| Total (Overall) | 11 (84.6%) | 2 (15.4%) |
Employment Industries by Sex in Russell Springs
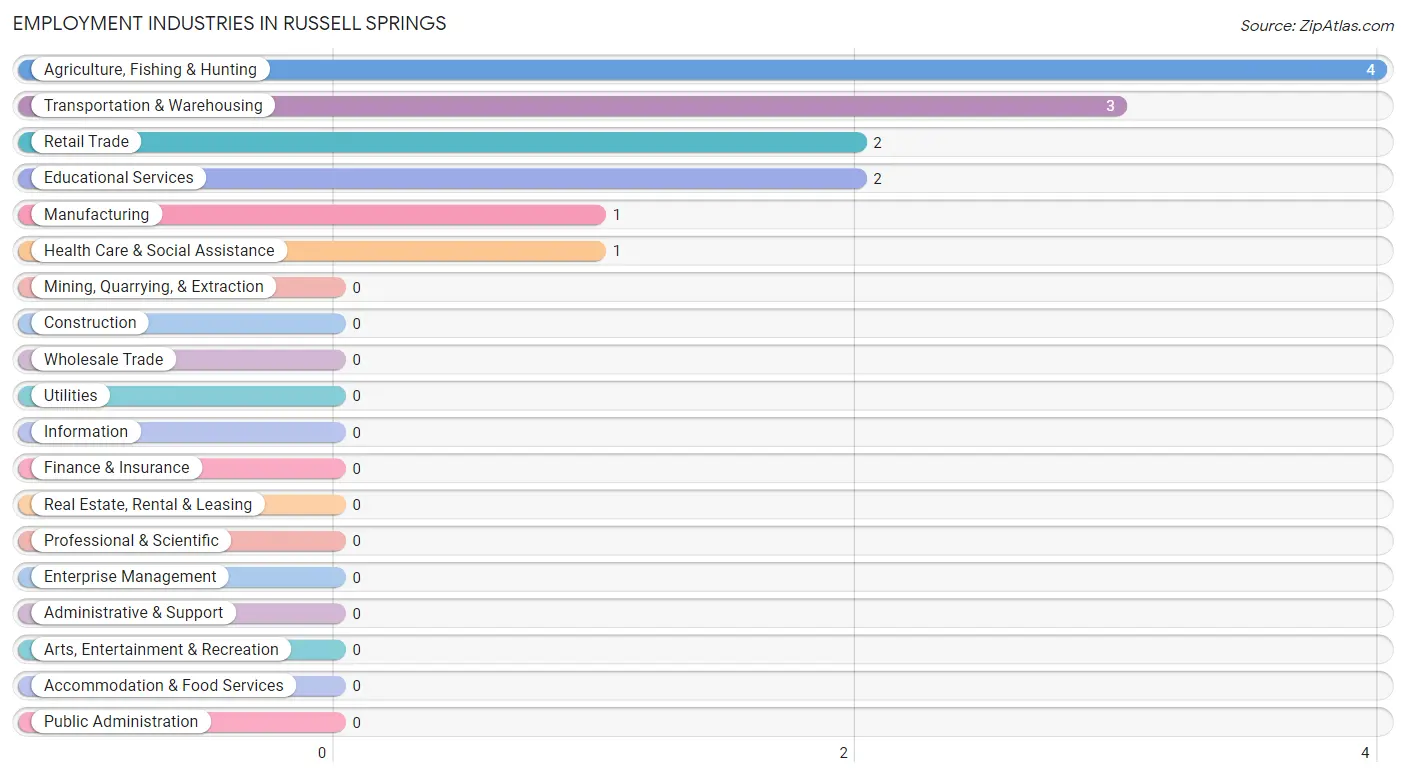
Employment Industries in Russell Springs
The major employment industries in Russell Springs include Agriculture, Fishing & Hunting (4 | 30.8%), Transportation & Warehousing (3 | 23.1%), Retail Trade (2 | 15.4%), Educational Services (2 | 15.4%), and Manufacturing (1 | 7.7%).
Employment Industries by Sex in Russell Springs
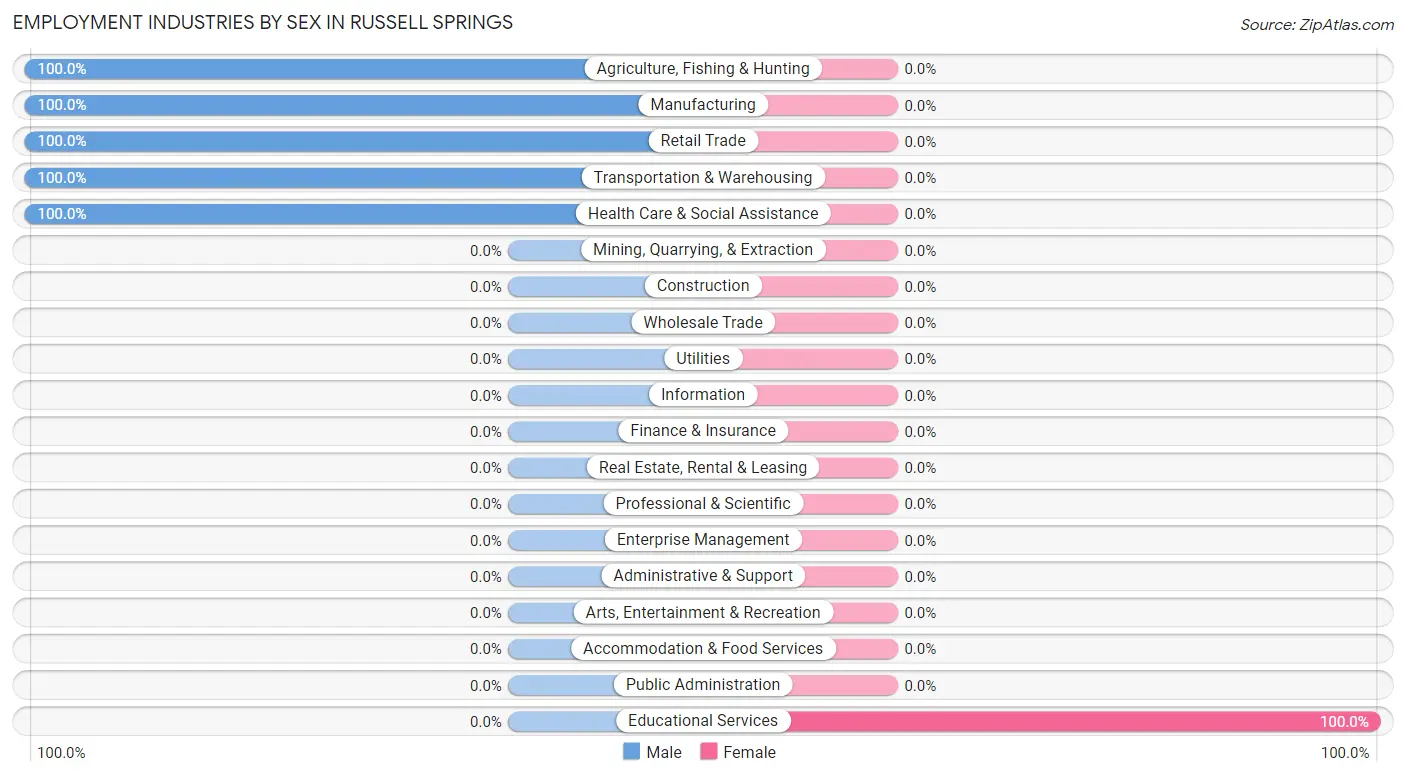
| Industry | Male | Female |
| Agriculture, Fishing & Hunting | 4 (100.0%) | 0 (0.0%) |
| Mining, Quarrying, & Extraction | 0 (0.0%) | 0 (0.0%) |
| Construction | 0 (0.0%) | 0 (0.0%) |
| Manufacturing | 1 (100.0%) | 0 (0.0%) |
| Wholesale Trade | 0 (0.0%) | 0 (0.0%) |
| Retail Trade | 2 (100.0%) | 0 (0.0%) |
| Transportation & Warehousing | 3 (100.0%) | 0 (0.0%) |
| Utilities | 0 (0.0%) | 0 (0.0%) |
| Information | 0 (0.0%) | 0 (0.0%) |
| Finance & Insurance | 0 (0.0%) | 0 (0.0%) |
| Real Estate, Rental & Leasing | 0 (0.0%) | 0 (0.0%) |
| Professional & Scientific | 0 (0.0%) | 0 (0.0%) |
| Enterprise Management | 0 (0.0%) | 0 (0.0%) |
| Administrative & Support | 0 (0.0%) | 0 (0.0%) |
| Educational Services | 0 (0.0%) | 2 (100.0%) |
| Health Care & Social Assistance | 1 (100.0%) | 0 (0.0%) |
| Arts, Entertainment & Recreation | 0 (0.0%) | 0 (0.0%) |
| Accommodation & Food Services | 0 (0.0%) | 0 (0.0%) |
| Public Administration | 0 (0.0%) | 0 (0.0%) |
| Total | 11 (84.6%) | 2 (15.4%) |
Education in Russell Springs
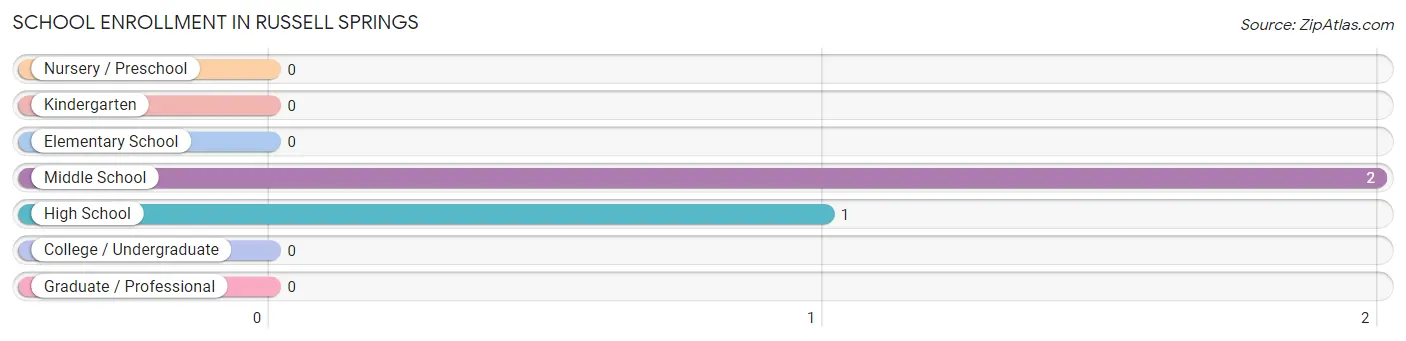
School Enrollment in Russell Springs
The most common levels of schooling among the 3 students in Russell Springs are middle school (2 | 66.7%), and high school (1 | 33.3%).
| School Level | # Students | % Students |
| Nursery / Preschool | 0 | 0.0% |
| Kindergarten | 0 | 0.0% |
| Elementary School | 0 | 0.0% |
| Middle School | 2 | 66.7% |
| High School | 1 | 33.3% |
| College / Undergraduate | 0 | 0.0% |
| Graduate / Professional | 0 | 0.0% |
| Total | 3 | 100.0% |
School Enrollment by Age by Funding Source in Russell Springs
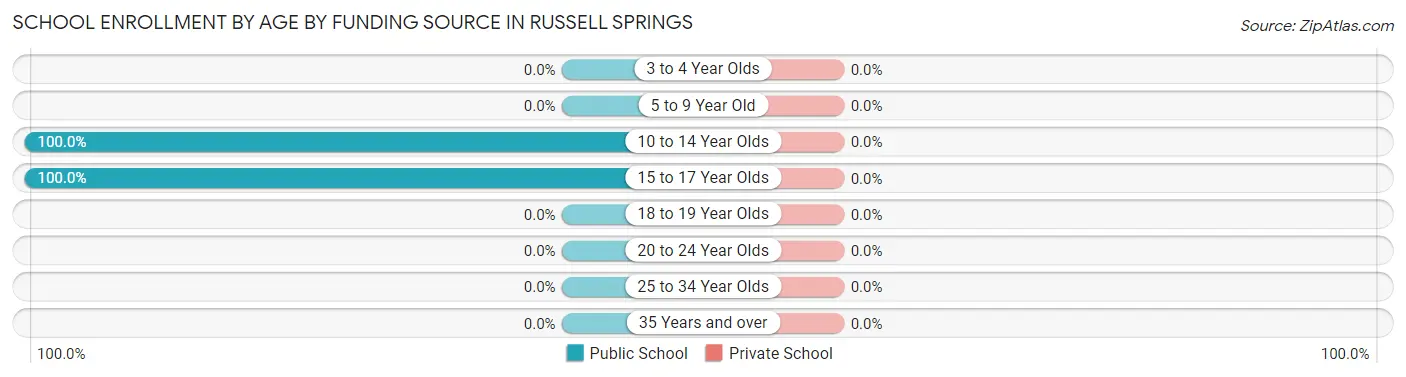
| Age Bracket | Public School | Private School |
| 3 to 4 Year Olds | 0 (0.0%) | 0 (0.0%) |
| 5 to 9 Year Old | 0 (0.0%) | 0 (0.0%) |
| 10 to 14 Year Olds | 2 (100.0%) | 0 (0.0%) |
| 15 to 17 Year Olds | 1 (100.0%) | 0 (0.0%) |
| 18 to 19 Year Olds | 0 (0.0%) | 0 (0.0%) |
| 20 to 24 Year Olds | 0 (0.0%) | 0 (0.0%) |
| 25 to 34 Year Olds | 0 (0.0%) | 0 (0.0%) |
| 35 Years and over | 0 (0.0%) | 0 (0.0%) |
| Total | 3 (100.0%) | 0 (0.0%) |
Educational Attainment by Field of Study in Russell Springs
Education (4 | 57.1%), bio, nature & agricultural (2 | 28.6%), and business (1 | 14.3%) are the most common fields of study among 7 individuals in Russell Springs who have obtained a bachelor's degree or higher.
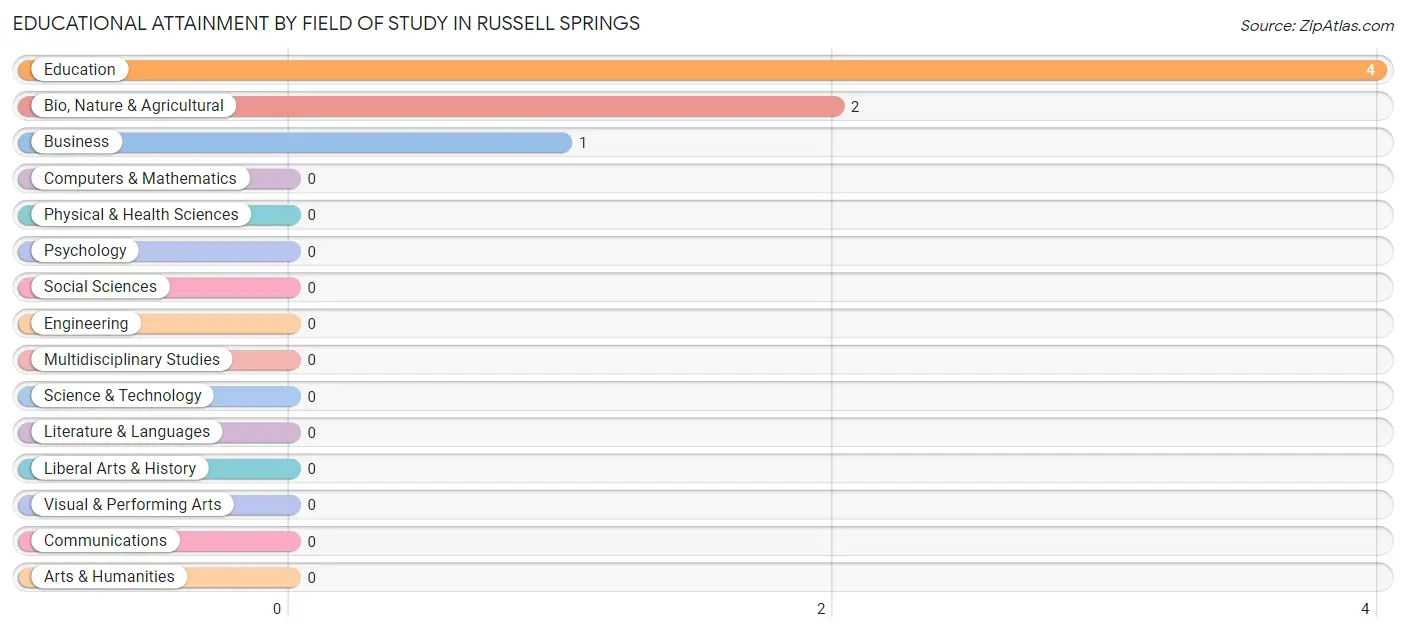
| Field of Study | # Graduates | % Graduates |
| Computers & Mathematics | 0 | 0.0% |
| Bio, Nature & Agricultural | 2 | 28.6% |
| Physical & Health Sciences | 0 | 0.0% |
| Psychology | 0 | 0.0% |
| Social Sciences | 0 | 0.0% |
| Engineering | 0 | 0.0% |
| Multidisciplinary Studies | 0 | 0.0% |
| Science & Technology | 0 | 0.0% |
| Business | 1 | 14.3% |
| Education | 4 | 57.1% |
| Literature & Languages | 0 | 0.0% |
| Liberal Arts & History | 0 | 0.0% |
| Visual & Performing Arts | 0 | 0.0% |
| Communications | 0 | 0.0% |
| Arts & Humanities | 0 | 0.0% |
| Total | 7 | 100.0% |
Transportation & Commute in Russell Springs
Vehicle Availability by Sex in Russell Springs
The most prevalent vehicle ownership categories in Russell Springs are males with 2 vehicles (8, accounting for 72.7%) and females with 2 vehicles (0, making up 400.0%).
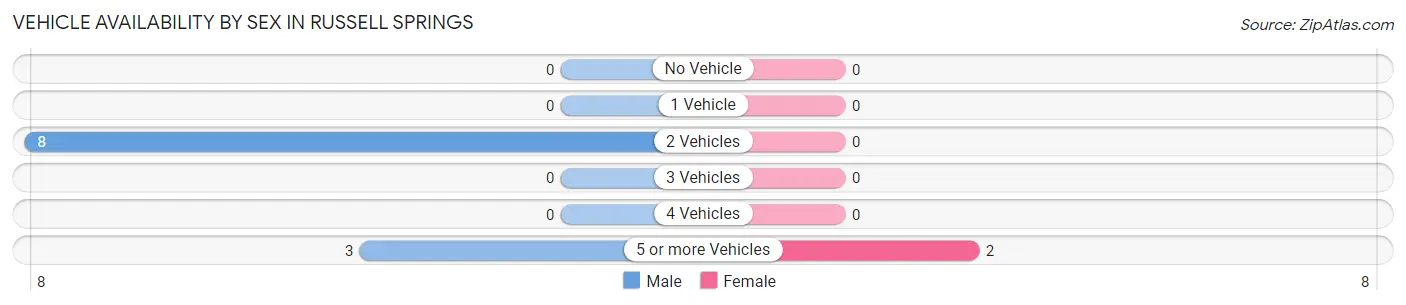
| Vehicles Available | Male | Female |
| No Vehicle | 0 (0.0%) | 0 (0.0%) |
| 1 Vehicle | 0 (0.0%) | 0 (0.0%) |
| 2 Vehicles | 8 (72.7%) | 0 (0.0%) |
| 3 Vehicles | 0 (0.0%) | 0 (0.0%) |
| 4 Vehicles | 0 (0.0%) | 0 (0.0%) |
| 5 or more Vehicles | 3 (27.3%) | 2 (100.0%) |
| Total | 11 (100.0%) | 2 (100.0%) |
Commute Time in Russell Springs
The most frequently occuring commute durations in Russell Springs are 15 to 19 minutes (4 commuters, 40.0%), 5 to 9 minutes (2 commuters, 20.0%), and less than 5 minutes (1 commuters, 10.0%).
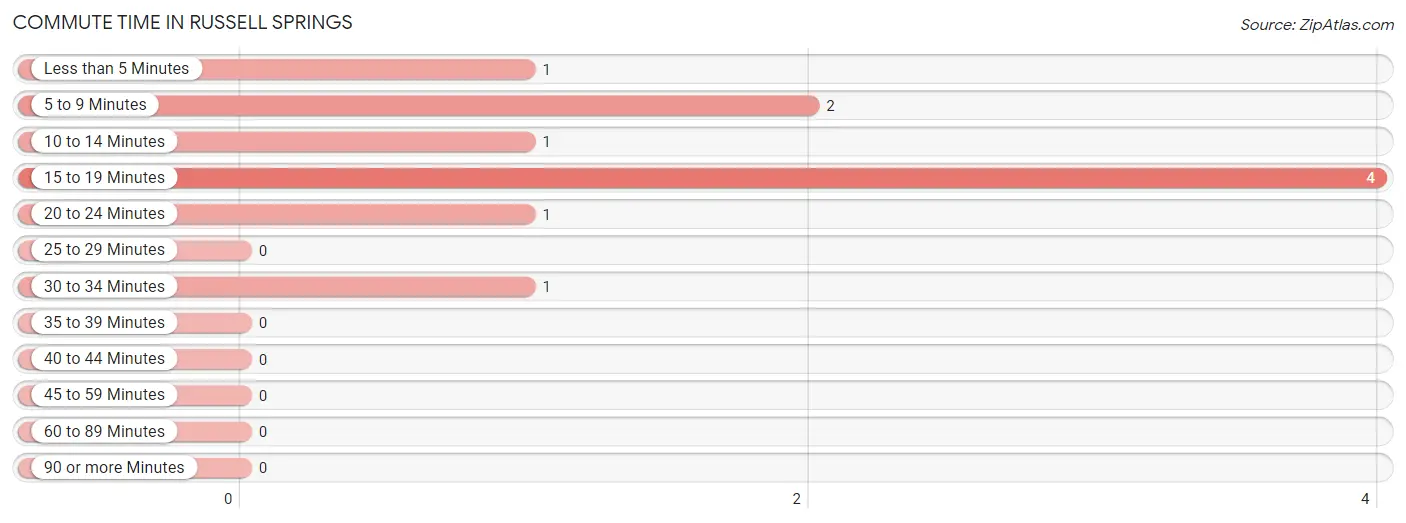
| Commute Time | # Commuters | % Commuters |
| Less than 5 Minutes | 1 | 10.0% |
| 5 to 9 Minutes | 2 | 20.0% |
| 10 to 14 Minutes | 1 | 10.0% |
| 15 to 19 Minutes | 4 | 40.0% |
| 20 to 24 Minutes | 1 | 10.0% |
| 25 to 29 Minutes | 0 | 0.0% |
| 30 to 34 Minutes | 1 | 10.0% |
| 35 to 39 Minutes | 0 | 0.0% |
| 40 to 44 Minutes | 0 | 0.0% |
| 45 to 59 Minutes | 0 | 0.0% |
| 60 to 89 Minutes | 0 | 0.0% |
| 90 or more Minutes | 0 | 0.0% |
Commute Time by Sex in Russell Springs
The most common commute times in Russell Springs are 15 to 19 minutes (3 commuters, 37.5%) for males and 15 to 19 minutes (1 commuters, 50.0%) for females.
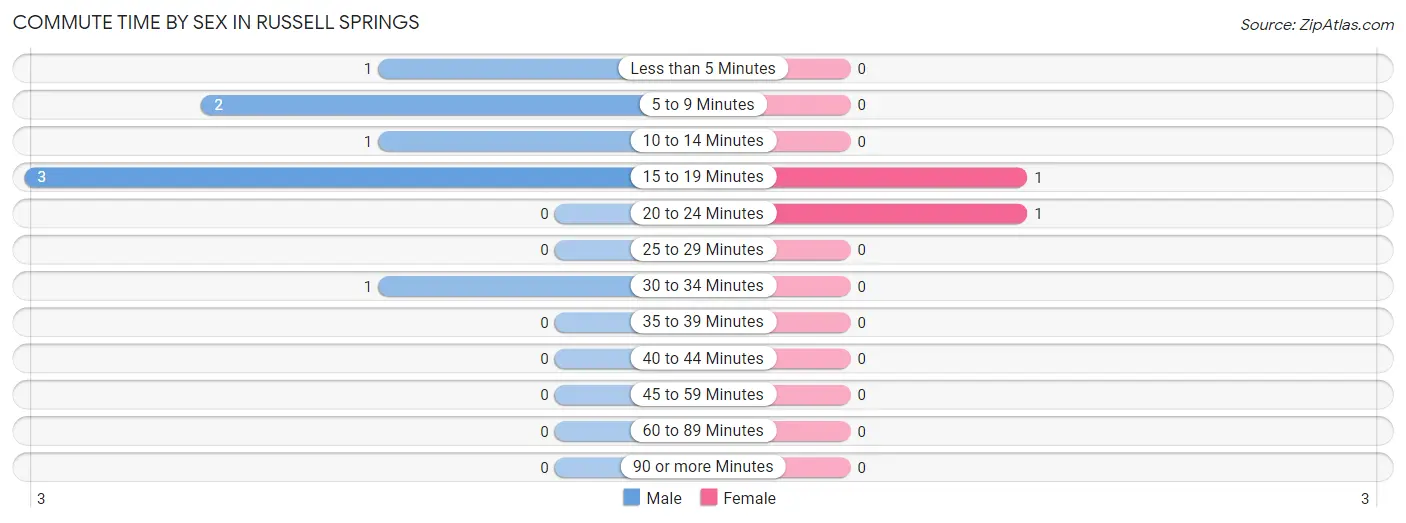
| Commute Time | Male | Female |
| Less than 5 Minutes | 1 (12.5%) | 0 (0.0%) |
| 5 to 9 Minutes | 2 (25.0%) | 0 (0.0%) |
| 10 to 14 Minutes | 1 (12.5%) | 0 (0.0%) |
| 15 to 19 Minutes | 3 (37.5%) | 1 (50.0%) |
| 20 to 24 Minutes | 0 (0.0%) | 1 (50.0%) |
| 25 to 29 Minutes | 0 (0.0%) | 0 (0.0%) |
| 30 to 34 Minutes | 1 (12.5%) | 0 (0.0%) |
| 35 to 39 Minutes | 0 (0.0%) | 0 (0.0%) |
| 40 to 44 Minutes | 0 (0.0%) | 0 (0.0%) |
| 45 to 59 Minutes | 0 (0.0%) | 0 (0.0%) |
| 60 to 89 Minutes | 0 (0.0%) | 0 (0.0%) |
| 90 or more Minutes | 0 (0.0%) | 0 (0.0%) |
Time of Departure to Work by Sex in Russell Springs
The most frequent times of departure to work in Russell Springs are 6:00 AM to 6:29 AM (3, 37.5%) for males and 7:00 AM to 7:29 AM (1, 50.0%) for females.
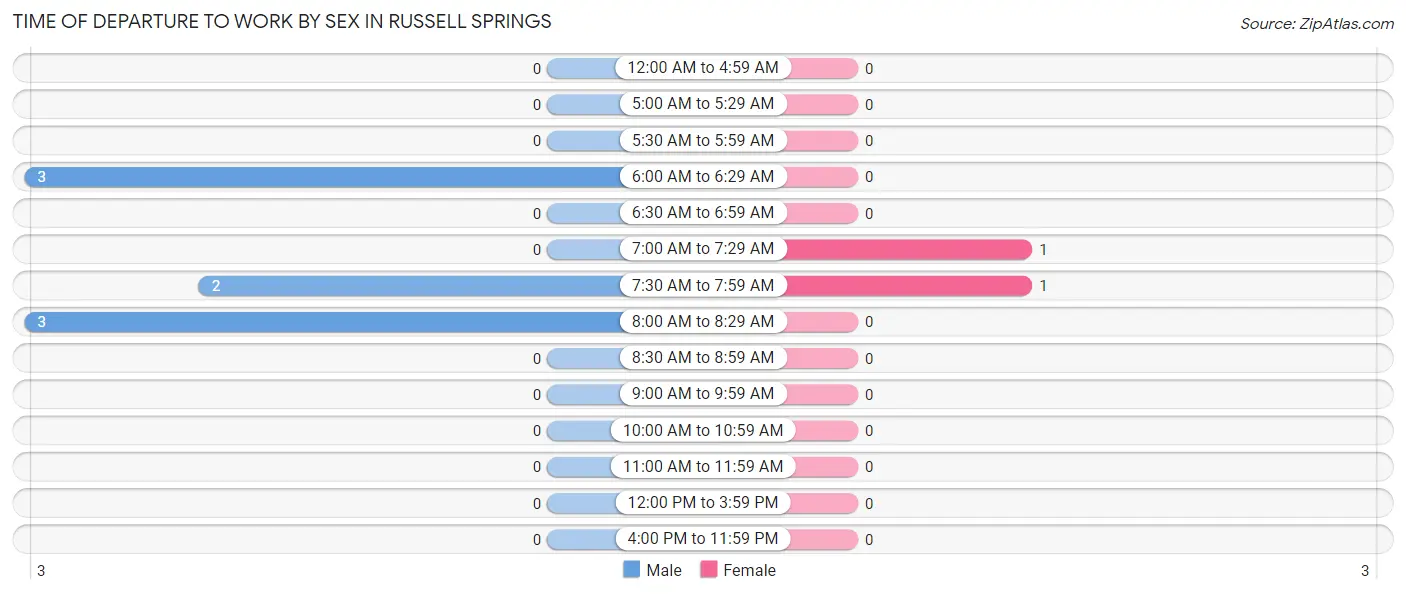
| Time of Departure | Male | Female |
| 12:00 AM to 4:59 AM | 0 (0.0%) | 0 (0.0%) |
| 5:00 AM to 5:29 AM | 0 (0.0%) | 0 (0.0%) |
| 5:30 AM to 5:59 AM | 0 (0.0%) | 0 (0.0%) |
| 6:00 AM to 6:29 AM | 3 (37.5%) | 0 (0.0%) |
| 6:30 AM to 6:59 AM | 0 (0.0%) | 0 (0.0%) |
| 7:00 AM to 7:29 AM | 0 (0.0%) | 1 (50.0%) |
| 7:30 AM to 7:59 AM | 2 (25.0%) | 1 (50.0%) |
| 8:00 AM to 8:29 AM | 3 (37.5%) | 0 (0.0%) |
| 8:30 AM to 8:59 AM | 0 (0.0%) | 0 (0.0%) |
| 9:00 AM to 9:59 AM | 0 (0.0%) | 0 (0.0%) |
| 10:00 AM to 10:59 AM | 0 (0.0%) | 0 (0.0%) |
| 11:00 AM to 11:59 AM | 0 (0.0%) | 0 (0.0%) |
| 12:00 PM to 3:59 PM | 0 (0.0%) | 0 (0.0%) |
| 4:00 PM to 11:59 PM | 0 (0.0%) | 0 (0.0%) |
| Total | 8 (100.0%) | 2 (100.0%) |
Housing Occupancy in Russell Springs
Occupancy by Ownership in Russell Springs
Of the total 19 dwellings in Russell Springs, owner-occupied units account for 19 (100.0%), while renter-occupied units make up 0 (0.0%).
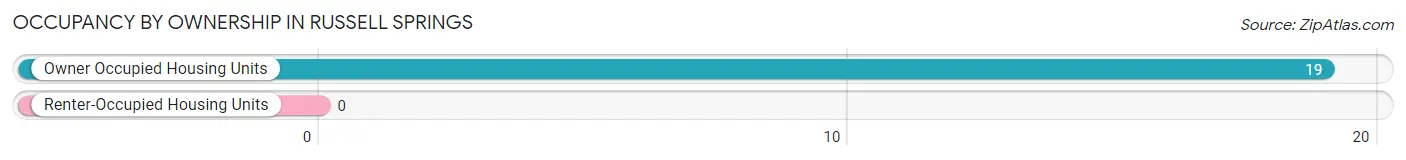
| Occupancy | # Housing Units | % Housing Units |
| Owner Occupied Housing Units | 19 | 100.0% |
| Renter-Occupied Housing Units | 0 | 0.0% |
| Total Occupied Housing Units | 19 | 100.0% |
Occupancy by Household Size in Russell Springs
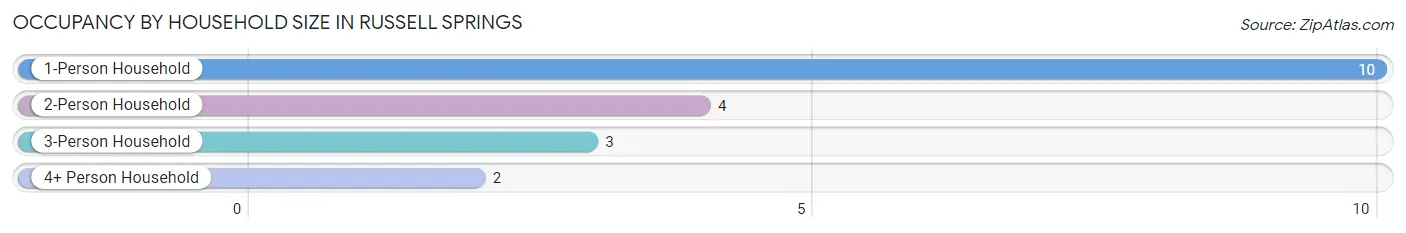
| Household Size | # Housing Units | % Housing Units |
| 1-Person Household | 10 | 52.6% |
| 2-Person Household | 4 | 21.0% |
| 3-Person Household | 3 | 15.8% |
| 4+ Person Household | 2 | 10.5% |
| Total Housing Units | 19 | 100.0% |
Occupancy by Ownership by Household Size in Russell Springs
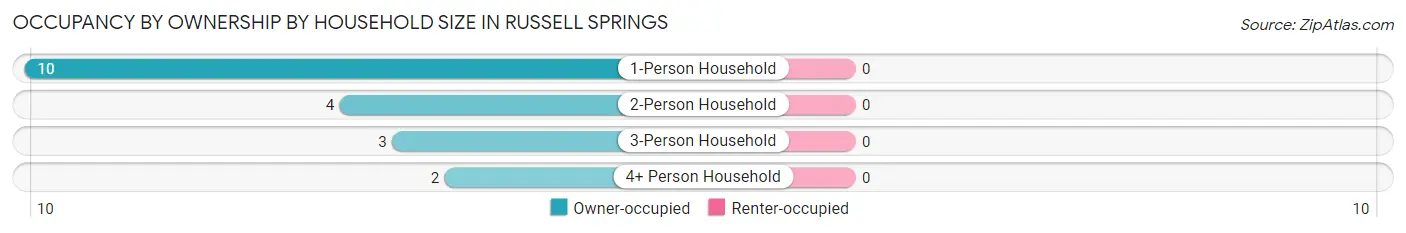
| Household Size | Owner-occupied | Renter-occupied |
| 1-Person Household | 10 (100.0%) | 0 (0.0%) |
| 2-Person Household | 4 (100.0%) | 0 (0.0%) |
| 3-Person Household | 3 (100.0%) | 0 (0.0%) |
| 4+ Person Household | 2 (100.0%) | 0 (0.0%) |
| Total Housing Units | 19 (100.0%) | 0 (0.0%) |
Occupancy by Educational Attainment in Russell Springs
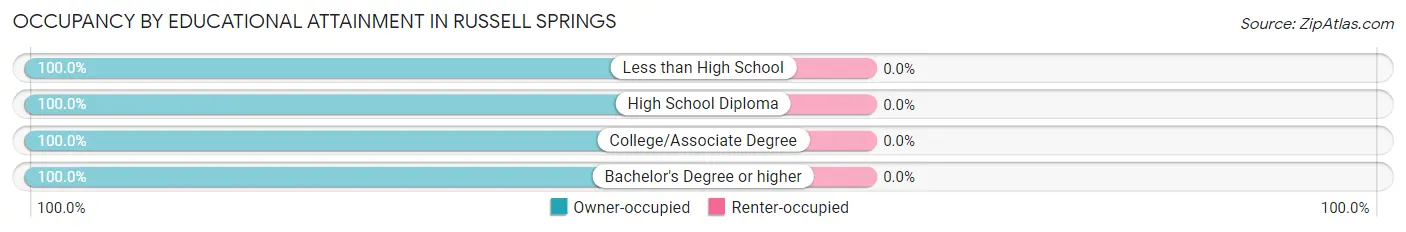
| Household Size | Owner-occupied | Renter-occupied |
| Less than High School | 2 (100.0%) | 0 (0.0%) |
| High School Diploma | 9 (100.0%) | 0 (0.0%) |
| College/Associate Degree | 3 (100.0%) | 0 (0.0%) |
| Bachelor's Degree or higher | 5 (100.0%) | 0 (0.0%) |
Occupancy by Age of Householder in Russell Springs
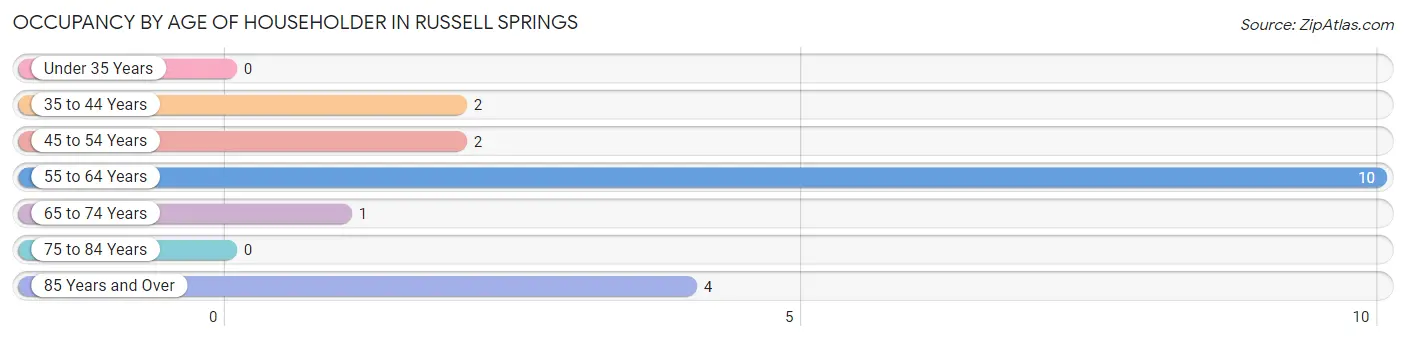
| Age Bracket | # Households | % Households |
| Under 35 Years | 0 | 0.0% |
| 35 to 44 Years | 2 | 10.5% |
| 45 to 54 Years | 2 | 10.5% |
| 55 to 64 Years | 10 | 52.6% |
| 65 to 74 Years | 1 | 5.3% |
| 75 to 84 Years | 0 | 0.0% |
| 85 Years and Over | 4 | 21.0% |
| Total | 19 | 100.0% |
Housing Finances in Russell Springs
Median Income by Occupancy in Russell Springs
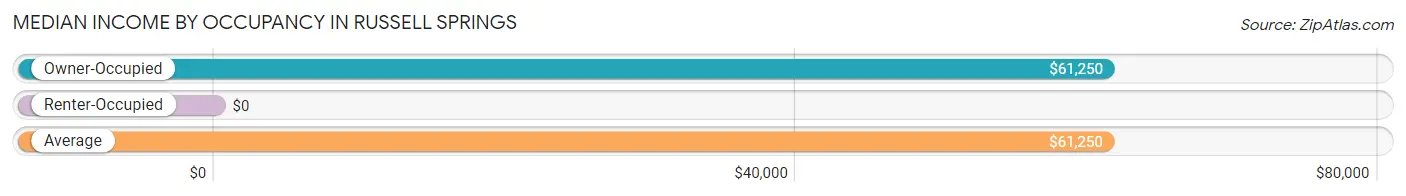
| Occupancy Type | # Households | Median Income |
| Owner-Occupied | 19 (100.0%) | $61,250 |
| Renter-Occupied | 0 (0.0%) | $0 |
| Average | 19 (100.0%) | $61,250 |
Occupancy by Householder Income Bracket in Russell Springs
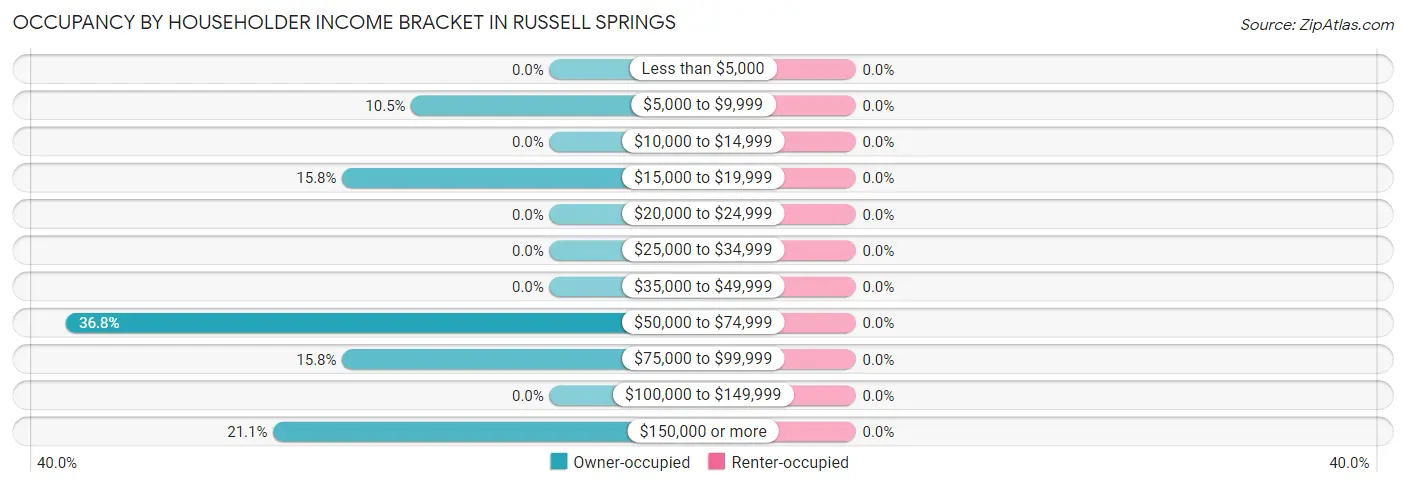
| Income Bracket | Owner-occupied | Renter-occupied |
| Less than $5,000 | 0 (0.0%) | 0 (0.0%) |
| $5,000 to $9,999 | 2 (10.5%) | 0 (0.0%) |
| $10,000 to $14,999 | 0 (0.0%) | 0 (0.0%) |
| $15,000 to $19,999 | 3 (15.8%) | 0 (0.0%) |
| $20,000 to $24,999 | 0 (0.0%) | 0 (0.0%) |
| $25,000 to $34,999 | 0 (0.0%) | 0 (0.0%) |
| $35,000 to $49,999 | 0 (0.0%) | 0 (0.0%) |
| $50,000 to $74,999 | 7 (36.8%) | 0 (0.0%) |
| $75,000 to $99,999 | 3 (15.8%) | 0 (0.0%) |
| $100,000 to $149,999 | 0 (0.0%) | 0 (0.0%) |
| $150,000 or more | 4 (21.0%) | 0 (0.0%) |
| Total | 19 (100.0%) | 0 (0.0%) |
Monthly Housing Cost Tiers in Russell Springs
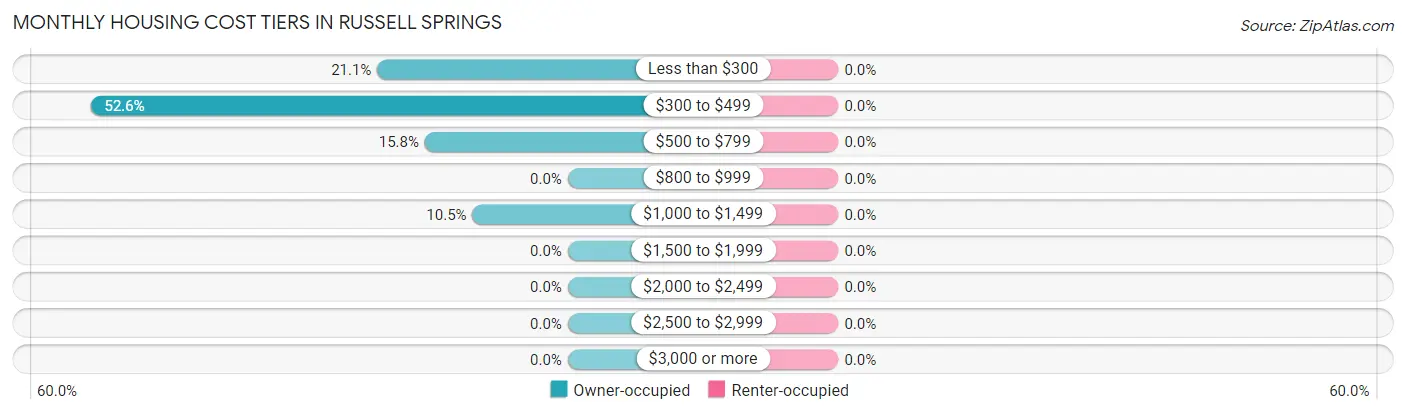
| Monthly Cost | Owner-occupied | Renter-occupied |
| Less than $300 | 4 (21.0%) | 0 (0.0%) |
| $300 to $499 | 10 (52.6%) | 0 (0.0%) |
| $500 to $799 | 3 (15.8%) | 0 (0.0%) |
| $800 to $999 | 0 (0.0%) | 0 (0.0%) |
| $1,000 to $1,499 | 2 (10.5%) | 0 (0.0%) |
| $1,500 to $1,999 | 0 (0.0%) | 0 (0.0%) |
| $2,000 to $2,499 | 0 (0.0%) | 0 (0.0%) |
| $2,500 to $2,999 | 0 (0.0%) | 0 (0.0%) |
| $3,000 or more | 0 (0.0%) | 0 (0.0%) |
| Total | 19 (100.0%) | 0 (0.0%) |
Physical Housing Characteristics in Russell Springs
Housing Structures in Russell Springs
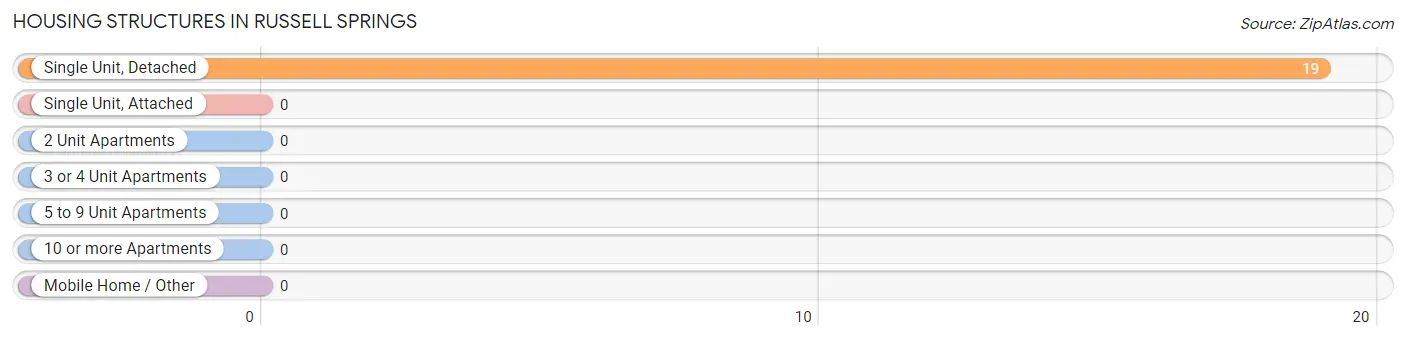
| Structure Type | # Housing Units | % Housing Units |
| Single Unit, Detached | 19 | 100.0% |
| Single Unit, Attached | 0 | 0.0% |
| 2 Unit Apartments | 0 | 0.0% |
| 3 or 4 Unit Apartments | 0 | 0.0% |
| 5 to 9 Unit Apartments | 0 | 0.0% |
| 10 or more Apartments | 0 | 0.0% |
| Mobile Home / Other | 0 | 0.0% |
| Total | 19 | 100.0% |
Housing Structures by Occupancy in Russell Springs
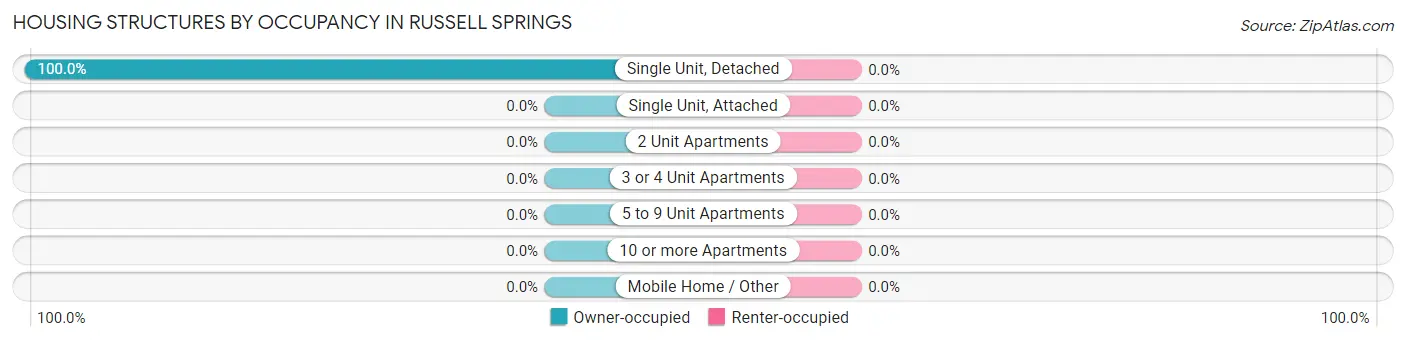
| Structure Type | Owner-occupied | Renter-occupied |
| Single Unit, Detached | 19 (100.0%) | 0 (0.0%) |
| Single Unit, Attached | 0 (0.0%) | 0 (0.0%) |
| 2 Unit Apartments | 0 (0.0%) | 0 (0.0%) |
| 3 or 4 Unit Apartments | 0 (0.0%) | 0 (0.0%) |
| 5 to 9 Unit Apartments | 0 (0.0%) | 0 (0.0%) |
| 10 or more Apartments | 0 (0.0%) | 0 (0.0%) |
| Mobile Home / Other | 0 (0.0%) | 0 (0.0%) |
| Total | 19 (100.0%) | 0 (0.0%) |
Housing Structures by Number of Rooms in Russell Springs
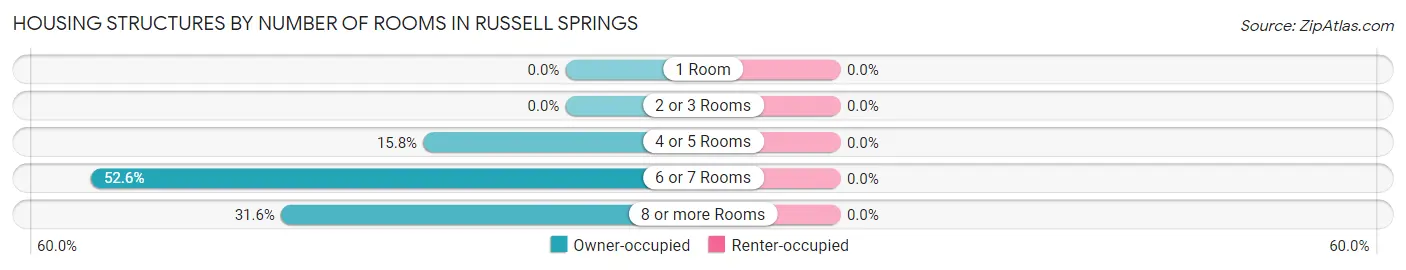
| Number of Rooms | Owner-occupied | Renter-occupied |
| 1 Room | 0 (0.0%) | 0 (0.0%) |
| 2 or 3 Rooms | 0 (0.0%) | 0 (0.0%) |
| 4 or 5 Rooms | 3 (15.8%) | 0 (0.0%) |
| 6 or 7 Rooms | 10 (52.6%) | 0 (0.0%) |
| 8 or more Rooms | 6 (31.6%) | 0 (0.0%) |
| Total | 19 (100.0%) | 0 (0.0%) |
Housing Structure by Heating Type in Russell Springs
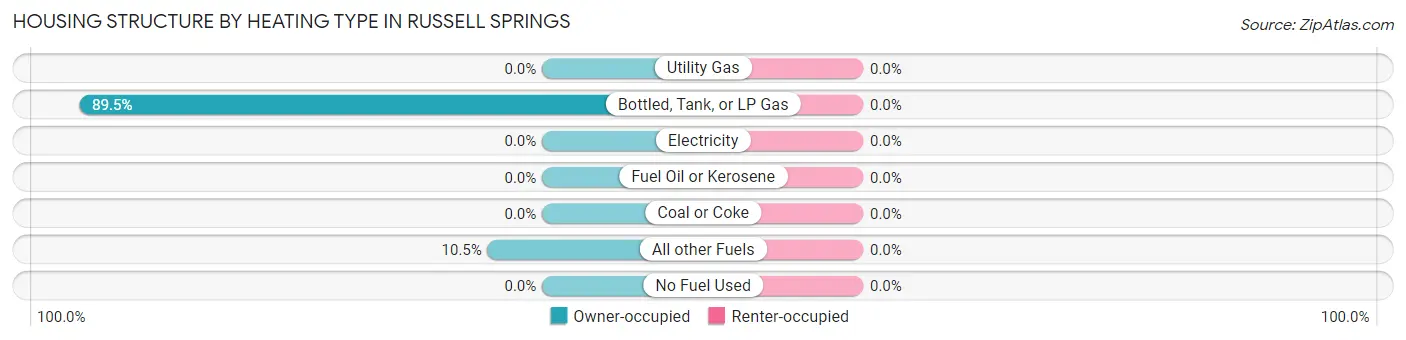
| Heating Type | Owner-occupied | Renter-occupied |
| Utility Gas | 0 (0.0%) | 0 (0.0%) |
| Bottled, Tank, or LP Gas | 17 (89.5%) | 0 (0.0%) |
| Electricity | 0 (0.0%) | 0 (0.0%) |
| Fuel Oil or Kerosene | 0 (0.0%) | 0 (0.0%) |
| Coal or Coke | 0 (0.0%) | 0 (0.0%) |
| All other Fuels | 2 (10.5%) | 0 (0.0%) |
| No Fuel Used | 0 (0.0%) | 0 (0.0%) |
| Total | 19 (100.0%) | 0 (0.0%) |
Household Vehicle Usage in Russell Springs
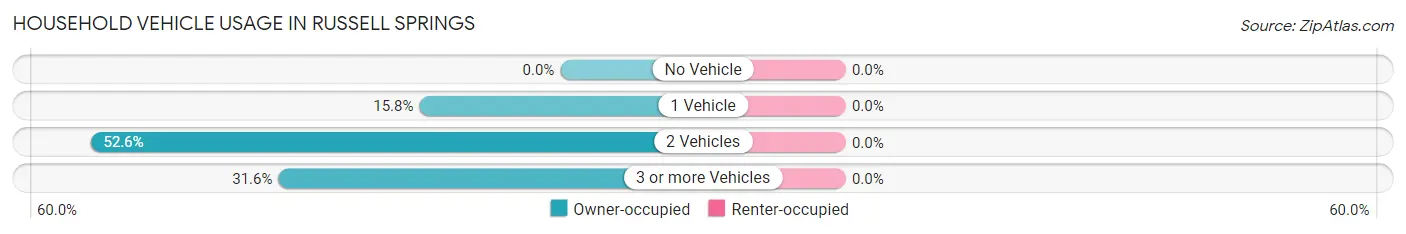
| Vehicles per Household | Owner-occupied | Renter-occupied |
| No Vehicle | 0 (0.0%) | 0 (0.0%) |
| 1 Vehicle | 3 (15.8%) | 0 (0.0%) |
| 2 Vehicles | 10 (52.6%) | 0 (0.0%) |
| 3 or more Vehicles | 6 (31.6%) | 0 (0.0%) |
| Total | 19 (100.0%) | 0 (0.0%) |
Real Estate & Mortgages in Russell Springs
Real Estate and Mortgage Overview in Russell Springs
| Characteristic | Without Mortgage | With Mortgage |
| Housing Units | 17 | 2 |
| Median Property Value | $62,500 | $0 |
| Median Household Income | $63,125 | $0 |
| Monthly Housing Costs | $408 | $0 |
| Real Estate Taxes | $490 | $0 |
Property Value by Mortgage Status in Russell Springs
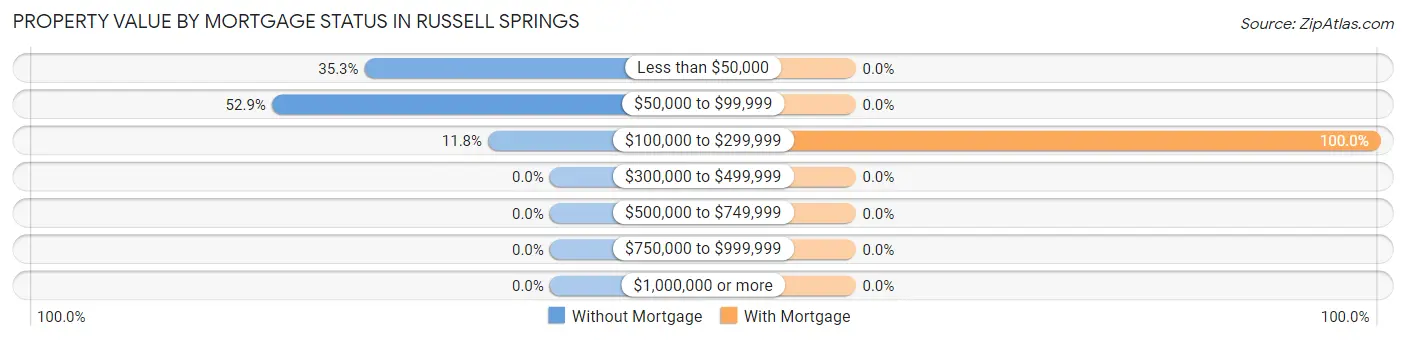
| Property Value | Without Mortgage | With Mortgage |
| Less than $50,000 | 6 (35.3%) | 0 (0.0%) |
| $50,000 to $99,999 | 9 (52.9%) | 0 (0.0%) |
| $100,000 to $299,999 | 2 (11.8%) | 2 (100.0%) |
| $300,000 to $499,999 | 0 (0.0%) | 0 (0.0%) |
| $500,000 to $749,999 | 0 (0.0%) | 0 (0.0%) |
| $750,000 to $999,999 | 0 (0.0%) | 0 (0.0%) |
| $1,000,000 or more | 0 (0.0%) | 0 (0.0%) |
| Total | 17 (100.0%) | 2 (100.0%) |
Household Income by Mortgage Status in Russell Springs
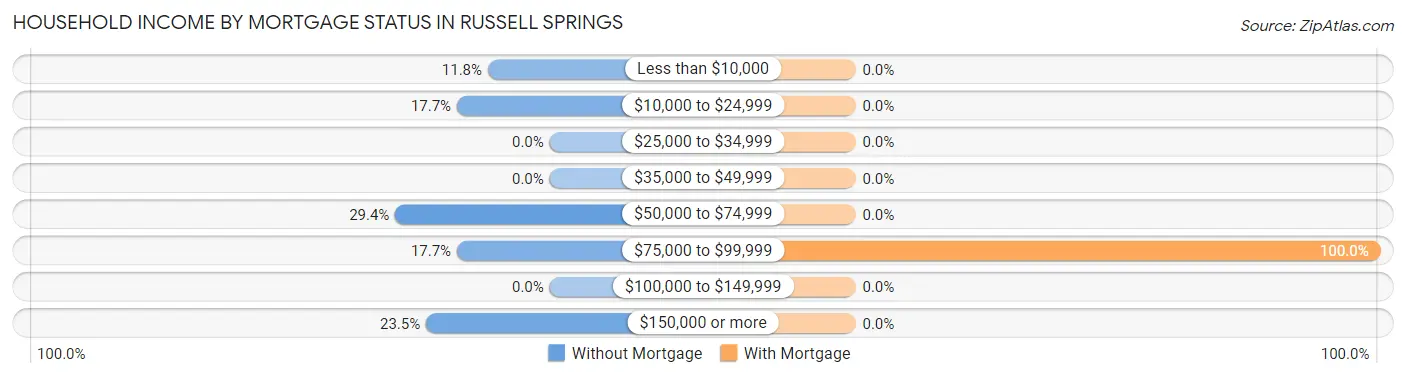
| Household Income | Without Mortgage | With Mortgage |
| Less than $10,000 | 2 (11.8%) | 0 (0.0%) |
| $10,000 to $24,999 | 3 (17.6%) | 0 (0.0%) |
| $25,000 to $34,999 | 0 (0.0%) | 0 (0.0%) |
| $35,000 to $49,999 | 0 (0.0%) | 0 (0.0%) |
| $50,000 to $74,999 | 5 (29.4%) | 0 (0.0%) |
| $75,000 to $99,999 | 3 (17.6%) | 2 (100.0%) |
| $100,000 to $149,999 | 0 (0.0%) | 0 (0.0%) |
| $150,000 or more | 4 (23.5%) | 0 (0.0%) |
| Total | 17 (100.0%) | 2 (100.0%) |
Property Value to Household Income Ratio in Russell Springs
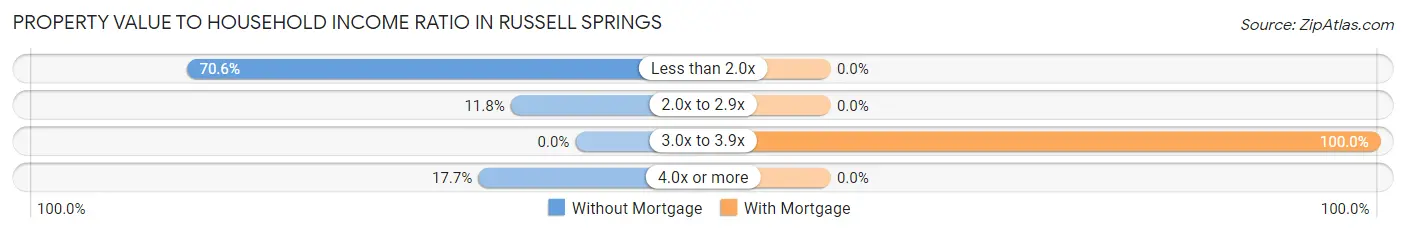
| Value-to-Income Ratio | Without Mortgage | With Mortgage |
| Less than 2.0x | 12 (70.6%) | 0 (0.0%) |
| 2.0x to 2.9x | 2 (11.8%) | 0 (0.0%) |
| 3.0x to 3.9x | 0 (0.0%) | 2 (100.0%) |
| 4.0x or more | 3 (17.6%) | 0 (0.0%) |
| Total | 17 (100.0%) | 2 (100.0%) |
Real Estate Taxes by Mortgage Status in Russell Springs
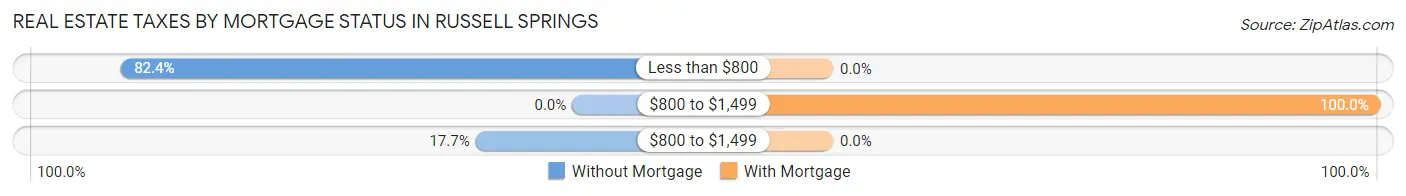
| Property Taxes | Without Mortgage | With Mortgage |
| Less than $800 | 14 (82.4%) | 0 (0.0%) |
| $800 to $1,499 | 0 (0.0%) | 2 (100.0%) |
| $800 to $1,499 | 3 (17.6%) | 0 (0.0%) |
| Total | 17 (100.0%) | 2 (100.0%) |
Health & Disability in Russell Springs
Health Insurance Coverage by Age in Russell Springs
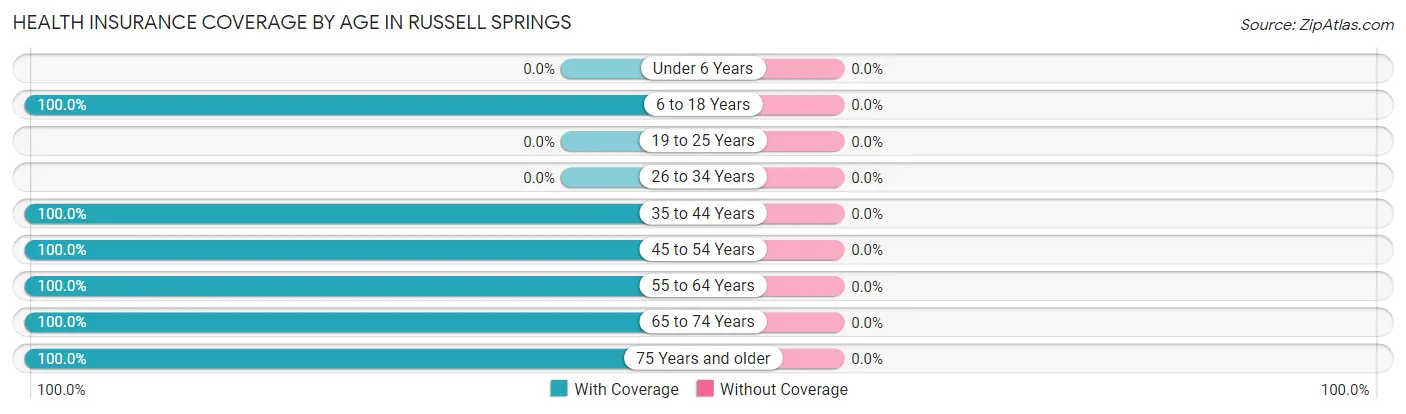
| Age Bracket | With Coverage | Without Coverage |
| Under 6 Years | 0 (0.0%) | 0 (0.0%) |
| 6 to 18 Years | 3 (100.0%) | 0 (0.0%) |
| 19 to 25 Years | 0 (0.0%) | 0 (0.0%) |
| 26 to 34 Years | 0 (0.0%) | 0 (0.0%) |
| 35 to 44 Years | 3 (100.0%) | 0 (0.0%) |
| 45 to 54 Years | 3 (100.0%) | 0 (0.0%) |
| 55 to 64 Years | 11 (100.0%) | 0 (0.0%) |
| 65 to 74 Years | 4 (100.0%) | 0 (0.0%) |
| 75 Years and older | 4 (100.0%) | 0 (0.0%) |
| Total | 28 (100.0%) | 0 (0.0%) |
Health Insurance Coverage by Citizenship Status in Russell Springs
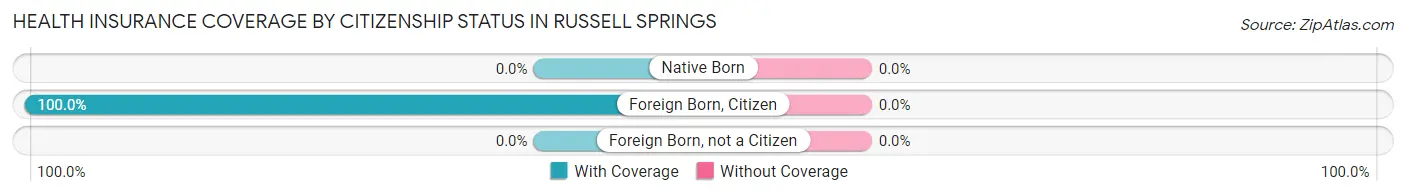
| Citizenship Status | With Coverage | Without Coverage |
| Native Born | 0 (0.0%) | 0 (0.0%) |
| Foreign Born, Citizen | 3 (100.0%) | 0 (0.0%) |
| Foreign Born, not a Citizen | 0 (0.0%) | 0 (0.0%) |
Health Insurance Coverage by Household Income in Russell Springs
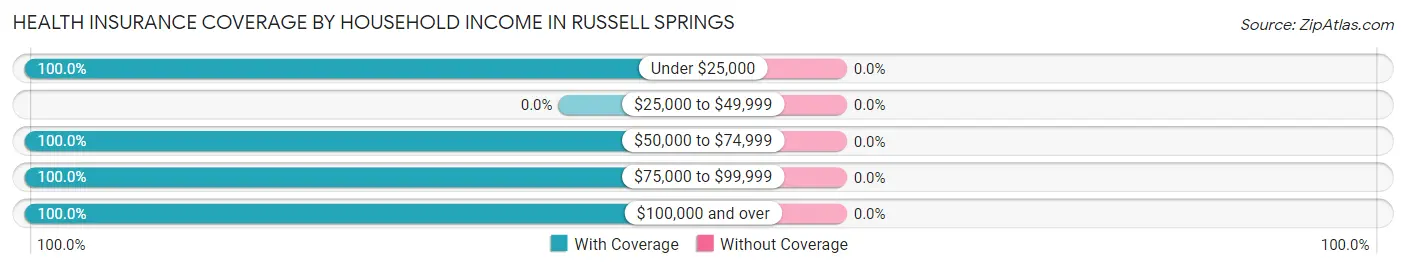
| Household Income | With Coverage | Without Coverage |
| Under $25,000 | 6 (100.0%) | 0 (0.0%) |
| $25,000 to $49,999 | 0 (0.0%) | 0 (0.0%) |
| $50,000 to $74,999 | 12 (100.0%) | 0 (0.0%) |
| $75,000 to $99,999 | 5 (100.0%) | 0 (0.0%) |
| $100,000 and over | 5 (100.0%) | 0 (0.0%) |
Public vs Private Health Insurance Coverage by Age in Russell Springs
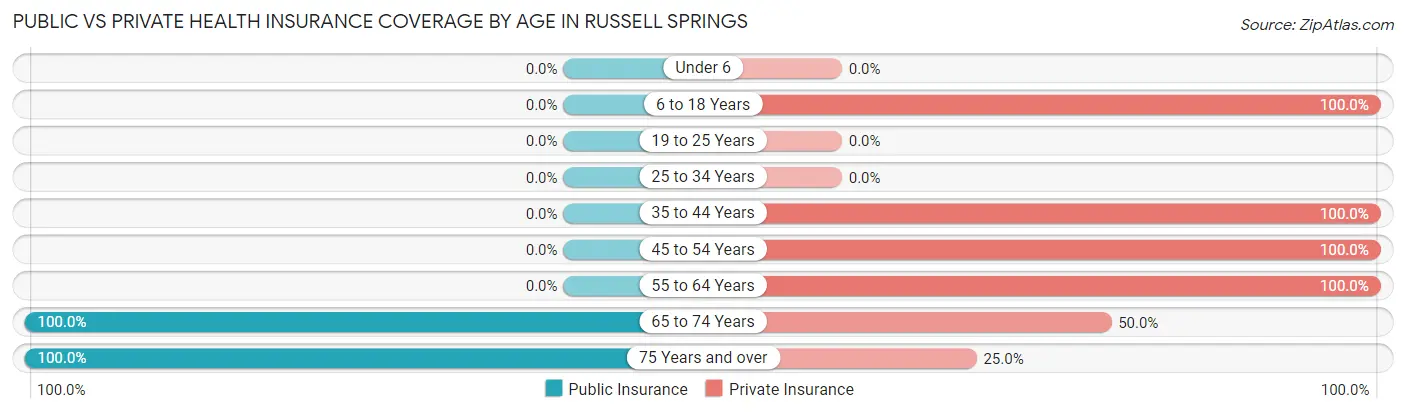
| Age Bracket | Public Insurance | Private Insurance |
| Under 6 | 0 (0.0%) | 0 (0.0%) |
| 6 to 18 Years | 0 (0.0%) | 3 (100.0%) |
| 19 to 25 Years | 0 (0.0%) | 0 (0.0%) |
| 25 to 34 Years | 0 (0.0%) | 0 (0.0%) |
| 35 to 44 Years | 0 (0.0%) | 3 (100.0%) |
| 45 to 54 Years | 0 (0.0%) | 3 (100.0%) |
| 55 to 64 Years | 0 (0.0%) | 11 (100.0%) |
| 65 to 74 Years | 4 (100.0%) | 2 (50.0%) |
| 75 Years and over | 4 (100.0%) | 1 (25.0%) |
| Total | 8 (28.6%) | 23 (82.1%) |
Disability Status by Sex by Age in Russell Springs
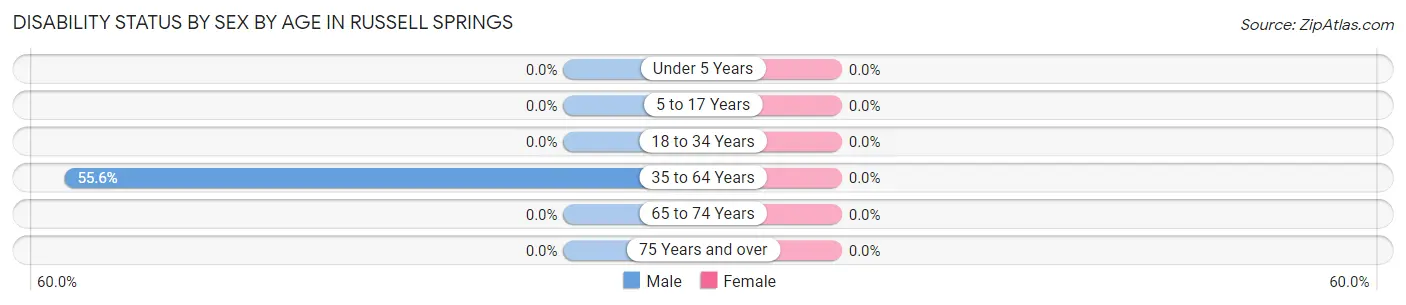
| Age Bracket | Male | Female |
| Under 5 Years | 0 (0.0%) | 0 (0.0%) |
| 5 to 17 Years | 0 (0.0%) | 0 (0.0%) |
| 18 to 34 Years | 0 (0.0%) | 0 (0.0%) |
| 35 to 64 Years | 5 (55.6%) | 0 (0.0%) |
| 65 to 74 Years | 0 (0.0%) | 0 (0.0%) |
| 75 Years and over | 0 (0.0%) | 0 (0.0%) |
Disability Class by Sex by Age in Russell Springs
Disability Class: Hearing Difficulty
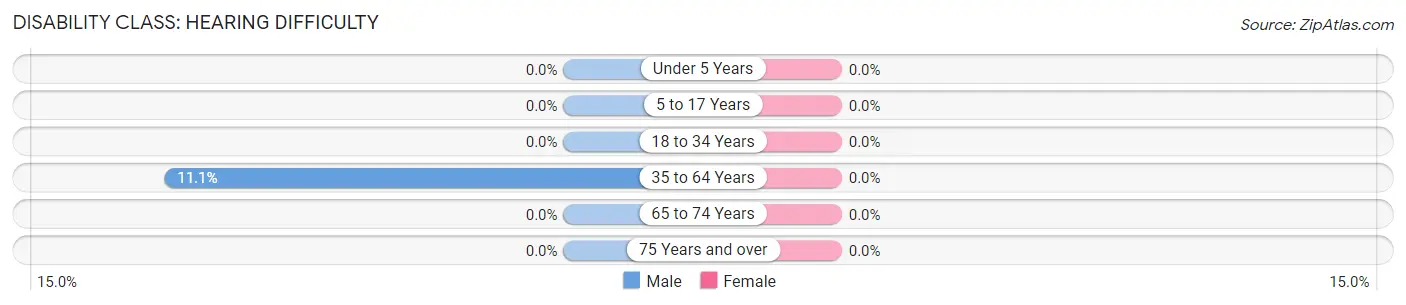
| Age Bracket | Male | Female |
| Under 5 Years | 0 (0.0%) | 0 (0.0%) |
| 5 to 17 Years | 0 (0.0%) | 0 (0.0%) |
| 18 to 34 Years | 0 (0.0%) | 0 (0.0%) |
| 35 to 64 Years | 1 (11.1%) | 0 (0.0%) |
| 65 to 74 Years | 0 (0.0%) | 0 (0.0%) |
| 75 Years and over | 0 (0.0%) | 0 (0.0%) |
Disability Class: Vision Difficulty
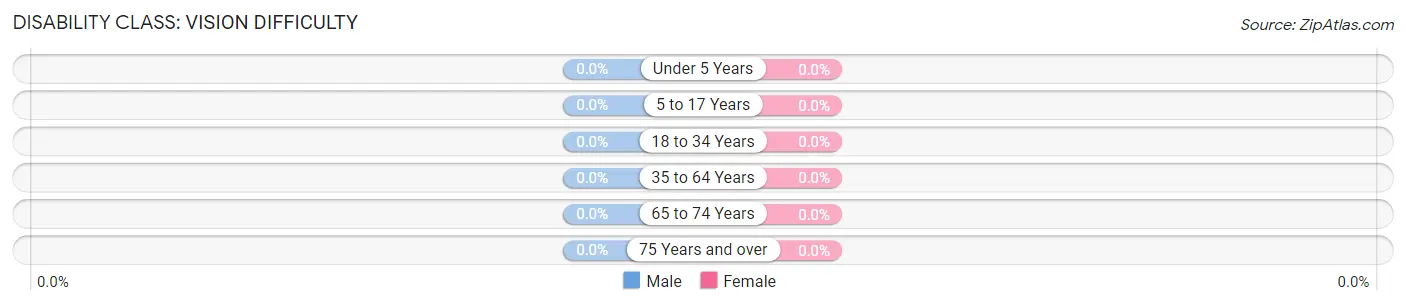
| Age Bracket | Male | Female |
| Under 5 Years | 0 (0.0%) | 0 (0.0%) |
| 5 to 17 Years | 0 (0.0%) | 0 (0.0%) |
| 18 to 34 Years | 0 (0.0%) | 0 (0.0%) |
| 35 to 64 Years | 0 (0.0%) | 0 (0.0%) |
| 65 to 74 Years | 0 (0.0%) | 0 (0.0%) |
| 75 Years and over | 0 (0.0%) | 0 (0.0%) |
Disability Class: Cognitive Difficulty
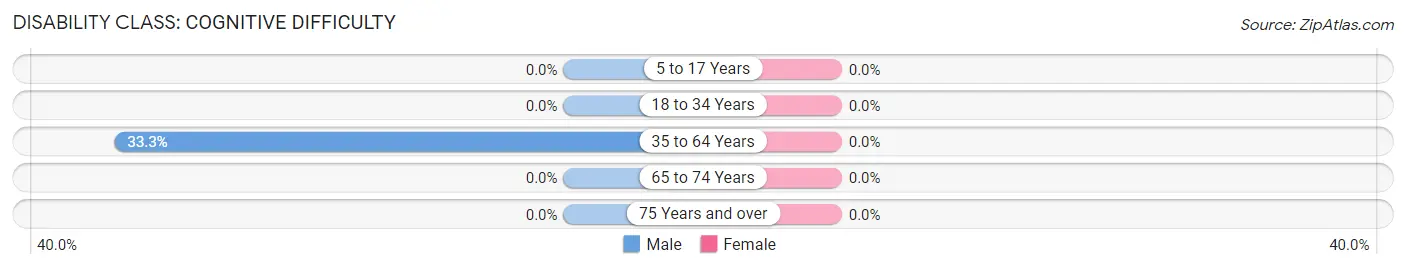
| Age Bracket | Male | Female |
| 5 to 17 Years | 0 (0.0%) | 0 (0.0%) |
| 18 to 34 Years | 0 (0.0%) | 0 (0.0%) |
| 35 to 64 Years | 3 (33.3%) | 0 (0.0%) |
| 65 to 74 Years | 0 (0.0%) | 0 (0.0%) |
| 75 Years and over | 0 (0.0%) | 0 (0.0%) |
Disability Class: Ambulatory Difficulty
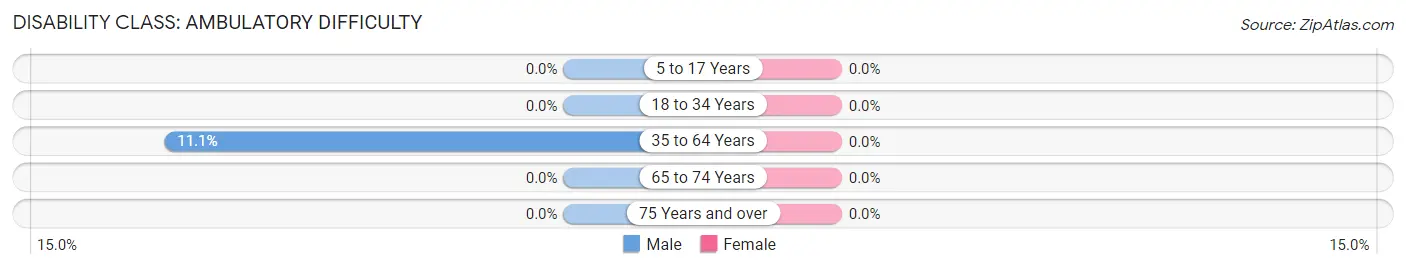
| Age Bracket | Male | Female |
| 5 to 17 Years | 0 (0.0%) | 0 (0.0%) |
| 18 to 34 Years | 0 (0.0%) | 0 (0.0%) |
| 35 to 64 Years | 1 (11.1%) | 0 (0.0%) |
| 65 to 74 Years | 0 (0.0%) | 0 (0.0%) |
| 75 Years and over | 0 (0.0%) | 0 (0.0%) |
Disability Class: Self-Care Difficulty
| Age Bracket | Male | Female |
| 5 to 17 Years | 0 (0.0%) | 0 (0.0%) |
| 18 to 34 Years | 0 (0.0%) | 0 (0.0%) |
| 35 to 64 Years | 0 (0.0%) | 0 (0.0%) |
| 65 to 74 Years | 0 (0.0%) | 0 (0.0%) |
| 75 Years and over | 0 (0.0%) | 0 (0.0%) |
Technology Access in Russell Springs
Computing Device Access in Russell Springs
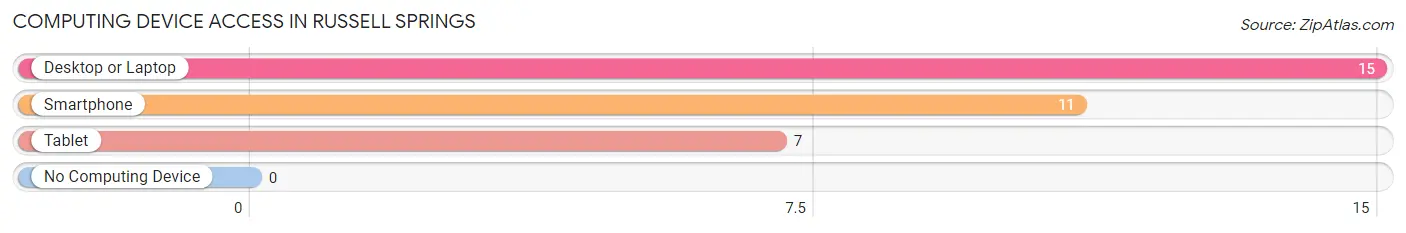
| Device Type | # Households | % Households |
| Desktop or Laptop | 15 | 78.9% |
| Smartphone | 11 | 57.9% |
| Tablet | 7 | 36.8% |
| No Computing Device | 0 | 0.0% |
| Total | 19 | 100.0% |
Internet Access in Russell Springs
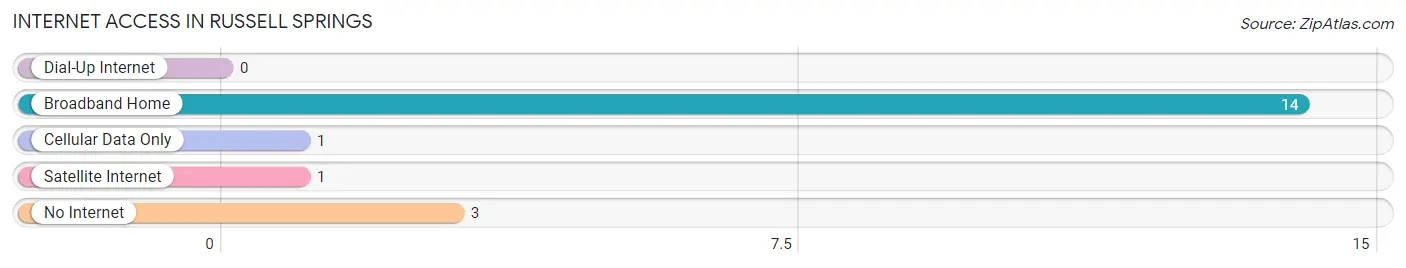
| Internet Type | # Households | % Households |
| Dial-Up Internet | 0 | 0.0% |
| Broadband Home | 14 | 73.7% |
| Cellular Data Only | 1 | 5.3% |
| Satellite Internet | 1 | 5.3% |
| No Internet | 3 | 15.8% |
| Total | 19 | 100.0% |
Russell Springs Summary
History
Russell Springs is a small city located in the state of Kansas. It is situated in the western part of the state, in the county of Russell. The city was founded in 1871 by a group of settlers from the nearby town of Russellville. The settlers were looking for a place to settle and start a new life. The city was named after the nearby springs, which provided a source of water for the settlers.
The city of Russell Springs was officially incorporated in 1872. At the time, the population was only around 200 people. The city quickly grew in size and by 1880, the population had grown to over 1,000 people.
The city of Russell Springs was an important stop on the Santa Fe Trail, which was a major route for settlers heading west. The city was also a major stop on the Union Pacific Railroad, which connected the city to the rest of the country.
The city of Russell Springs experienced a period of growth in the late 19th and early 20th centuries. The city was home to several businesses, including a flour mill, a brickyard, a lumber yard, and a hotel. The city also had a number of churches, schools, and other public buildings.
In the early 20th century, the city of Russell Springs experienced a period of decline. The Great Depression and World War II caused many businesses to close and the population of the city decreased. The city experienced a period of revitalization in the 1950s and 1960s, when new businesses opened and the population began to grow again.
Today, the city of Russell Springs is a small but vibrant community. The population is around 1,500 people and the city is home to a variety of businesses, including restaurants, retail stores, and professional services. The city is also home to a number of parks and recreational facilities.
Geography
Russell Springs is located in the western part of the state of Kansas. The city is situated in the county of Russell, which is part of the Great Plains region of the United States. The city is located at an elevation of 1,068 feet above sea level.
The city of Russell Springs is located in a flat, open area of the Great Plains. The city is surrounded by farmland and is located near the Smoky Hill River. The city is located approximately 50 miles west of the state capital of Topeka.
The climate in Russell Springs is classified as humid continental. The summers are hot and humid, with temperatures reaching into the 90s. The winters are cold and dry, with temperatures dropping below freezing. The city receives an average of 25 inches of precipitation per year.
Economy
The economy of Russell Springs is largely based on agriculture. The city is located in an area of the state that is known for its fertile soil and abundant water supply. The city is home to several large farms that produce a variety of crops, including corn, wheat, soybeans, and sorghum.
The city is also home to several businesses, including restaurants, retail stores, and professional services. The city is home to a number of manufacturing companies, including a plastics factory and a metal fabrication plant. The city is also home to a number of government offices, including the county courthouse and the state highway patrol.
Demographics
The population of Russell Springs is approximately 1,500 people. The city has a diverse population, with people of various racial and ethnic backgrounds. The majority of the population is white, followed by African Americans, Hispanics, and Asians.
The median household income in Russell Springs is $41,000. The median home value is $90,000. The city has a low unemployment rate of 3.7%. The poverty rate is 11.3%.
Conclusion
Russell Springs is a small city located in the western part of the state of Kansas. The city was founded in 1871 and has a population of approximately 1,500 people. The economy of the city is largely based on agriculture and the city is home to several businesses, including restaurants, retail stores, and professional services. The city has a diverse population, with people of various racial and ethnic backgrounds. The median household income in Russell Springs is $41,000 and the median home value is $90,000. The city has a low unemployment rate of 3.7% and a poverty rate of 11.3%.
Common Questions
What is Per Capita Income in Russell Springs?
Per Capita income in Russell Springs is $65,254.
What is the Median Family Income in Russell Springs?
Median Family Income in Russell Springs is $71,250.
What is the Median Household income in Russell Springs?
Median Household Income in Russell Springs is $61,250.
What is Inequality or Gini Index in Russell Springs?
Inequality or Gini Index in Russell Springs is 0.52.
What is the Total Population of Russell Springs?
Total Population of Russell Springs is 28.
What is the Total Male Population of Russell Springs?
Total Male Population of Russell Springs is 13.
What is the Total Female Population of Russell Springs?
Total Female Population of Russell Springs is 15.
What is the Ratio of Males per 100 Females in Russell Springs?
There are 86.67 Males per 100 Females in Russell Springs.
What is the Ratio of Females per 100 Males in Russell Springs?
There are 115.38 Females per 100 Males in Russell Springs.
What is the Median Population Age in Russell Springs?
Median Population Age in Russell Springs is 63.0 Years.
What is the Average Family Size in Russell Springs
Average Family Size in Russell Springs is 2.0 People.
What is the Average Household Size in Russell Springs
Average Household Size in Russell Springs is 1.5 People.
How Large is the Labor Force in Russell Springs?
There are 13 People in the Labor Forcein in Russell Springs.
What is the Percentage of People in the Labor Force in Russell Springs?
52.0% of People are in the Labor Force in Russell Springs.