Zip Codes with the Highest Percentage of Families with Income Below $10,000 in Lenexa, KS
RELATED REPORTS & OPTIONS
Family Income | $0-10k
Lenexa
Compare Zip Codes
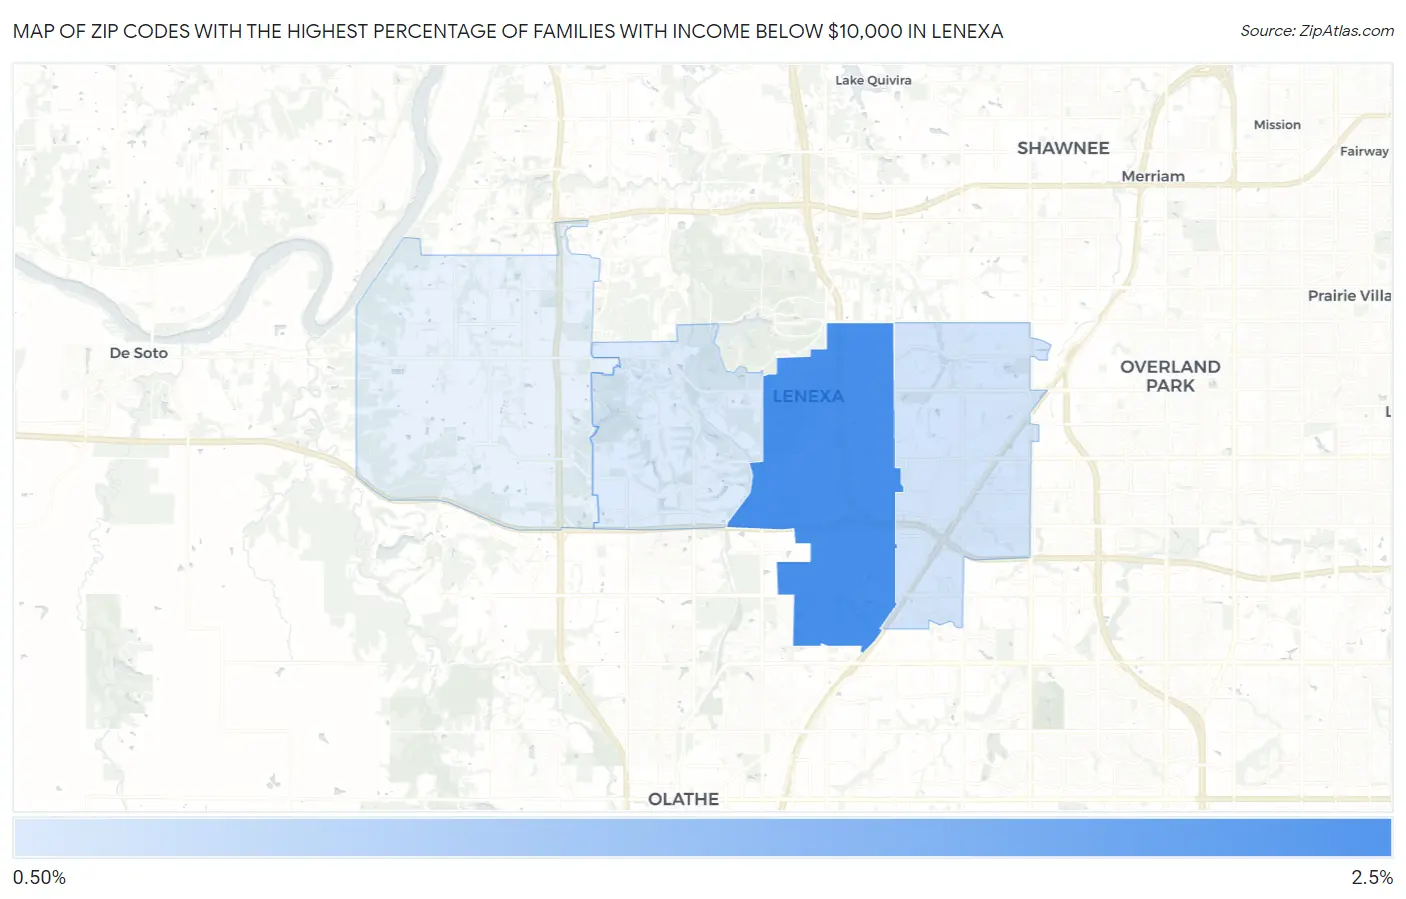
Map of Zip Codes with the Highest Percentage of Families with Income Below $10,000 in Lenexa
1.1%
2.5%
Zip Codes with the Highest Percentage of Families with Income Below $10,000 in Lenexa, KS
| Zip Code | Families with Income < $10k | vs State | vs National | |
| 1. | 66219 | 2.5% | 2.6%(-0.100)#223 | 3.1%(-0.600)#13,182 |
| 2. | 66215 | 1.2% | 2.6%(-1.40)#359 | 3.1%(-1.90)#19,295 |
| 3. | 66220 | 1.1% | 2.6%(-1.50)#374 | 3.1%(-2.00)#19,922 |
1
Common Questions
What are the Top 3 Zip Codes with the Highest Percentage of Families with Income Below $10,000 in Lenexa, KS?
Top 3 Zip Codes with the Highest Percentage of Families with Income Below $10,000 in Lenexa, KS are:
What zip code has the Highest Percentage of Families with Income Below $10,000 in Lenexa, KS?
66219 has the Highest Percentage of Families with Income Below $10,000 in Lenexa, KS with 2.5%.
What is the Percentage of Families with Income Below $10,000 in Lenexa, KS?
Percentage of Families with Income Below $10,000 in Lenexa is 1.8%.
What is the Percentage of Families with Income Below $10,000 in Kansas?
Percentage of Families with Income Below $10,000 in Kansas is 2.6%.
What is the Percentage of Families with Income Below $10,000 in the United States?
Percentage of Families with Income Below $10,000 in the United States is 3.1%.