Zip Codes with the Highest Percentage of Self-Employed / Incorporated in Colorado
RELATED REPORTS & OPTIONS
Self-Employed / Incorporated
Colorado
Compare Zip Codes
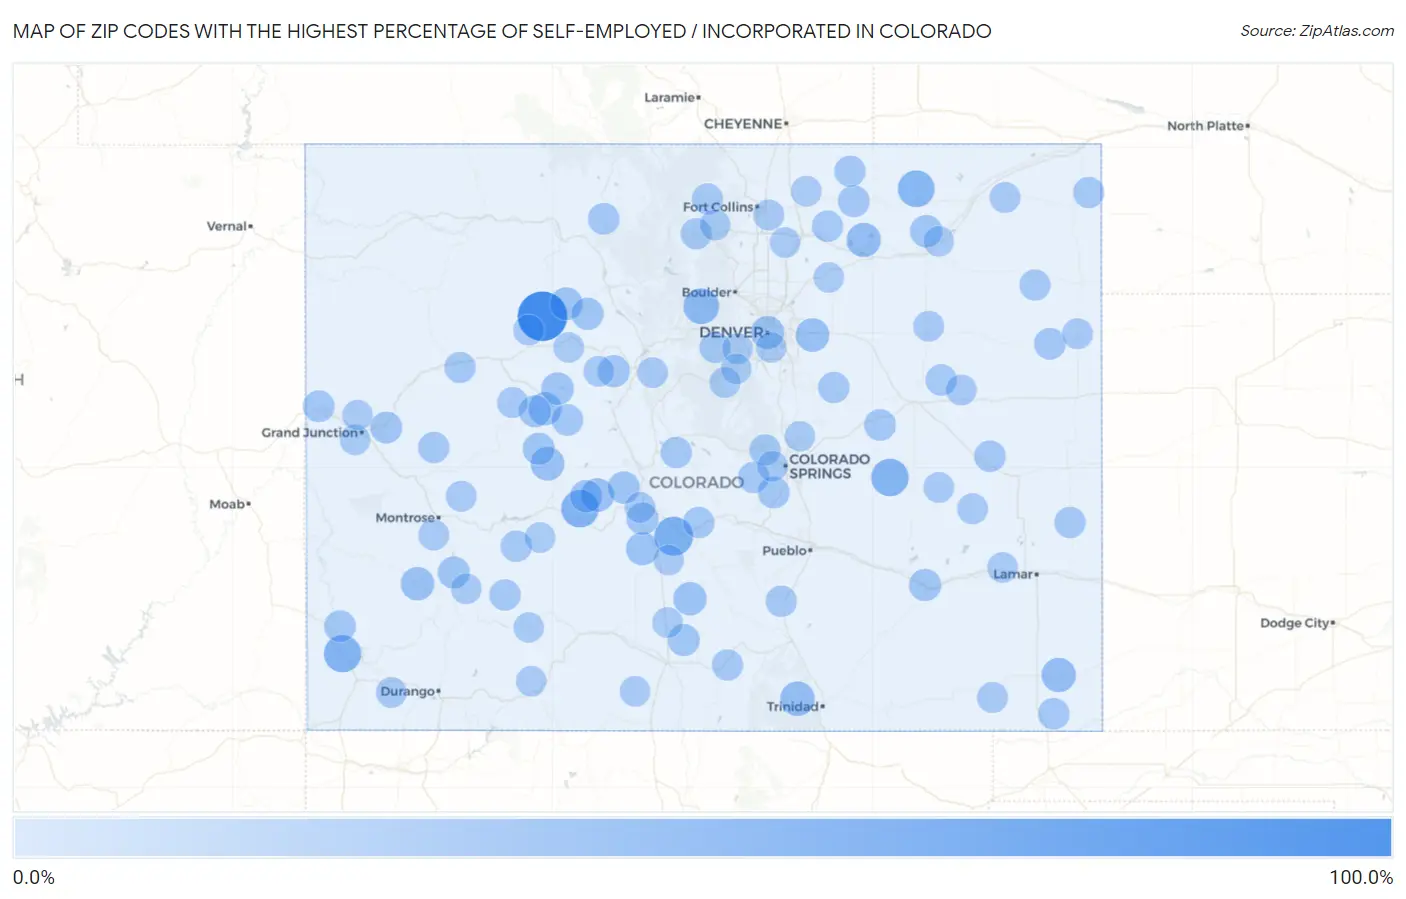
Map of Zip Codes with the Highest Percentage of Self-Employed / Incorporated in Colorado
0.0%
100.0%
Zip Codes with the Highest Percentage of Self-Employed / Incorporated in Colorado
| Zip Code | % Self-Employed / Incorporated | vs State | vs National | |
| 1. | 80426 | 100.0% | 5.1%(+94.9)#1 | 3.8%(+96.2)#14 |
| 2. | 81222 | 47.9% | 5.1%(+42.8)#2 | 3.8%(+44.1)#94 |
| 3. | 81239 | 42.1% | 5.1%(+37.0)#3 | 3.8%(+38.3)#117 |
| 4. | 80833 | 41.4% | 5.1%(+36.3)#4 | 3.8%(+37.6)#122 |
| 5. | 81335 | 40.7% | 5.1%(+35.7)#5 | 3.8%(+36.9)#126 |
| 6. | 80754 | 38.3% | 5.1%(+33.3)#6 | 3.8%(+34.5)#140 |
| 7. | 80474 | 33.1% | 5.1%(+28.0)#7 | 3.8%(+29.3)#183 |
| 8. | 81024 | 27.8% | 5.1%(+22.7)#8 | 3.8%(+24.0)#255 |
| 9. | 81087 | 26.6% | 5.1%(+21.5)#9 | 3.8%(+22.7)#277 |
| 10. | 80649 | 26.5% | 5.1%(+21.4)#10 | 3.8%(+22.7)#281 |
| 11. | 81224 | 23.7% | 5.1%(+18.7)#11 | 3.8%(+19.9)#348 |
| 12. | 80137 | 23.2% | 5.1%(+18.1)#12 | 3.8%(+19.4)#365 |
| 13. | 81241 | 23.1% | 5.1%(+18.0)#13 | 3.8%(+19.3)#370 |
| 14. | 81430 | 22.6% | 5.1%(+17.6)#14 | 3.8%(+18.8)#389 |
| 15. | 81131 | 21.7% | 5.1%(+16.7)#15 | 3.8%(+17.9)#420 |
| 16. | 80290 | 21.7% | 5.1%(+16.6)#16 | 3.8%(+17.9)#426 |
| 17. | 81615 | 21.3% | 5.1%(+16.2)#17 | 3.8%(+17.4)#437 |
| 18. | 81155 | 20.5% | 5.1%(+15.4)#18 | 3.8%(+16.7)#483 |
| 19. | 80463 | 19.3% | 5.1%(+14.2)#19 | 3.8%(+15.5)#537 |
| 20. | 81621 | 18.6% | 5.1%(+13.5)#20 | 3.8%(+14.8)#580 |
| 21. | 81237 | 17.9% | 5.1%(+12.8)#21 | 3.8%(+14.1)#632 |
| 22. | 80750 | 17.7% | 5.1%(+12.7)#22 | 3.8%(+13.9)#644 |
| 23. | 81236 | 17.4% | 5.1%(+12.3)#23 | 3.8%(+13.6)#671 |
| 24. | 81654 | 16.7% | 5.1%(+11.6)#24 | 3.8%(+12.8)#735 |
| 25. | 81077 | 16.5% | 5.1%(+11.4)#25 | 3.8%(+12.7)#759 |
| 26. | 80423 | 16.3% | 5.1%(+11.3)#26 | 3.8%(+12.5)#775 |
| 27. | 81242 | 16.2% | 5.1%(+11.2)#27 | 3.8%(+12.4)#787 |
| 28. | 81432 | 16.2% | 5.1%(+11.1)#28 | 3.8%(+12.4)#790 |
| 29. | 81649 | 16.2% | 5.1%(+11.1)#29 | 3.8%(+12.4)#793 |
| 30. | 81146 | 15.7% | 5.1%(+10.6)#30 | 3.8%(+11.9)#857 |
| 31. | 81225 | 15.7% | 5.1%(+10.6)#31 | 3.8%(+11.9)#859 |
| 32. | 81526 | 15.3% | 5.1%(+10.3)#32 | 3.8%(+11.5)#905 |
| 33. | 80926 | 14.9% | 5.1%(+9.81)#33 | 3.8%(+11.1)#978 |
| 34. | 81320 | 14.9% | 5.1%(+9.80)#34 | 3.8%(+11.1)#979 |
| 35. | 80832 | 14.8% | 5.1%(+9.74)#35 | 3.8%(+11.0)#985 |
| 36. | 81525 | 14.7% | 5.1%(+9.64)#36 | 3.8%(+10.9)#1,001 |
| 37. | 80611 | 14.1% | 5.1%(+9.06)#37 | 3.8%(+10.3)#1,106 |
| 38. | 80824 | 14.1% | 5.1%(+9.05)#38 | 3.8%(+10.3)#1,108 |
| 39. | 80430 | 13.9% | 5.1%(+8.81)#39 | 3.8%(+10.1)#1,157 |
| 40. | 80862 | 13.6% | 5.1%(+8.56)#40 | 3.8%(+9.82)#1,217 |
| 41. | 81611 | 13.3% | 5.1%(+8.25)#41 | 3.8%(+9.52)#1,257 |
| 42. | 81029 | 13.2% | 5.1%(+8.08)#42 | 3.8%(+9.34)#1,287 |
| 43. | 80813 | 12.9% | 5.1%(+7.86)#43 | 3.8%(+9.12)#1,328 |
| 44. | 80818 | 12.8% | 5.1%(+7.74)#44 | 3.8%(+9.00)#1,349 |
| 45. | 80117 | 12.8% | 5.1%(+7.69)#45 | 3.8%(+8.95)#1,366 |
| 46. | 81235 | 12.8% | 5.1%(+7.69)#46 | 3.8%(+8.95)#1,367 |
| 47. | 81223 | 12.7% | 5.1%(+7.62)#47 | 3.8%(+8.88)#1,386 |
| 48. | 81069 | 12.6% | 5.1%(+7.48)#48 | 3.8%(+8.74)#1,426 |
| 49. | 81243 | 12.5% | 5.1%(+7.42)#49 | 3.8%(+8.68)#1,448 |
| 50. | 80449 | 12.5% | 5.1%(+7.39)#50 | 3.8%(+8.65)#1,455 |
| 51. | 81133 | 12.5% | 5.1%(+7.38)#51 | 3.8%(+8.64)#1,460 |
| 52. | 81652 | 12.5% | 5.1%(+7.38)#52 | 3.8%(+8.64)#1,461 |
| 53. | 80819 | 12.4% | 5.1%(+7.36)#53 | 3.8%(+8.62)#1,462 |
| 54. | 80729 | 12.4% | 5.1%(+7.36)#54 | 3.8%(+8.62)#1,463 |
| 55. | 80624 | 12.4% | 5.1%(+7.35)#55 | 3.8%(+8.61)#1,467 |
| 56. | 81413 | 12.4% | 5.1%(+7.31)#56 | 3.8%(+8.57)#1,475 |
| 57. | 81071 | 12.2% | 5.1%(+7.17)#57 | 3.8%(+8.43)#1,507 |
| 58. | 80721 | 12.2% | 5.1%(+7.10)#58 | 3.8%(+8.36)#1,525 |
| 59. | 80517 | 11.7% | 5.1%(+6.60)#59 | 3.8%(+7.87)#1,664 |
| 60. | 80439 | 11.6% | 5.1%(+6.50)#60 | 3.8%(+7.76)#1,698 |
| 61. | 80759 | 11.4% | 5.1%(+6.31)#61 | 3.8%(+7.58)#1,750 |
| 62. | 80512 | 11.2% | 5.1%(+6.15)#62 | 3.8%(+7.42)#1,795 |
| 63. | 80547 | 11.0% | 5.1%(+5.89)#63 | 3.8%(+7.15)#1,913 |
| 64. | 81064 | 10.9% | 5.1%(+5.79)#64 | 3.8%(+7.05)#1,948 |
| 65. | 81623 | 10.7% | 5.1%(+5.62)#65 | 3.8%(+6.88)#2,022 |
| 66. | 81403 | 10.7% | 5.1%(+5.57)#66 | 3.8%(+6.84)#2,040 |
| 67. | 81637 | 10.6% | 5.1%(+5.55)#67 | 3.8%(+6.81)#2,053 |
| 68. | 81045 | 10.5% | 5.1%(+5.45)#68 | 3.8%(+6.71)#2,093 |
| 69. | 80728 | 10.5% | 5.1%(+5.43)#69 | 3.8%(+6.69)#2,095 |
| 70. | 80804 | 10.3% | 5.1%(+5.24)#70 | 3.8%(+6.50)#2,166 |
| 71. | 81415 | 10.3% | 5.1%(+5.20)#71 | 3.8%(+6.46)#2,182 |
| 72. | 80470 | 10.3% | 5.1%(+5.20)#72 | 3.8%(+6.46)#2,187 |
| 73. | 80735 | 10.2% | 5.1%(+5.16)#73 | 3.8%(+6.42)#2,202 |
| 74. | 80829 | 10.2% | 5.1%(+5.13)#74 | 3.8%(+6.39)#2,219 |
| 75. | 81201 | 10.1% | 5.1%(+5.06)#75 | 3.8%(+6.33)#2,244 |
| 76. | 80757 | 10.1% | 5.1%(+5.02)#76 | 3.8%(+6.28)#2,266 |
| 77. | 81645 | 10.0% | 5.1%(+4.90)#77 | 3.8%(+6.17)#2,329 |
| 78. | 80454 | 9.9% | 5.1%(+4.82)#78 | 3.8%(+6.08)#2,377 |
| 79. | 80424 | 9.9% | 5.1%(+4.78)#79 | 3.8%(+6.04)#2,389 |
| 80. | 80823 | 9.7% | 5.1%(+4.60)#80 | 3.8%(+5.86)#2,478 |
| 81. | 81328 | 9.7% | 5.1%(+4.59)#81 | 3.8%(+5.85)#2,483 |
| 82. | 81427 | 9.6% | 5.1%(+4.53)#82 | 3.8%(+5.79)#2,530 |
| 83. | 80532 | 9.5% | 5.1%(+4.45)#83 | 3.8%(+5.71)#2,578 |
| 84. | 81136 | 9.4% | 5.1%(+4.36)#84 | 3.8%(+5.62)#2,627 |
| 85. | 81140 | 9.4% | 5.1%(+4.31)#85 | 3.8%(+5.58)#2,644 |
| 86. | 80610 | 9.4% | 5.1%(+4.31)#86 | 3.8%(+5.57)#2,650 |
| 87. | 81631 | 9.3% | 5.1%(+4.19)#87 | 3.8%(+5.45)#2,715 |
| 88. | 80543 | 9.2% | 5.1%(+4.11)#88 | 3.8%(+5.37)#2,765 |
| 89. | 81057 | 9.2% | 5.1%(+4.08)#89 | 3.8%(+5.35)#2,781 |
| 90. | 81230 | 9.2% | 5.1%(+4.08)#90 | 3.8%(+5.34)#2,784 |
| 91. | 81130 | 8.9% | 5.1%(+3.86)#91 | 3.8%(+5.12)#2,916 |
| 92. | 81147 | 8.9% | 5.1%(+3.83)#92 | 3.8%(+5.09)#2,936 |
| 93. | 80113 | 8.9% | 5.1%(+3.83)#93 | 3.8%(+5.09)#2,938 |
| 94. | 80643 | 8.8% | 5.1%(+3.71)#94 | 3.8%(+4.97)#3,018 |
| 95. | 80433 | 8.8% | 5.1%(+3.69)#95 | 3.8%(+4.95)#3,033 |
| 96. | 80733 | 8.7% | 5.1%(+3.65)#96 | 3.8%(+4.91)#3,060 |
| 97. | 81507 | 8.7% | 5.1%(+3.64)#97 | 3.8%(+4.91)#3,065 |
| 98. | 81143 | 8.7% | 5.1%(+3.60)#98 | 3.8%(+4.86)#3,093 |
| 99. | 81505 | 8.6% | 5.1%(+3.53)#99 | 3.8%(+4.79)#3,147 |
| 100. | 80908 | 8.6% | 5.1%(+3.50)#100 | 3.8%(+4.76)#3,165 |
Common Questions
What are the Top 10 Zip Codes with the Highest Percentage of Self-Employed / Incorporated in Colorado?
Top 10 Zip Codes with the Highest Percentage of Self-Employed / Incorporated in Colorado are:
What zip code has the Highest Percentage of Self-Employed / Incorporated in Colorado?
80426 has the Highest Percentage of Self-Employed / Incorporated in Colorado with 100.0%.
What is the Percentage of Self-Employed / Incorporated in the State of Colorado?
Percentage of Self-Employed / Incorporated in Colorado is 5.1%.
What is the Percentage of Self-Employed / Incorporated in the United States?
Percentage of Self-Employed / Incorporated in the United States is 3.8%.