Pitkin, CO Map & Demographics
Pitkin Map
Pitkin Overview
$26,266
PER CAPITA INCOME
$81,563
AVG FAMILY INCOME
$80,938
AVG HOUSEHOLD INCOME
0.23
INEQUALITY / GINI INDEX
122
TOTAL POPULATION
65
MALE POPULATION
57
FEMALE POPULATION
114.04
MALES / 100 FEMALES
87.69
FEMALES / 100 MALES
35.4
MEDIAN AGE
3.7
AVG FAMILY SIZE
3.3
AVG HOUSEHOLD SIZE
53
LABOR FORCE [ PEOPLE ]
66.3%
PERCENT IN LABOR FORCE
Pitkin Zip Codes
Pitkin Area Codes
Income in Pitkin
Income Overview in Pitkin
Per Capita Income in Pitkin is $26,266, while median incomes of families and households are $81,563 and $80,938 respectively.
| Characteristic | Number | Measure |
| Per Capita Income | 122 | $26,266 |
| Median Family Income | 31 | $81,563 |
| Mean Family Income | 31 | $94,458 |
| Median Household Income | 37 | $80,938 |
| Mean Household Income | 37 | $85,014 |
| Income Deficit | 31 | $0 |
| Wage / Income Gap (%) | 122 | 0.00% |
| Wage / Income Gap ($) | 122 | 100.00¢ per $1 |
| Gini / Inequality Index | 122 | 0.23 |
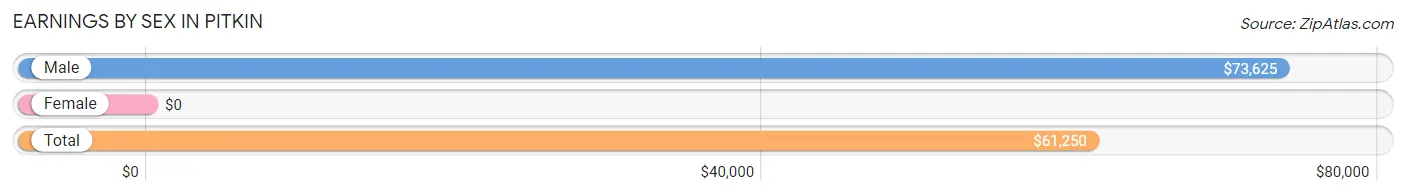
Earnings by Sex in Pitkin
| Sex | Number | Average Earnings |
| Male | 26 (49.1%) | $73,625 |
| Female | 27 (50.9%) | $0 |
| Total | 53 (100.0%) | $61,250 |
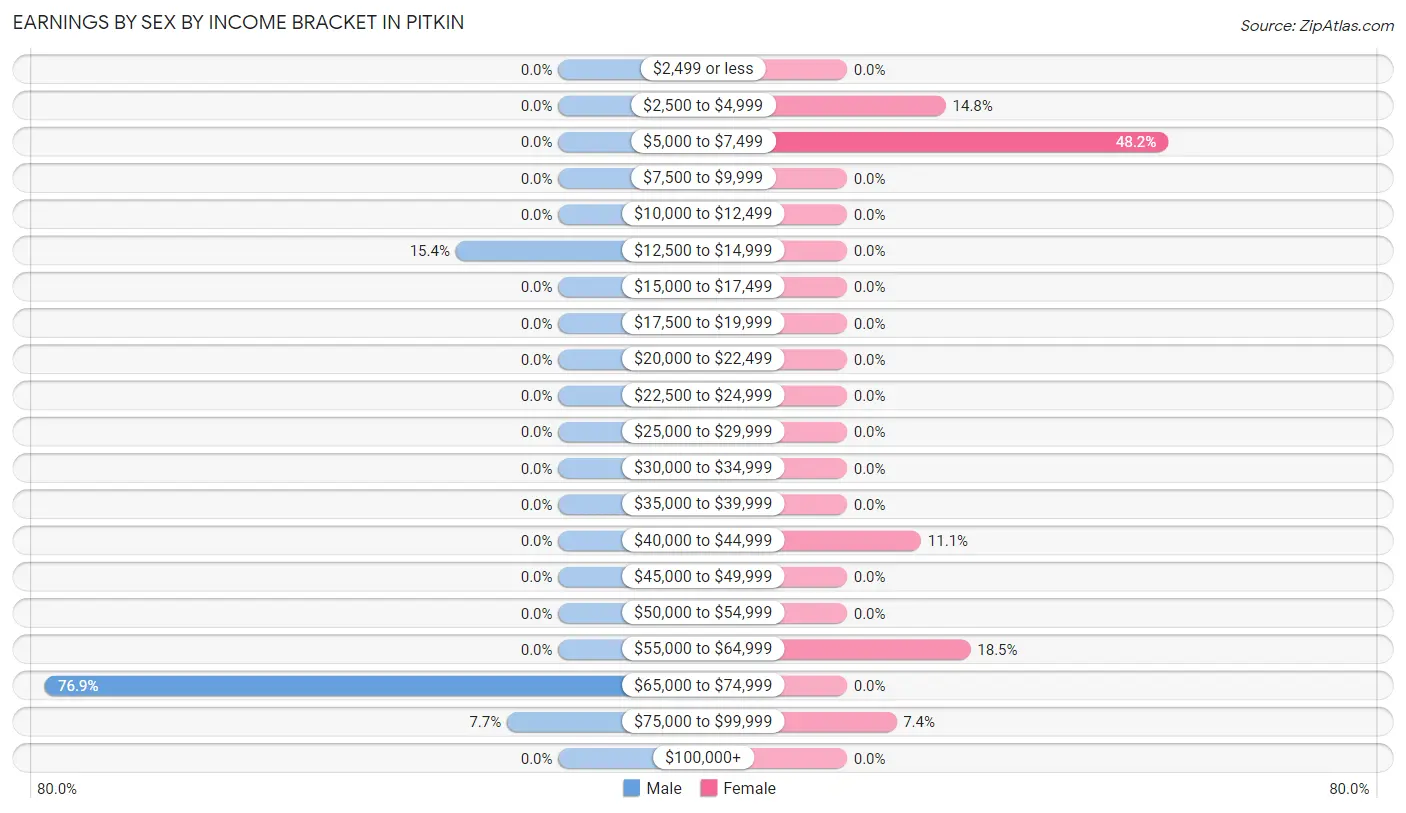
Earnings by Sex by Income Bracket in Pitkin
The most common earnings brackets in Pitkin are $65,000 to $74,999 for men (20 | 76.9%) and $5,000 to $7,499 for women (13 | 48.1%).
| Income | Male | Female |
| $2,499 or less | 0 (0.0%) | 0 (0.0%) |
| $2,500 to $4,999 | 0 (0.0%) | 4 (14.8%) |
| $5,000 to $7,499 | 0 (0.0%) | 13 (48.1%) |
| $7,500 to $9,999 | 0 (0.0%) | 0 (0.0%) |
| $10,000 to $12,499 | 0 (0.0%) | 0 (0.0%) |
| $12,500 to $14,999 | 4 (15.4%) | 0 (0.0%) |
| $15,000 to $17,499 | 0 (0.0%) | 0 (0.0%) |
| $17,500 to $19,999 | 0 (0.0%) | 0 (0.0%) |
| $20,000 to $22,499 | 0 (0.0%) | 0 (0.0%) |
| $22,500 to $24,999 | 0 (0.0%) | 0 (0.0%) |
| $25,000 to $29,999 | 0 (0.0%) | 0 (0.0%) |
| $30,000 to $34,999 | 0 (0.0%) | 0 (0.0%) |
| $35,000 to $39,999 | 0 (0.0%) | 0 (0.0%) |
| $40,000 to $44,999 | 0 (0.0%) | 3 (11.1%) |
| $45,000 to $49,999 | 0 (0.0%) | 0 (0.0%) |
| $50,000 to $54,999 | 0 (0.0%) | 0 (0.0%) |
| $55,000 to $64,999 | 0 (0.0%) | 5 (18.5%) |
| $65,000 to $74,999 | 20 (76.9%) | 0 (0.0%) |
| $75,000 to $99,999 | 2 (7.7%) | 2 (7.4%) |
| $100,000+ | 0 (0.0%) | 0 (0.0%) |
| Total | 26 (100.0%) | 27 (100.0%) |
Earnings by Sex by Educational Attainment in Pitkin
| Educational Attainment | Male Income | Female Income |
| Less than High School | - | - |
| High School Diploma | - | - |
| College or Associate's Degree | - | - |
| Bachelor's Degree | - | - |
| Graduate Degree | - | - |
| Total | $73,625 | $0 |
Family Income in Pitkin
Family Income Brackets in Pitkin
According to the Pitkin family income data, there are 12 families falling into the $75,000 to $99,999 income range, which is the most common income bracket and makes up 38.7% of all families.
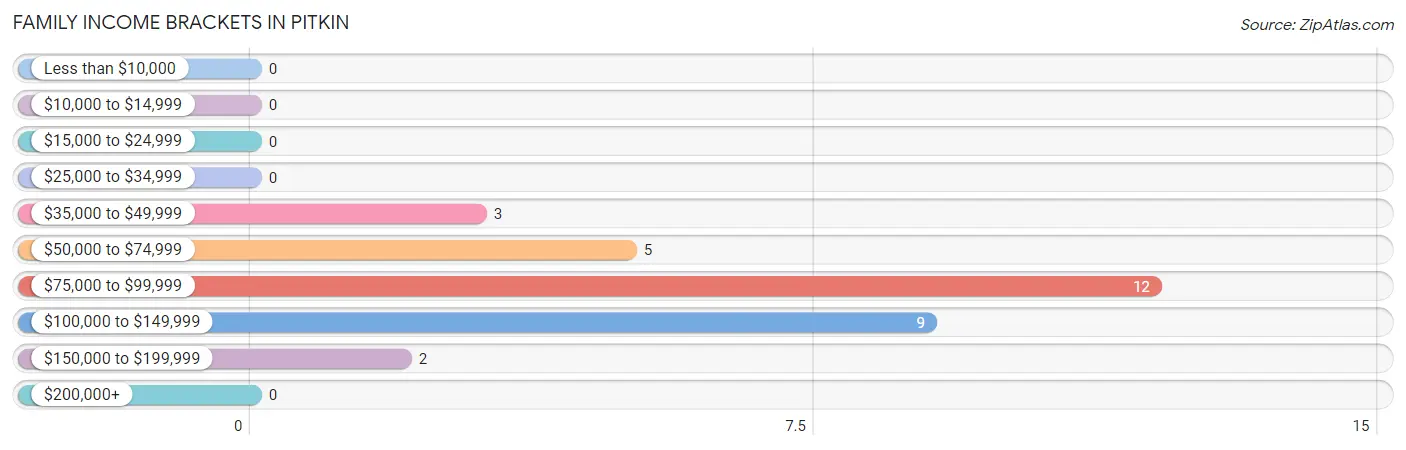
| Income Bracket | # Families | % Families |
| Less than $10,000 | 0 | 0.0% |
| $10,000 to $14,999 | 0 | 0.0% |
| $15,000 to $24,999 | 0 | 0.0% |
| $25,000 to $34,999 | 0 | 0.0% |
| $35,000 to $49,999 | 3 | 9.7% |
| $50,000 to $74,999 | 5 | 16.1% |
| $75,000 to $99,999 | 12 | 38.7% |
| $100,000 to $149,999 | 9 | 29.0% |
| $150,000 to $199,999 | 2 | 6.5% |
| $200,000+ | 0 | 0.0% |
Family Income by Famaliy Size in Pitkin
2-person families (11 | 35.5%) account for the highest median family income in Pitkin with $73,750 per family, while 2-person families (11 | 35.5%) have the highest median income of $36,875 per family member.
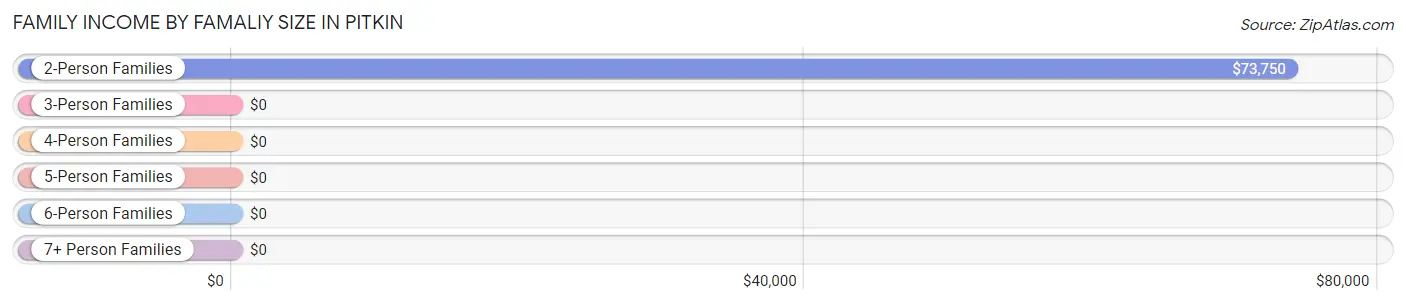
| Income Bracket | # Families | Median Income |
| 2-Person Families | 11 (35.5%) | $73,750 |
| 3-Person Families | 11 (35.5%) | $0 |
| 4-Person Families | 0 (0.0%) | $0 |
| 5-Person Families | 0 (0.0%) | $0 |
| 6-Person Families | 9 (29.0%) | $0 |
| 7+ Person Families | 0 (0.0%) | $0 |
| Total | 31 (100.0%) | $81,563 |
Family Income by Number of Earners in Pitkin
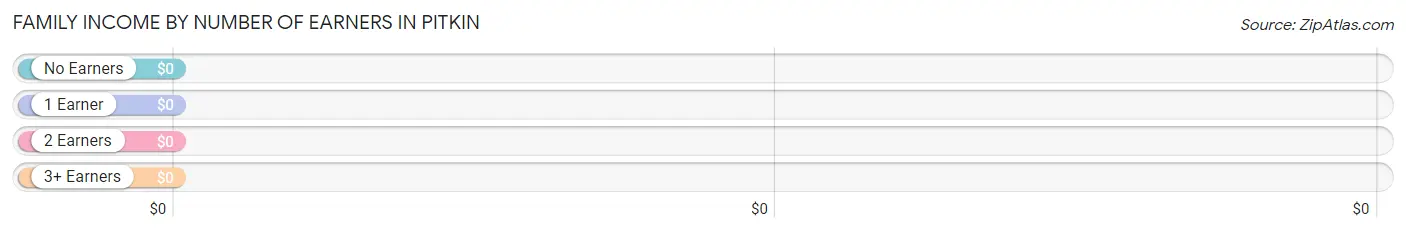
| Number of Earners | # Families | Median Income |
| No Earners | 3 (9.7%) | $0 |
| 1 Earner | 8 (25.8%) | $0 |
| 2 Earners | 18 (58.1%) | $0 |
| 3+ Earners | 2 (6.5%) | $0 |
| Total | 31 (100.0%) | $81,563 |
Household Income in Pitkin
Household Income Brackets in Pitkin
With 12 households falling in the category, the $75,000 to $99,999 income range is the most frequent in Pitkin, accounting for 32.4% of all households.
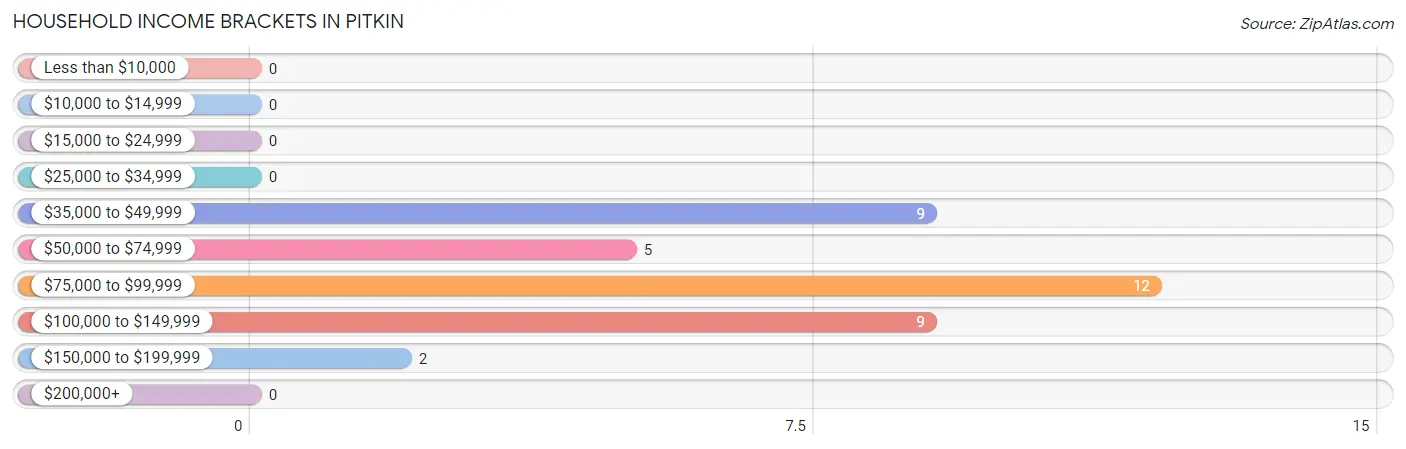
| Income Bracket | # Households | % Households |
| Less than $10,000 | 0 | 0.0% |
| $10,000 to $14,999 | 0 | 0.0% |
| $15,000 to $24,999 | 0 | 0.0% |
| $25,000 to $34,999 | 0 | 0.0% |
| $35,000 to $49,999 | 9 | 24.3% |
| $50,000 to $74,999 | 5 | 13.5% |
| $75,000 to $99,999 | 12 | 32.4% |
| $100,000 to $149,999 | 9 | 24.3% |
| $150,000 to $199,999 | 2 | 5.4% |
| $200,000+ | 0 | 0.0% |
Household Income by Householder Age in Pitkin
The median household income in Pitkin is $80,938, with the highest median household income of $121,111 found in the 45 to 64 years age bracket for the primary householder. A total of 14 households (37.8%) fall into this category.
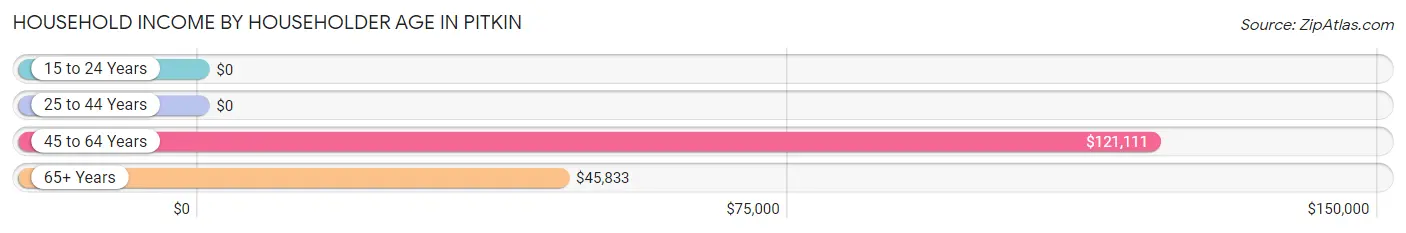
| Income Bracket | # Households | Median Income |
| 15 to 24 Years | 0 (0.0%) | $0 |
| 25 to 44 Years | 9 (24.3%) | $0 |
| 45 to 64 Years | 14 (37.8%) | $121,111 |
| 65+ Years | 14 (37.8%) | $45,833 |
| Total | 37 (100.0%) | $80,938 |
Poverty in Pitkin
Income Below Poverty by Sex and Age in Pitkin
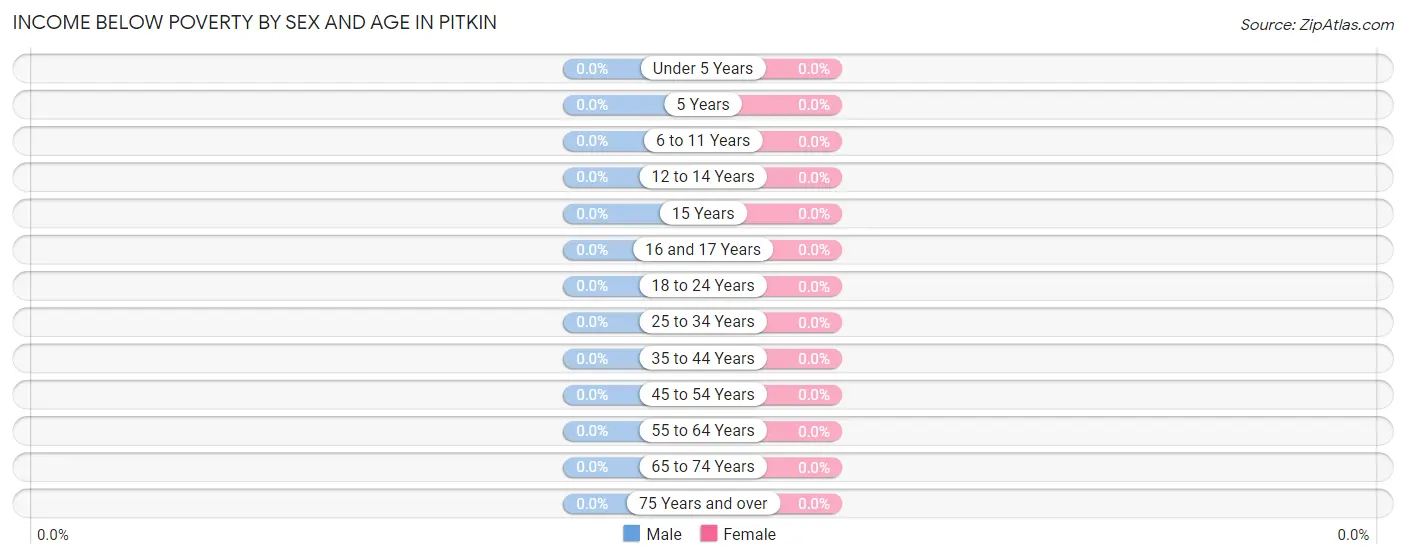
| Age Bracket | Male | Female |
| Under 5 Years | 0 (0.0%) | 0 (0.0%) |
| 5 Years | 0 (0.0%) | 0 (0.0%) |
| 6 to 11 Years | 0 (0.0%) | 0 (0.0%) |
| 12 to 14 Years | 0 (0.0%) | 0 (0.0%) |
| 15 Years | 0 (0.0%) | 0 (0.0%) |
| 16 and 17 Years | 0 (0.0%) | 0 (0.0%) |
| 18 to 24 Years | 0 (0.0%) | 0 (0.0%) |
| 25 to 34 Years | 0 (0.0%) | 0 (0.0%) |
| 35 to 44 Years | 0 (0.0%) | 0 (0.0%) |
| 45 to 54 Years | 0 (0.0%) | 0 (0.0%) |
| 55 to 64 Years | 0 (0.0%) | 0 (0.0%) |
| 65 to 74 Years | 0 (0.0%) | 0 (0.0%) |
| 75 Years and over | 0 (0.0%) | 0 (0.0%) |
| Total | 0 (0.0%) | 0 (0.0%) |
Income Above Poverty by Sex and Age in Pitkin
According to the poverty statistics in Pitkin, males aged 12 to 14 years and females aged 6 to 11 years are the age groups that are most secure financially, with 100.0% of males and 100.0% of females in these age groups living above the poverty line.
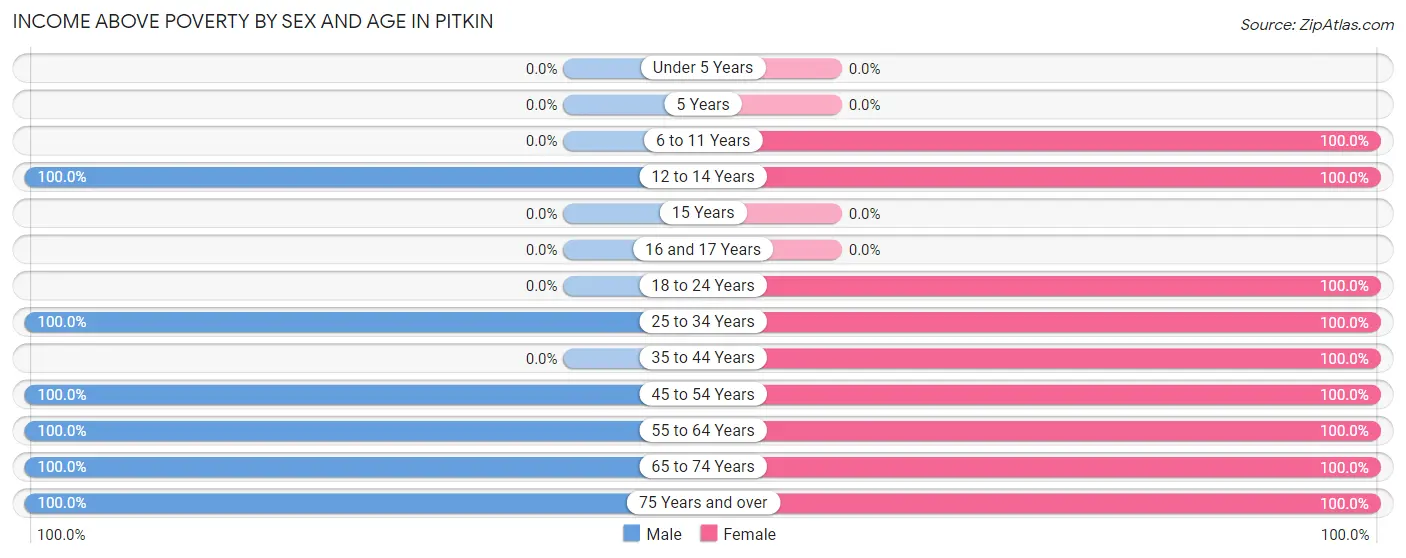
| Age Bracket | Male | Female |
| Under 5 Years | 0 (0.0%) | 0 (0.0%) |
| 5 Years | 0 (0.0%) | 0 (0.0%) |
| 6 to 11 Years | 0 (0.0%) | 7 (100.0%) |
| 12 to 14 Years | 29 (100.0%) | 6 (100.0%) |
| 15 Years | 0 (0.0%) | 0 (0.0%) |
| 16 and 17 Years | 0 (0.0%) | 0 (0.0%) |
| 18 to 24 Years | 0 (0.0%) | 4 (100.0%) |
| 25 to 34 Years | 8 (100.0%) | 3 (100.0%) |
| 35 to 44 Years | 0 (0.0%) | 9 (100.0%) |
| 45 to 54 Years | 2 (100.0%) | 2 (100.0%) |
| 55 to 64 Years | 20 (100.0%) | 12 (100.0%) |
| 65 to 74 Years | 4 (100.0%) | 12 (100.0%) |
| 75 Years and over | 2 (100.0%) | 2 (100.0%) |
| Total | 65 (100.0%) | 57 (100.0%) |
Income Below Poverty Among Married-Couple Families in Pitkin
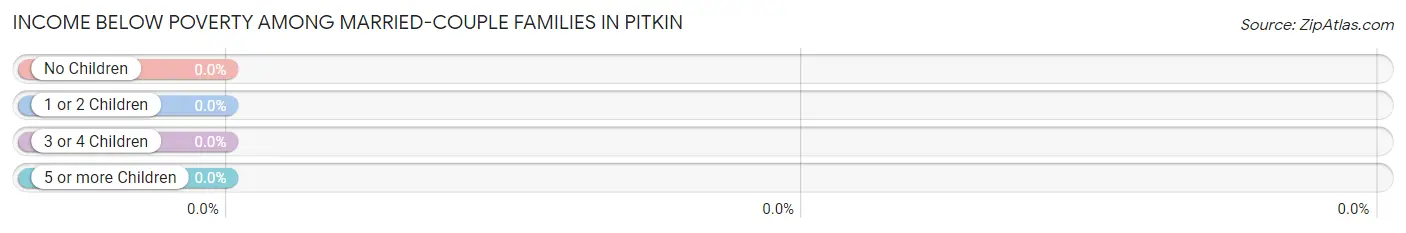
| Children | Above Poverty | Below Poverty |
| No Children | 22 (100.0%) | 0 (0.0%) |
| 1 or 2 Children | 0 (0.0%) | 0 (0.0%) |
| 3 or 4 Children | 9 (100.0%) | 0 (0.0%) |
| 5 or more Children | 0 (0.0%) | 0 (0.0%) |
| Total | 31 (100.0%) | 0 (0.0%) |
Income Below Poverty Among Single-Parent Households in Pitkin
| Children | Single Father | Single Mother |
| No Children | 0 (0.0%) | 0 (0.0%) |
| 1 or 2 Children | 0 (0.0%) | 0 (0.0%) |
| 3 or 4 Children | 0 (0.0%) | 0 (0.0%) |
| 5 or more Children | 0 (0.0%) | 0 (0.0%) |
| Total | 0 (0.0%) | 0 (0.0%) |
Income Below Poverty Among Married-Couple vs Single-Parent Households in Pitkin
| Children | Married-Couple Families | Single-Parent Households |
| No Children | 0 (0.0%) | 0 (0.0%) |
| 1 or 2 Children | 0 (0.0%) | 0 (0.0%) |
| 3 or 4 Children | 0 (0.0%) | 0 (0.0%) |
| 5 or more Children | 0 (0.0%) | 0 (0.0%) |
| Total | 0 (0.0%) | 0 (0.0%) |
Race in Pitkin
The most populous races in Pitkin are , and White / Caucasian (122 | 100.0%).
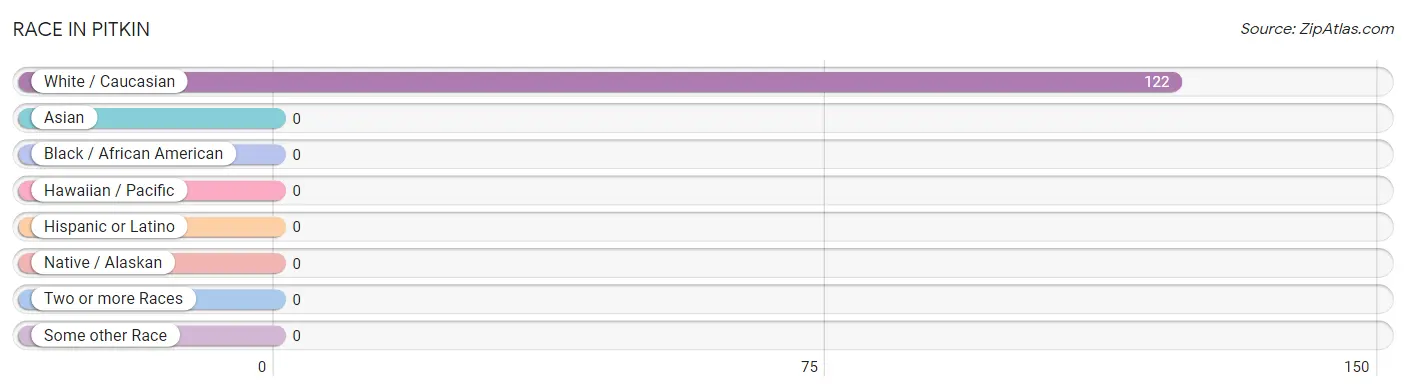
| Race | # Population | % Population |
| Asian | 0 | 0.0% |
| Black / African American | 0 | 0.0% |
| Hawaiian / Pacific | 0 | 0.0% |
| Hispanic or Latino | 0 | 0.0% |
| Native / Alaskan | 0 | 0.0% |
| White / Caucasian | 122 | 100.0% |
| Two or more Races | 0 | 0.0% |
| Some other Race | 0 | 0.0% |
| Total | 122 | 100.0% |
Ancestry in Pitkin
The most populous ancestries reported in Pitkin are European (59 | 48.4%), English (17 | 13.9%), German (15 | 12.3%), Irish (5 | 4.1%), and Swedish (5 | 4.1%), together accounting for 82.8% of all Pitkin residents.
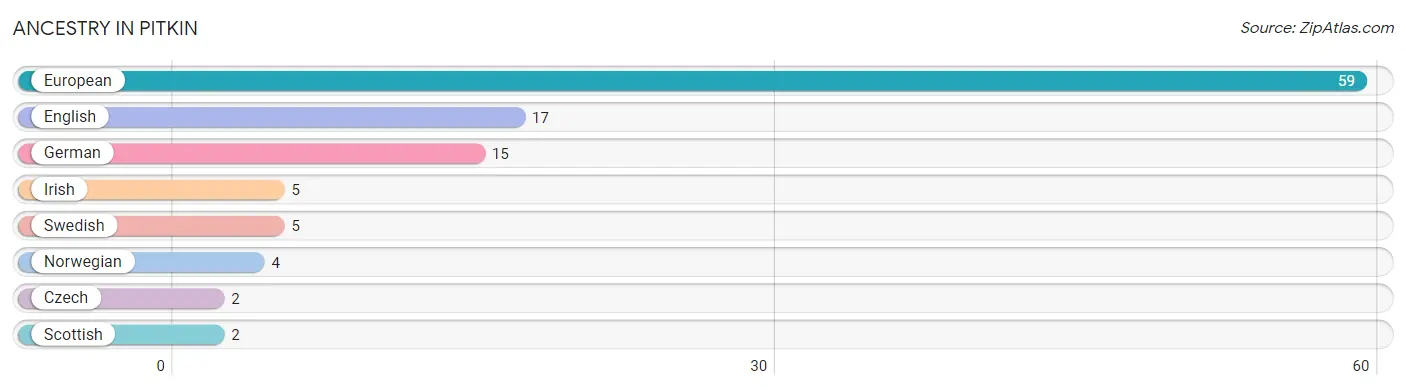
| Ancestry | # Population | % Population |
| Czech | 2 | 1.6% |
| English | 17 | 13.9% |
| European | 59 | 48.4% |
| German | 15 | 12.3% |
| Irish | 5 | 4.1% |
| Norwegian | 4 | 3.3% |
| Scottish | 2 | 1.6% |
| Swedish | 5 | 4.1% | View All 8 Rows |
Immigrants in Pitkin

| Immigration Origin | # Population | % Population | View All 0 Rows |
Sex and Age in Pitkin
Sex and Age in Pitkin
The most populous age groups in Pitkin are 10 to 14 Years (29 | 44.6%) for men and 10 to 14 Years (13 | 22.8%) for women.
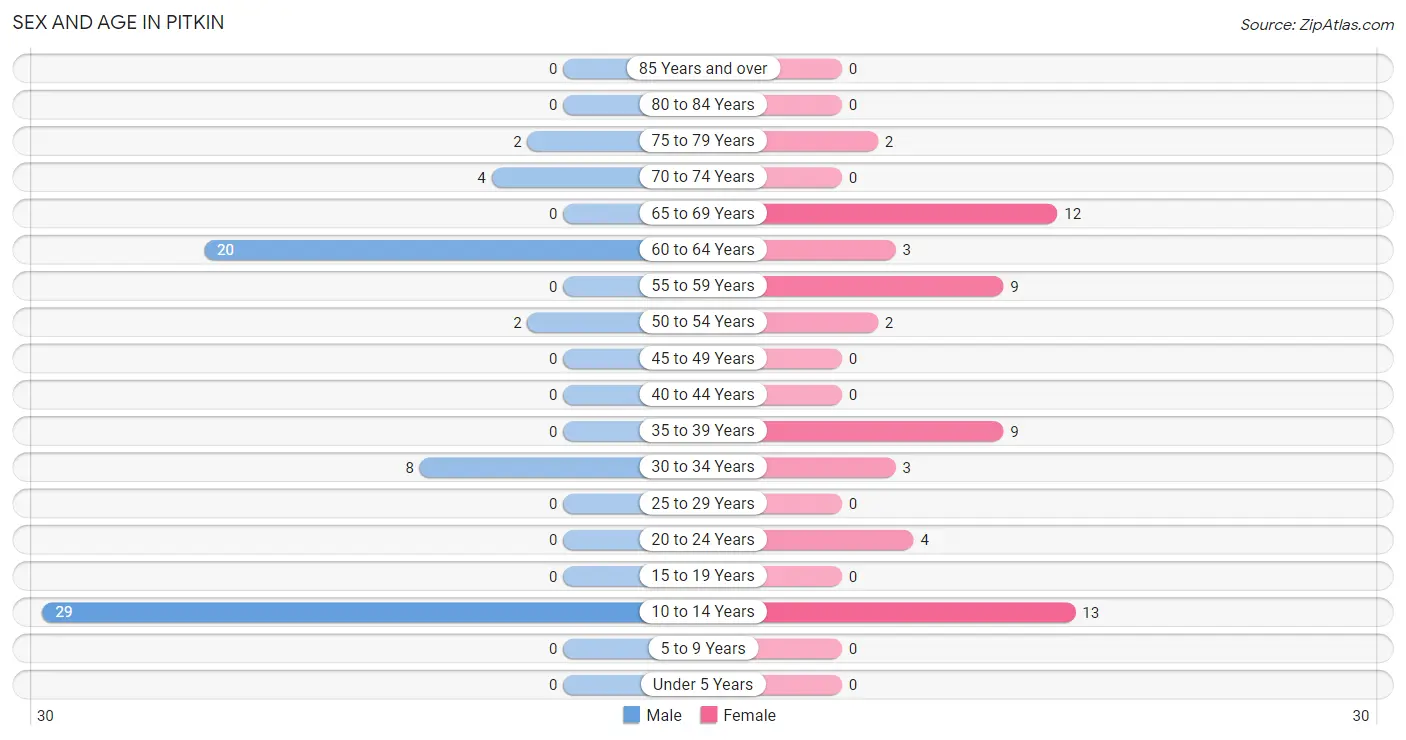
| Age Bracket | Male | Female |
| Under 5 Years | 0 (0.0%) | 0 (0.0%) |
| 5 to 9 Years | 0 (0.0%) | 0 (0.0%) |
| 10 to 14 Years | 29 (44.6%) | 13 (22.8%) |
| 15 to 19 Years | 0 (0.0%) | 0 (0.0%) |
| 20 to 24 Years | 0 (0.0%) | 4 (7.0%) |
| 25 to 29 Years | 0 (0.0%) | 0 (0.0%) |
| 30 to 34 Years | 8 (12.3%) | 3 (5.3%) |
| 35 to 39 Years | 0 (0.0%) | 9 (15.8%) |
| 40 to 44 Years | 0 (0.0%) | 0 (0.0%) |
| 45 to 49 Years | 0 (0.0%) | 0 (0.0%) |
| 50 to 54 Years | 2 (3.1%) | 2 (3.5%) |
| 55 to 59 Years | 0 (0.0%) | 9 (15.8%) |
| 60 to 64 Years | 20 (30.8%) | 3 (5.3%) |
| 65 to 69 Years | 0 (0.0%) | 12 (21.0%) |
| 70 to 74 Years | 4 (6.1%) | 0 (0.0%) |
| 75 to 79 Years | 2 (3.1%) | 2 (3.5%) |
| 80 to 84 Years | 0 (0.0%) | 0 (0.0%) |
| 85 Years and over | 0 (0.0%) | 0 (0.0%) |
| Total | 65 (100.0%) | 57 (100.0%) |
Families and Households in Pitkin
Median Family Size in Pitkin
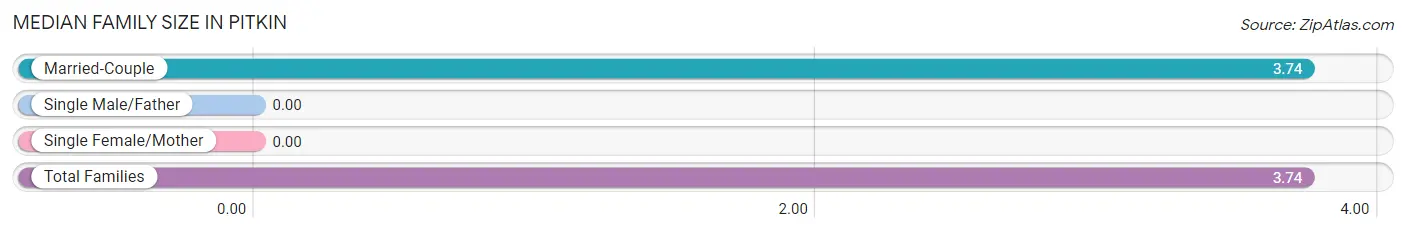
| Family Type | # Families | Family Size |
| Married-Couple | 31 (100.0%) | 3.74 |
| Single Male/Father | 0 (0.0%) | - |
| Single Female/Mother | 0 (0.0%) | - |
| Total Families | 31 (100.0%) | 3.74 |
Median Household Size in Pitkin
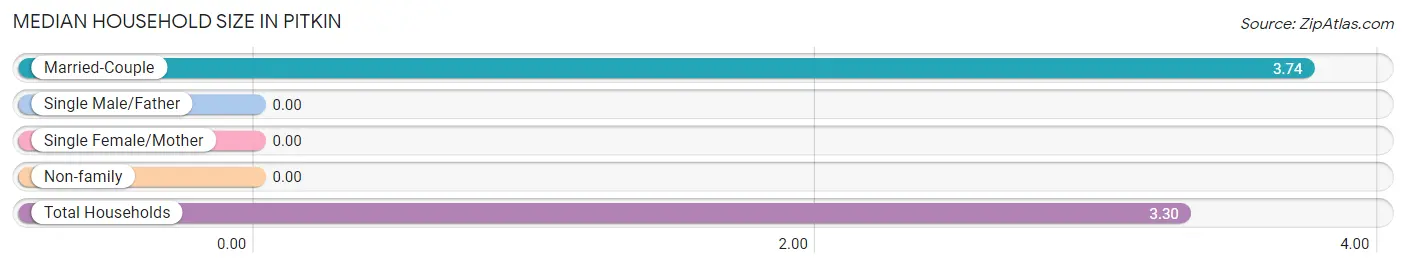
| Household Type | # Households | Household Size |
| Married-Couple | 31 (83.8%) | 3.74 |
| Single Male/Father | 0 (0.0%) | - |
| Single Female/Mother | 0 (0.0%) | - |
| Non-family | 6 (16.2%) | - |
| Total Households | 37 (100.0%) | 3.30 |
Household Size by Marriage Status in Pitkin
Out of a total of 37 households in Pitkin, 31 (83.8%) are family households, while 6 (16.2%) are nonfamily households. The most numerous type of family households are 2-person households, comprising 11, and the most common type of nonfamily households are 1-person households, comprising 6.
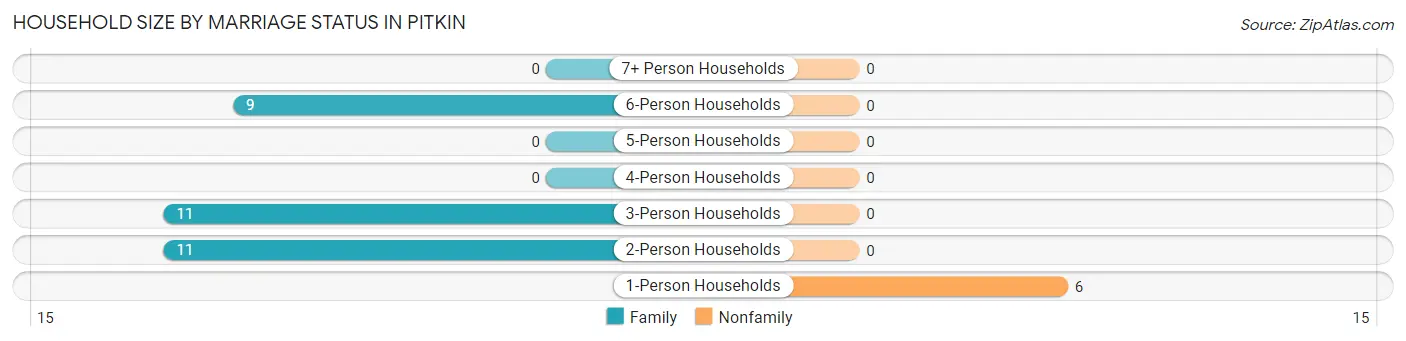
| Household Size | Family Households | Nonfamily Households |
| 1-Person Households | - | 6 (16.2%) |
| 2-Person Households | 11 (29.7%) | 0 (0.0%) |
| 3-Person Households | 11 (29.7%) | 0 (0.0%) |
| 4-Person Households | 0 (0.0%) | 0 (0.0%) |
| 5-Person Households | 0 (0.0%) | 0 (0.0%) |
| 6-Person Households | 9 (24.3%) | 0 (0.0%) |
| 7+ Person Households | 0 (0.0%) | 0 (0.0%) |
| Total | 31 (83.8%) | 6 (16.2%) |
Female Fertility in Pitkin
Fertility by Age in Pitkin
| Age Bracket | Women with Births | Births / 1,000 Women |
| 15 to 19 years | 0 (0.0%) | 0.0 |
| 20 to 34 years | 0 (0.0%) | 0.0 |
| 35 to 50 years | 0 (0.0%) | 0.0 |
| Total | 0 (0.0%) | 0.0 |
Fertility by Age by Marriage Status in Pitkin
| Age Bracket | Married | Unmarried |
| 15 to 19 years | 0 (0.0%) | 0 (0.0%) |
| 20 to 34 years | 0 (0.0%) | 0 (0.0%) |
| 35 to 50 years | 0 (0.0%) | 0 (0.0%) |
| Total | 0 (0.0%) | 0 (0.0%) |
Fertility by Education in Pitkin
| Educational Attainment | Women with Births | Births / 1,000 Women |
| Less than High School | 0 (0.0%) | 0.0 |
| High School Diploma | 0 (0.0%) | 0.0 |
| College or Associate's Degree | 0 (0.0%) | 0.0 |
| Bachelor's Degree | 0 (0.0%) | 0.0 |
| Graduate Degree | 0 (0.0%) | 0.0 |
| Total | 0 (0.0%) | 0.0 |
Fertility by Education by Marriage Status in Pitkin
| Educational Attainment | Married | Unmarried |
| Less than High School | 0 (0.0%) | 0 (0.0%) |
| High School Diploma | 0 (0.0%) | 0 (0.0%) |
| College or Associate's Degree | 0 (0.0%) | 0 (0.0%) |
| Bachelor's Degree | 0 (0.0%) | 0 (0.0%) |
| Graduate Degree | 0 (0.0%) | 0 (0.0%) |
| Total | 0 (0.0%) | 0 (0.0%) |
Employment Characteristics in Pitkin
Employment by Class of Employer in Pitkin
Among the 53 employed individuals in Pitkin, private company employees (21 | 39.6%), self-employed (incorporated) (21 | 39.6%), and self-employed (not incorporated) (9 | 17.0%) make up the most common classes of employment.
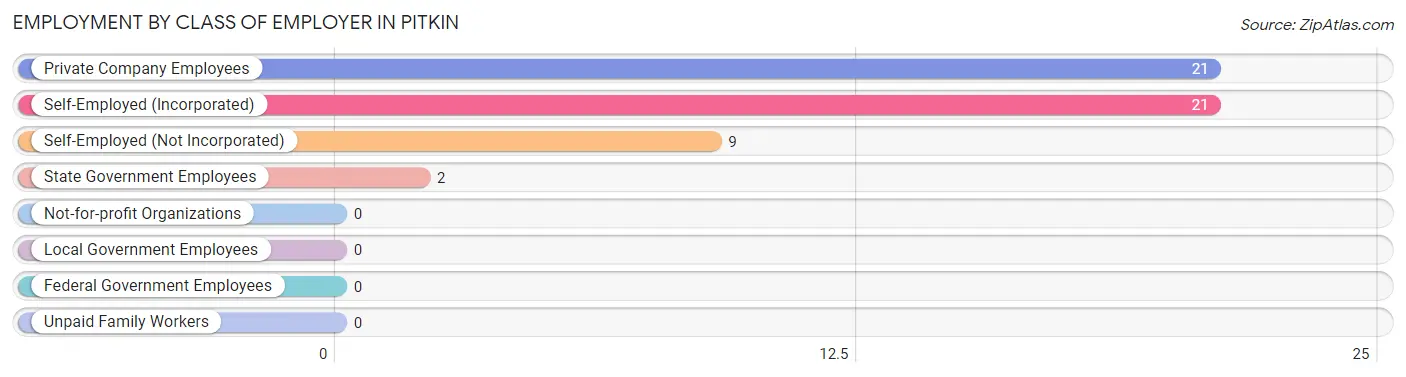
| Employer Class | # Employees | % Employees |
| Private Company Employees | 21 | 39.6% |
| Self-Employed (Incorporated) | 21 | 39.6% |
| Self-Employed (Not Incorporated) | 9 | 17.0% |
| Not-for-profit Organizations | 0 | 0.0% |
| Local Government Employees | 0 | 0.0% |
| State Government Employees | 2 | 3.8% |
| Federal Government Employees | 0 | 0.0% |
| Unpaid Family Workers | 0 | 0.0% |
| Total | 53 | 100.0% |
Employment Status by Age in Pitkin
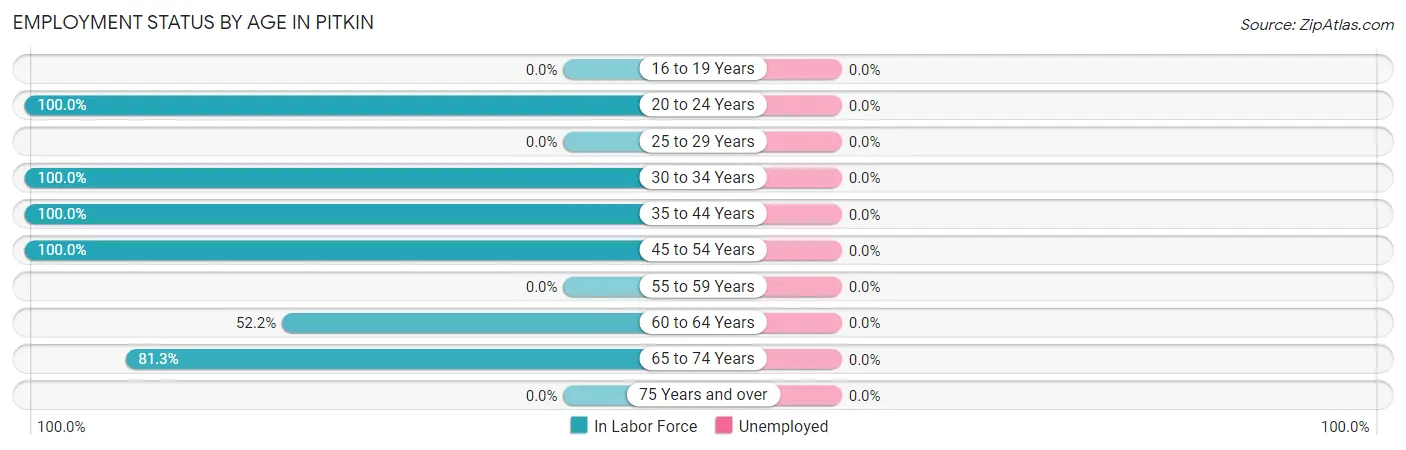
| Age Bracket | In Labor Force | Unemployed |
| 16 to 19 Years | 0 (0.0%) | 0 (0.0%) |
| 20 to 24 Years | 4 (100.0%) | 0 (0.0%) |
| 25 to 29 Years | 0 (0.0%) | 0 (0.0%) |
| 30 to 34 Years | 11 (100.0%) | 0 (0.0%) |
| 35 to 44 Years | 9 (100.0%) | 0 (0.0%) |
| 45 to 54 Years | 4 (100.0%) | 0 (0.0%) |
| 55 to 59 Years | 0 (0.0%) | 0 (0.0%) |
| 60 to 64 Years | 12 (52.2%) | 0 (0.0%) |
| 65 to 74 Years | 13 (81.3%) | 0 (0.0%) |
| 75 Years and over | 0 (0.0%) | 0 (0.0%) |
| Total | 53 (66.3%) | 0 (0.0%) |
Employment Status by Educational Attainment in Pitkin
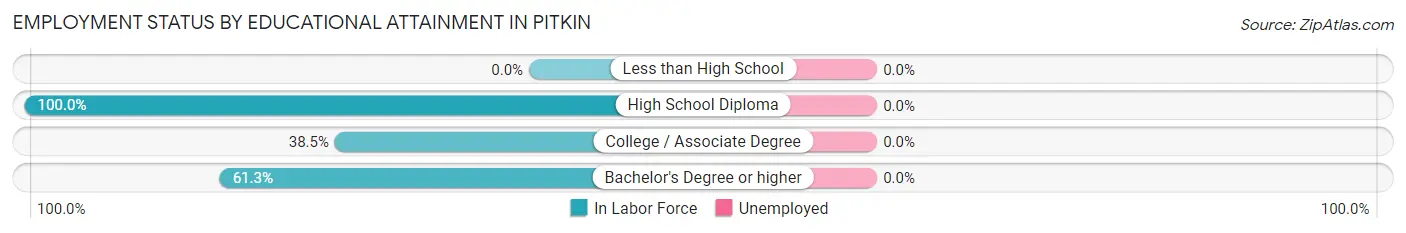
| Educational Attainment | In Labor Force | Unemployed |
| Less than High School | 0 (0.0%) | 0 (0.0%) |
| High School Diploma | 12 (100.0%) | 0 (0.0%) |
| College / Associate Degree | 5 (38.5%) | 0 (0.0%) |
| Bachelor's Degree or higher | 19 (61.3%) | 0 (0.0%) |
| Total | 36 (64.3%) | 0 (0.0%) |
Employment Occupations by Sex in Pitkin
Management, Business, Science and Arts Occupations
The most common Management, Business, Science and Arts occupations in Pitkin are Management (21 | 39.6%), and Business & Financial (2 | 3.8%).
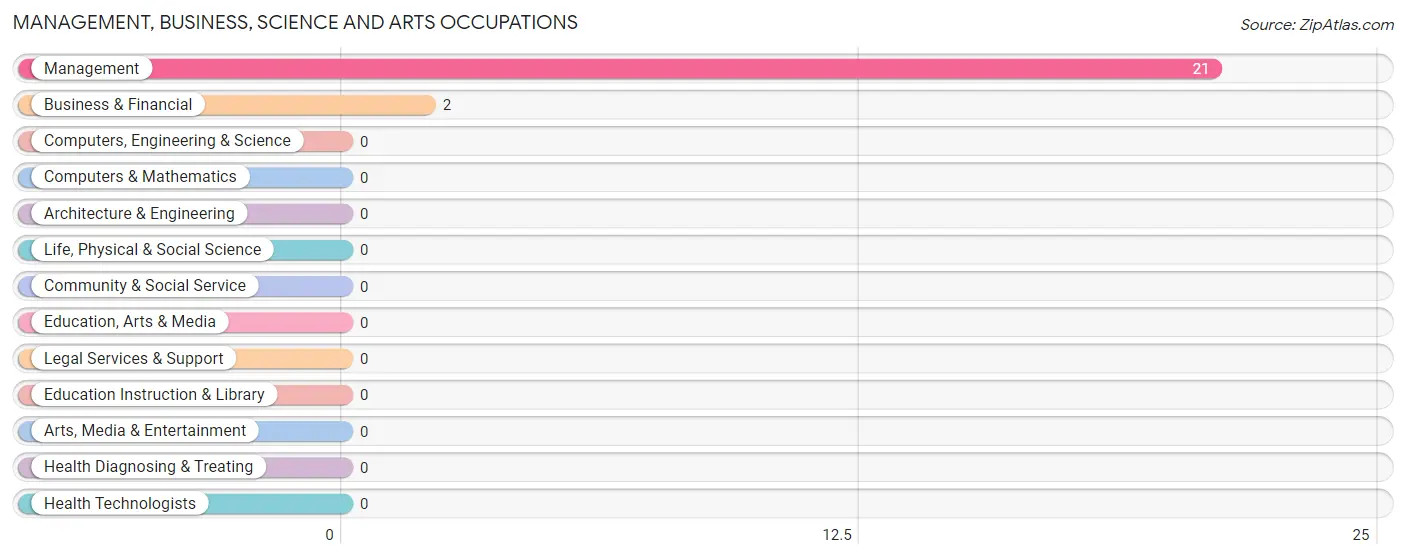
Management, Business, Science and Arts Occupations by Sex
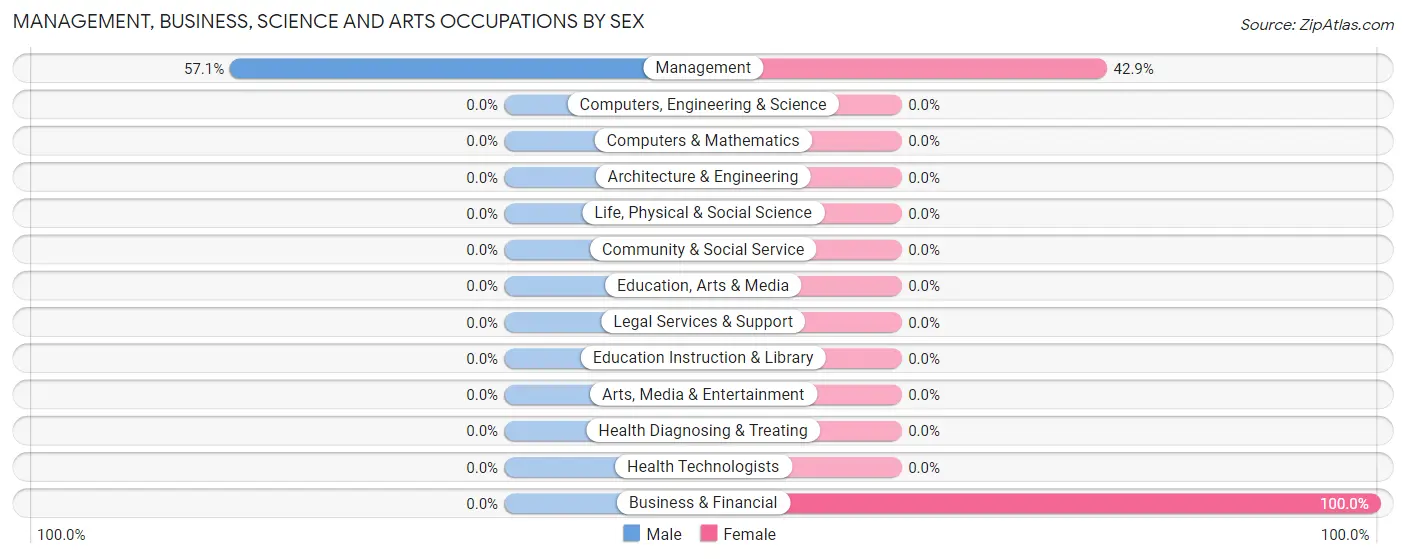
| Occupation | Male | Female |
| Management | 12 (57.1%) | 9 (42.9%) |
| Business & Financial | 0 (0.0%) | 2 (100.0%) |
| Computers, Engineering & Science | 0 (0.0%) | 0 (0.0%) |
| Computers & Mathematics | 0 (0.0%) | 0 (0.0%) |
| Architecture & Engineering | 0 (0.0%) | 0 (0.0%) |
| Life, Physical & Social Science | 0 (0.0%) | 0 (0.0%) |
| Community & Social Service | 0 (0.0%) | 0 (0.0%) |
| Education, Arts & Media | 0 (0.0%) | 0 (0.0%) |
| Legal Services & Support | 0 (0.0%) | 0 (0.0%) |
| Education Instruction & Library | 0 (0.0%) | 0 (0.0%) |
| Arts, Media & Entertainment | 0 (0.0%) | 0 (0.0%) |
| Health Diagnosing & Treating | 0 (0.0%) | 0 (0.0%) |
| Health Technologists | 0 (0.0%) | 0 (0.0%) |
| Total (Category) | 12 (52.2%) | 11 (47.8%) |
| Total (Overall) | 26 (49.1%) | 27 (50.9%) |
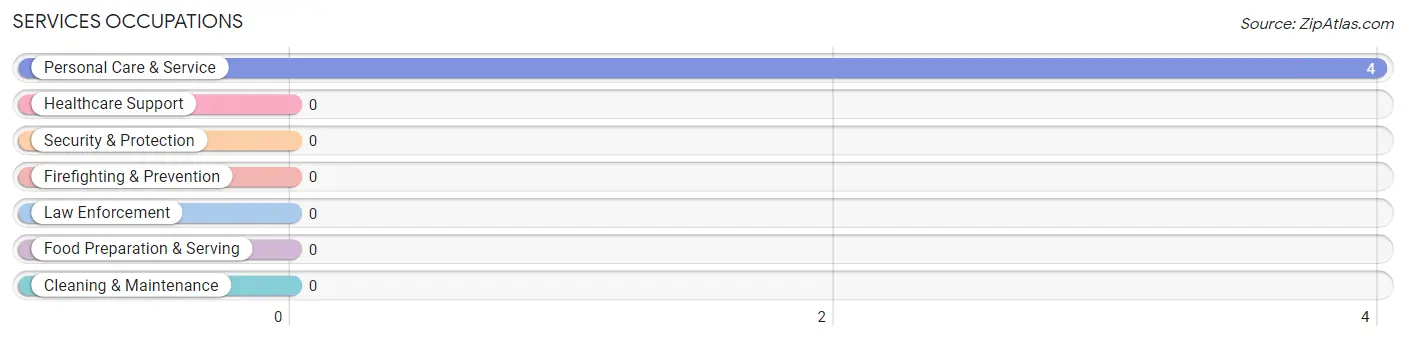
Services Occupations
The most common Services occupations in Pitkin are , and Personal Care & Service (4 | 7.5%).
Services Occupations by Sex
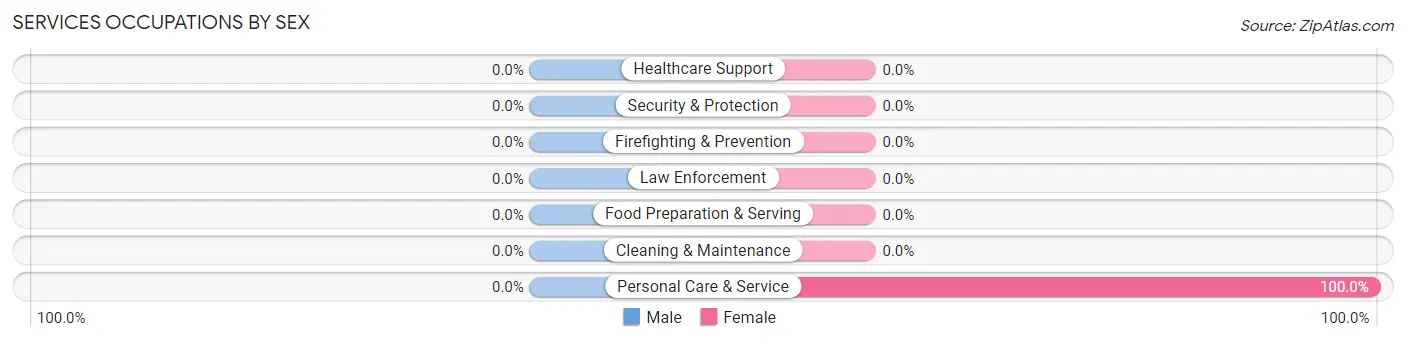
| Occupation | Male | Female |
| Healthcare Support | 0 (0.0%) | 0 (0.0%) |
| Security & Protection | 0 (0.0%) | 0 (0.0%) |
| Firefighting & Prevention | 0 (0.0%) | 0 (0.0%) |
| Law Enforcement | 0 (0.0%) | 0 (0.0%) |
| Food Preparation & Serving | 0 (0.0%) | 0 (0.0%) |
| Cleaning & Maintenance | 0 (0.0%) | 0 (0.0%) |
| Personal Care & Service | 0 (0.0%) | 4 (100.0%) |
| Total (Category) | 0 (0.0%) | 4 (100.0%) |
| Total (Overall) | 26 (49.1%) | 27 (50.9%) |
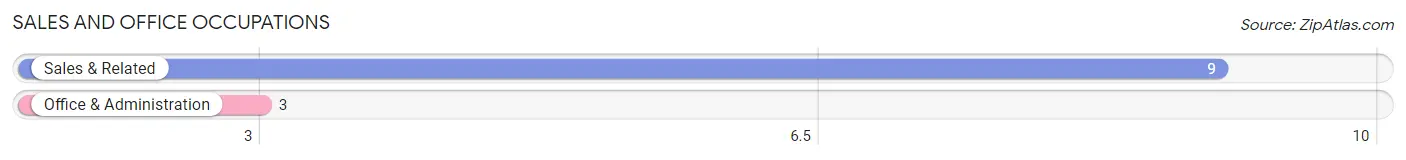
Sales and Office Occupations
The most common Sales and Office occupations in Pitkin are Sales & Related (9 | 17.0%), and Office & Administration (3 | 5.7%).
Sales and Office Occupations by Sex
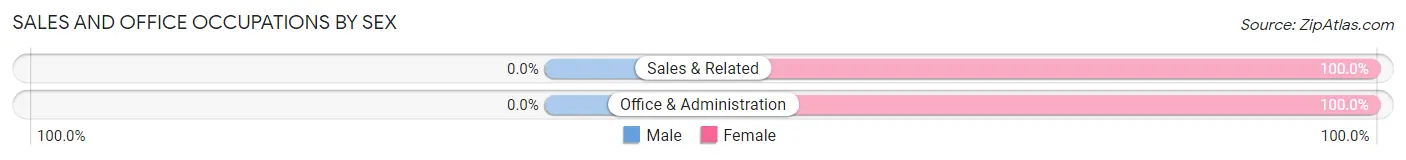
| Occupation | Male | Female |
| Sales & Related | 0 (0.0%) | 9 (100.0%) |
| Office & Administration | 0 (0.0%) | 3 (100.0%) |
| Total (Category) | 0 (0.0%) | 12 (100.0%) |
| Total (Overall) | 26 (49.1%) | 27 (50.9%) |
Natural Resources, Construction and Maintenance Occupations
The most common Natural Resources, Construction and Maintenance occupations in Pitkin are , and Construction & Extraction (10 | 18.9%).
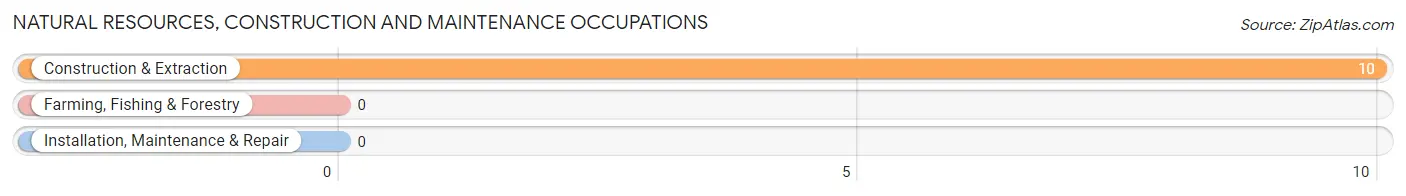
Natural Resources, Construction and Maintenance Occupations by Sex
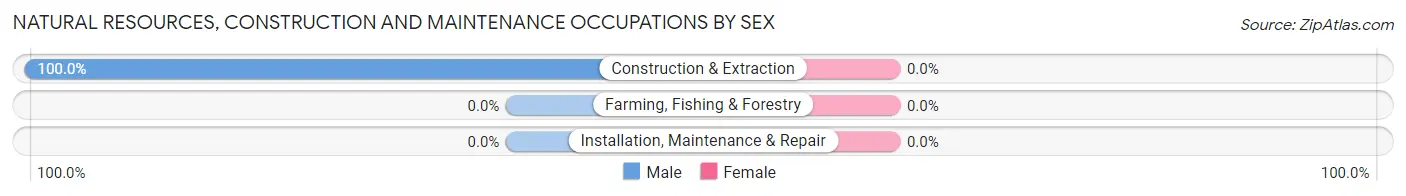
| Occupation | Male | Female |
| Farming, Fishing & Forestry | 0 (0.0%) | 0 (0.0%) |
| Construction & Extraction | 10 (100.0%) | 0 (0.0%) |
| Installation, Maintenance & Repair | 0 (0.0%) | 0 (0.0%) |
| Total (Category) | 10 (100.0%) | 0 (0.0%) |
| Total (Overall) | 26 (49.1%) | 27 (50.9%) |
Production, Transportation and Moving Occupations
The most common Production, Transportation and Moving occupations in Pitkin are , and Transportation (4 | 7.5%).
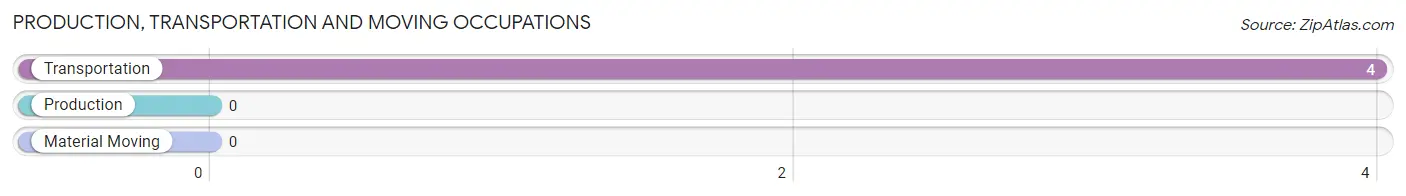
Production, Transportation and Moving Occupations by Sex
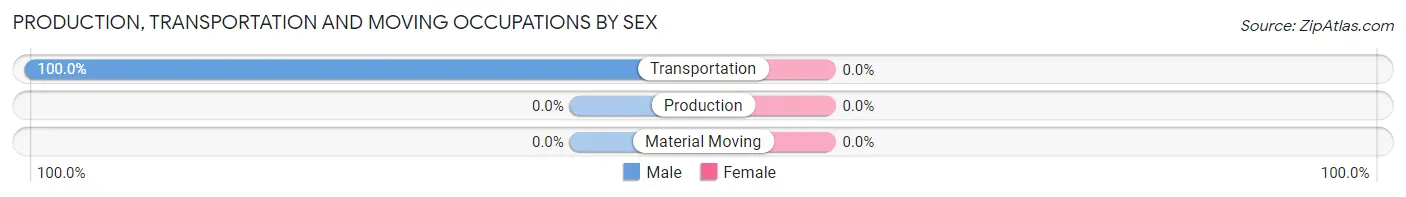
| Occupation | Male | Female |
| Production | 0 (0.0%) | 0 (0.0%) |
| Transportation | 4 (100.0%) | 0 (0.0%) |
| Material Moving | 0 (0.0%) | 0 (0.0%) |
| Total (Category) | 4 (100.0%) | 0 (0.0%) |
| Total (Overall) | 26 (49.1%) | 27 (50.9%) |
Employment Industries by Sex in Pitkin
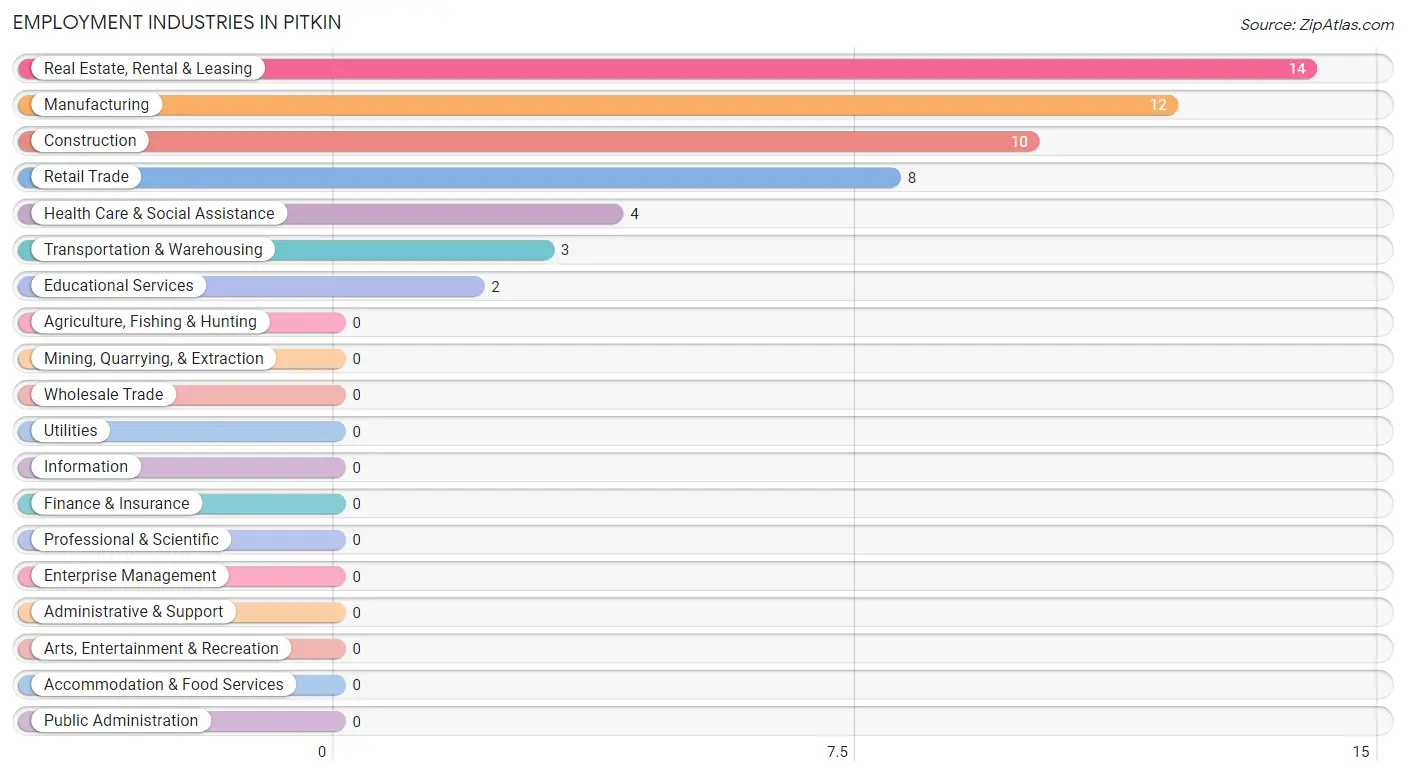
Employment Industries in Pitkin
The major employment industries in Pitkin include Real Estate, Rental & Leasing (14 | 26.4%), Manufacturing (12 | 22.6%), Construction (10 | 18.9%), Retail Trade (8 | 15.1%), and Health Care & Social Assistance (4 | 7.5%).
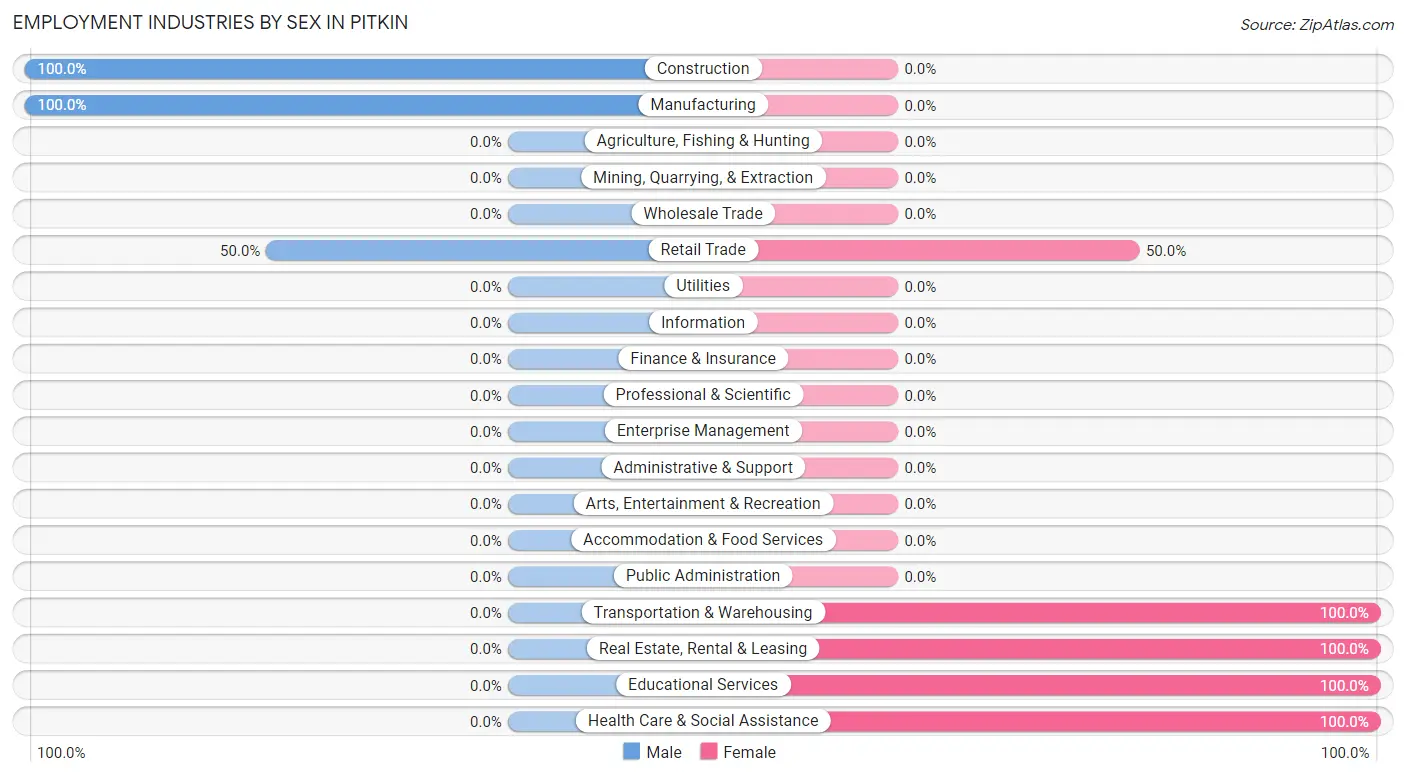
Employment Industries by Sex in Pitkin
The Pitkin industries that see more men than women are Construction (100.0%), Manufacturing (100.0%), and Retail Trade (50.0%), whereas the industries that tend to have a higher number of women are Transportation & Warehousing (100.0%), Real Estate, Rental & Leasing (100.0%), and Educational Services (100.0%).
| Industry | Male | Female |
| Agriculture, Fishing & Hunting | 0 (0.0%) | 0 (0.0%) |
| Mining, Quarrying, & Extraction | 0 (0.0%) | 0 (0.0%) |
| Construction | 10 (100.0%) | 0 (0.0%) |
| Manufacturing | 12 (100.0%) | 0 (0.0%) |
| Wholesale Trade | 0 (0.0%) | 0 (0.0%) |
| Retail Trade | 4 (50.0%) | 4 (50.0%) |
| Transportation & Warehousing | 0 (0.0%) | 3 (100.0%) |
| Utilities | 0 (0.0%) | 0 (0.0%) |
| Information | 0 (0.0%) | 0 (0.0%) |
| Finance & Insurance | 0 (0.0%) | 0 (0.0%) |
| Real Estate, Rental & Leasing | 0 (0.0%) | 14 (100.0%) |
| Professional & Scientific | 0 (0.0%) | 0 (0.0%) |
| Enterprise Management | 0 (0.0%) | 0 (0.0%) |
| Administrative & Support | 0 (0.0%) | 0 (0.0%) |
| Educational Services | 0 (0.0%) | 2 (100.0%) |
| Health Care & Social Assistance | 0 (0.0%) | 4 (100.0%) |
| Arts, Entertainment & Recreation | 0 (0.0%) | 0 (0.0%) |
| Accommodation & Food Services | 0 (0.0%) | 0 (0.0%) |
| Public Administration | 0 (0.0%) | 0 (0.0%) |
| Total | 26 (49.1%) | 27 (50.9%) |
Education in Pitkin
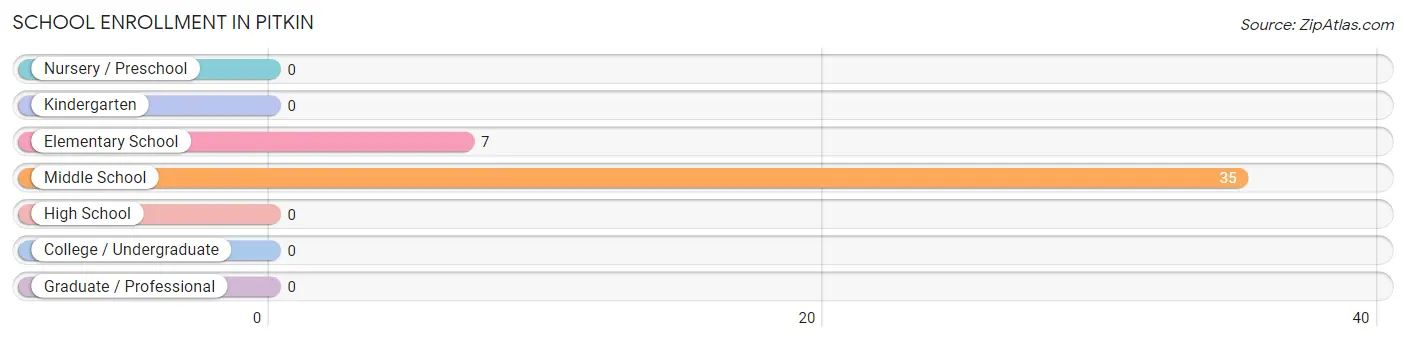
School Enrollment in Pitkin
The most common levels of schooling among the 42 students in Pitkin are middle school (35 | 83.3%), and elementary school (7 | 16.7%).
| School Level | # Students | % Students |
| Nursery / Preschool | 0 | 0.0% |
| Kindergarten | 0 | 0.0% |
| Elementary School | 7 | 16.7% |
| Middle School | 35 | 83.3% |
| High School | 0 | 0.0% |
| College / Undergraduate | 0 | 0.0% |
| Graduate / Professional | 0 | 0.0% |
| Total | 42 | 100.0% |
School Enrollment by Age by Funding Source in Pitkin
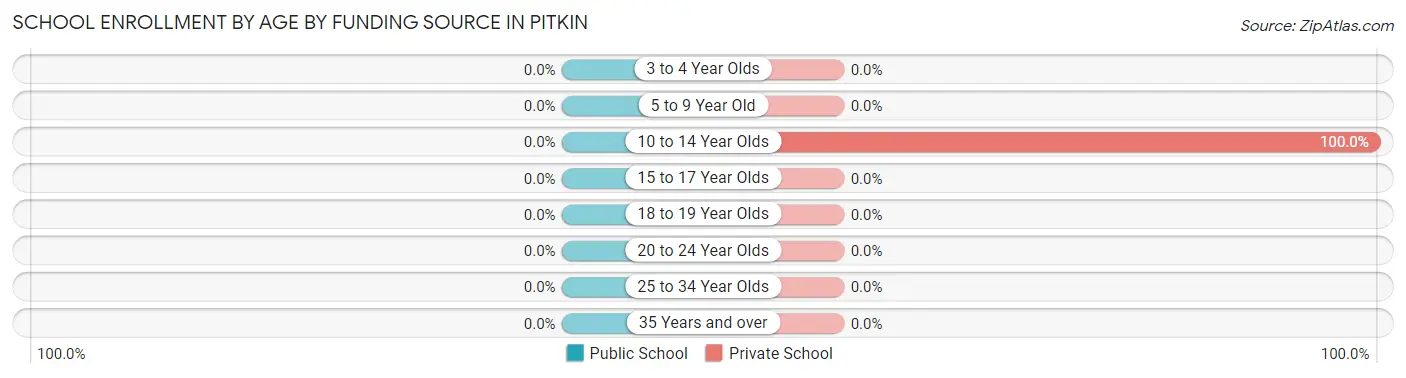
| Age Bracket | Public School | Private School |
| 3 to 4 Year Olds | 0 (0.0%) | 0 (0.0%) |
| 5 to 9 Year Old | 0 (0.0%) | 0 (0.0%) |
| 10 to 14 Year Olds | 0 (0.0%) | 42 (100.0%) |
| 15 to 17 Year Olds | 0 (0.0%) | 0 (0.0%) |
| 18 to 19 Year Olds | 0 (0.0%) | 0 (0.0%) |
| 20 to 24 Year Olds | 0 (0.0%) | 0 (0.0%) |
| 25 to 34 Year Olds | 0 (0.0%) | 0 (0.0%) |
| 35 Years and over | 0 (0.0%) | 0 (0.0%) |
| Total | 0 (0.0%) | 42 (100.0%) |
Educational Attainment by Field of Study in Pitkin
Arts & humanities (12 | 26.1%), multidisciplinary studies (11 | 23.9%), science & technology (9 | 19.6%), education (8 | 17.4%), and business (2 | 4.3%) are the most common fields of study among 46 individuals in Pitkin who have obtained a bachelor's degree or higher.
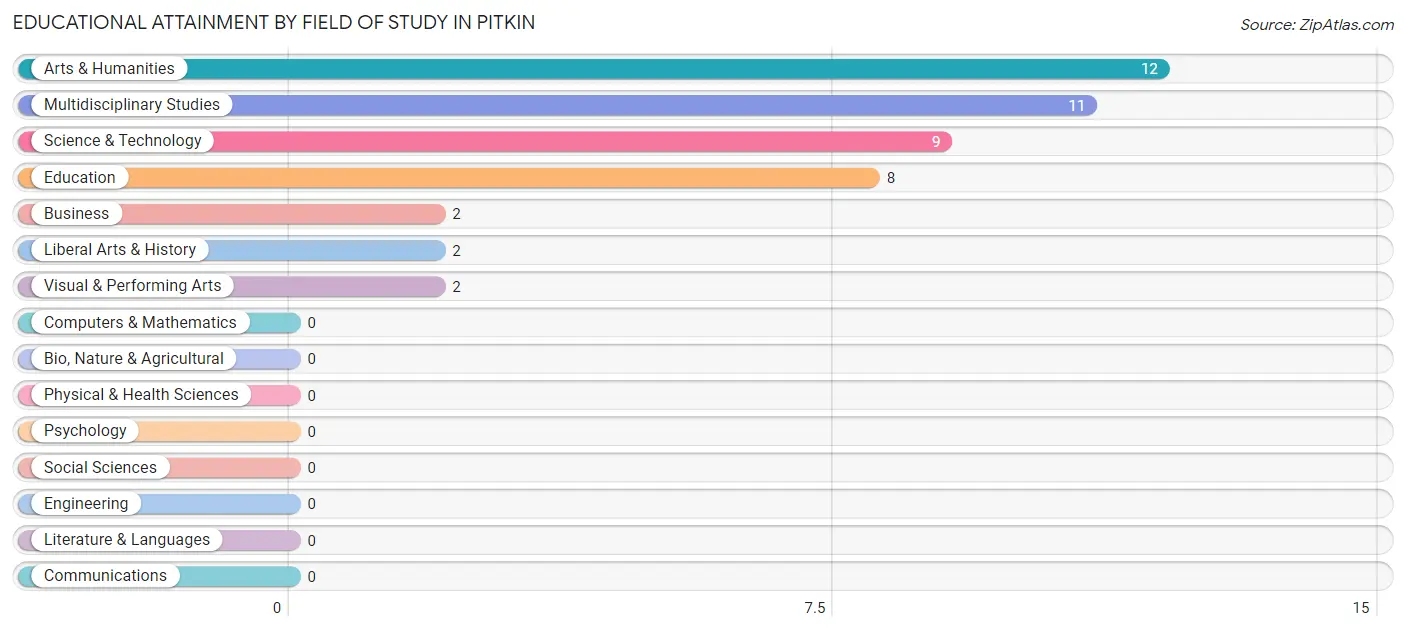
| Field of Study | # Graduates | % Graduates |
| Computers & Mathematics | 0 | 0.0% |
| Bio, Nature & Agricultural | 0 | 0.0% |
| Physical & Health Sciences | 0 | 0.0% |
| Psychology | 0 | 0.0% |
| Social Sciences | 0 | 0.0% |
| Engineering | 0 | 0.0% |
| Multidisciplinary Studies | 11 | 23.9% |
| Science & Technology | 9 | 19.6% |
| Business | 2 | 4.3% |
| Education | 8 | 17.4% |
| Literature & Languages | 0 | 0.0% |
| Liberal Arts & History | 2 | 4.3% |
| Visual & Performing Arts | 2 | 4.3% |
| Communications | 0 | 0.0% |
| Arts & Humanities | 12 | 26.1% |
| Total | 46 | 100.0% |
Transportation & Commute in Pitkin
Vehicle Availability by Sex in Pitkin
The most prevalent vehicle ownership categories in Pitkin are males with 2 vehicles (20, accounting for 76.9%) and females with 2 vehicles (17, making up 74.1%).
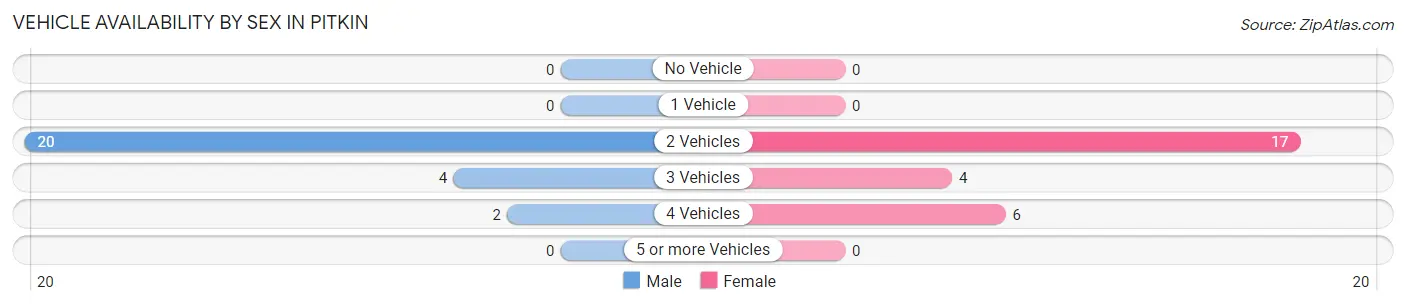
| Vehicles Available | Male | Female |
| No Vehicle | 0 (0.0%) | 0 (0.0%) |
| 1 Vehicle | 0 (0.0%) | 0 (0.0%) |
| 2 Vehicles | 20 (76.9%) | 17 (63.0%) |
| 3 Vehicles | 4 (15.4%) | 4 (14.8%) |
| 4 Vehicles | 2 (7.7%) | 6 (22.2%) |
| 5 or more Vehicles | 0 (0.0%) | 0 (0.0%) |
| Total | 26 (100.0%) | 27 (100.0%) |
Commute Time in Pitkin
The most frequently occuring commute durations in Pitkin are 15 to 19 minutes (8 commuters, 34.8%), 40 to 44 minutes (6 commuters, 26.1%), and 45 to 59 minutes (4 commuters, 17.4%).
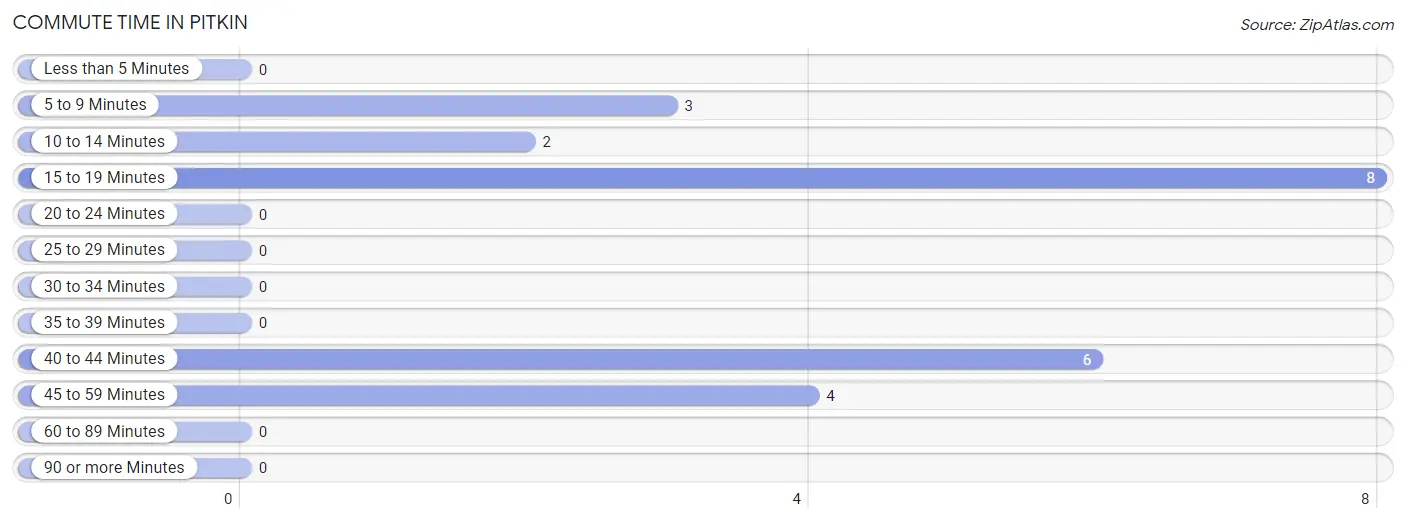
| Commute Time | # Commuters | % Commuters |
| Less than 5 Minutes | 0 | 0.0% |
| 5 to 9 Minutes | 3 | 13.0% |
| 10 to 14 Minutes | 2 | 8.7% |
| 15 to 19 Minutes | 8 | 34.8% |
| 20 to 24 Minutes | 0 | 0.0% |
| 25 to 29 Minutes | 0 | 0.0% |
| 30 to 34 Minutes | 0 | 0.0% |
| 35 to 39 Minutes | 0 | 0.0% |
| 40 to 44 Minutes | 6 | 26.1% |
| 45 to 59 Minutes | 4 | 17.4% |
| 60 to 89 Minutes | 0 | 0.0% |
| 90 or more Minutes | 0 | 0.0% |
Commute Time by Sex in Pitkin
The most common commute times in Pitkin are 15 to 19 minutes (8 commuters, 57.1%) for males and 40 to 44 minutes (6 commuters, 66.7%) for females.
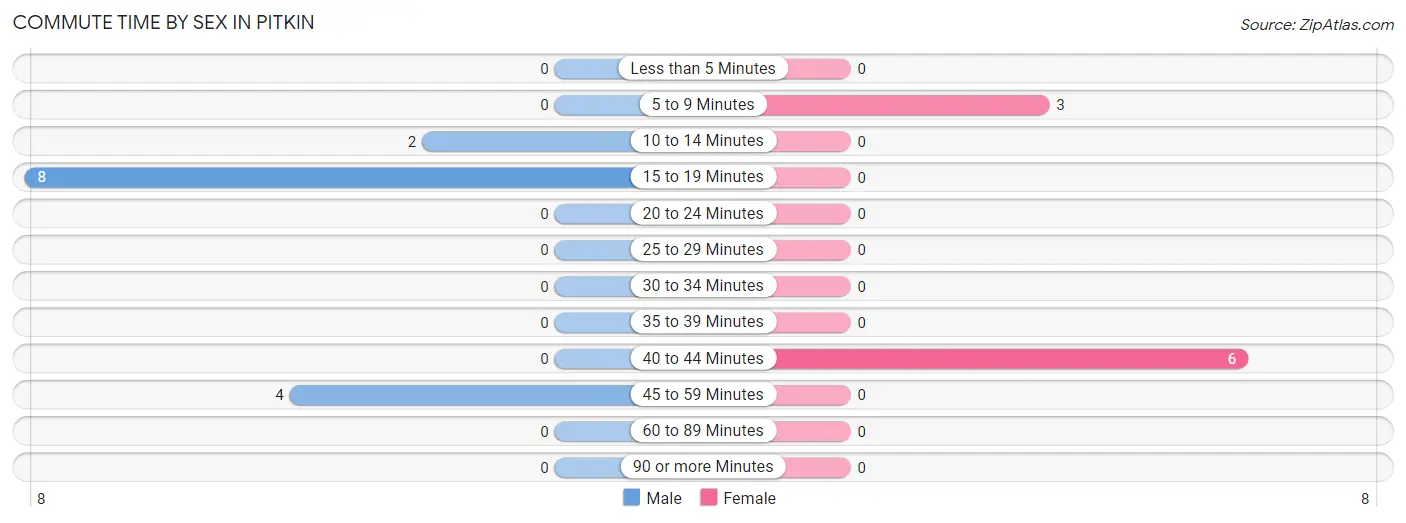
| Commute Time | Male | Female |
| Less than 5 Minutes | 0 (0.0%) | 0 (0.0%) |
| 5 to 9 Minutes | 0 (0.0%) | 3 (33.3%) |
| 10 to 14 Minutes | 2 (14.3%) | 0 (0.0%) |
| 15 to 19 Minutes | 8 (57.1%) | 0 (0.0%) |
| 20 to 24 Minutes | 0 (0.0%) | 0 (0.0%) |
| 25 to 29 Minutes | 0 (0.0%) | 0 (0.0%) |
| 30 to 34 Minutes | 0 (0.0%) | 0 (0.0%) |
| 35 to 39 Minutes | 0 (0.0%) | 0 (0.0%) |
| 40 to 44 Minutes | 0 (0.0%) | 6 (66.7%) |
| 45 to 59 Minutes | 4 (28.6%) | 0 (0.0%) |
| 60 to 89 Minutes | 0 (0.0%) | 0 (0.0%) |
| 90 or more Minutes | 0 (0.0%) | 0 (0.0%) |
Time of Departure to Work by Sex in Pitkin
The most frequent times of departure to work in Pitkin are 6:30 AM to 6:59 AM (10, 71.4%) for males and 8:00 AM to 8:29 AM (4, 44.4%) for females.
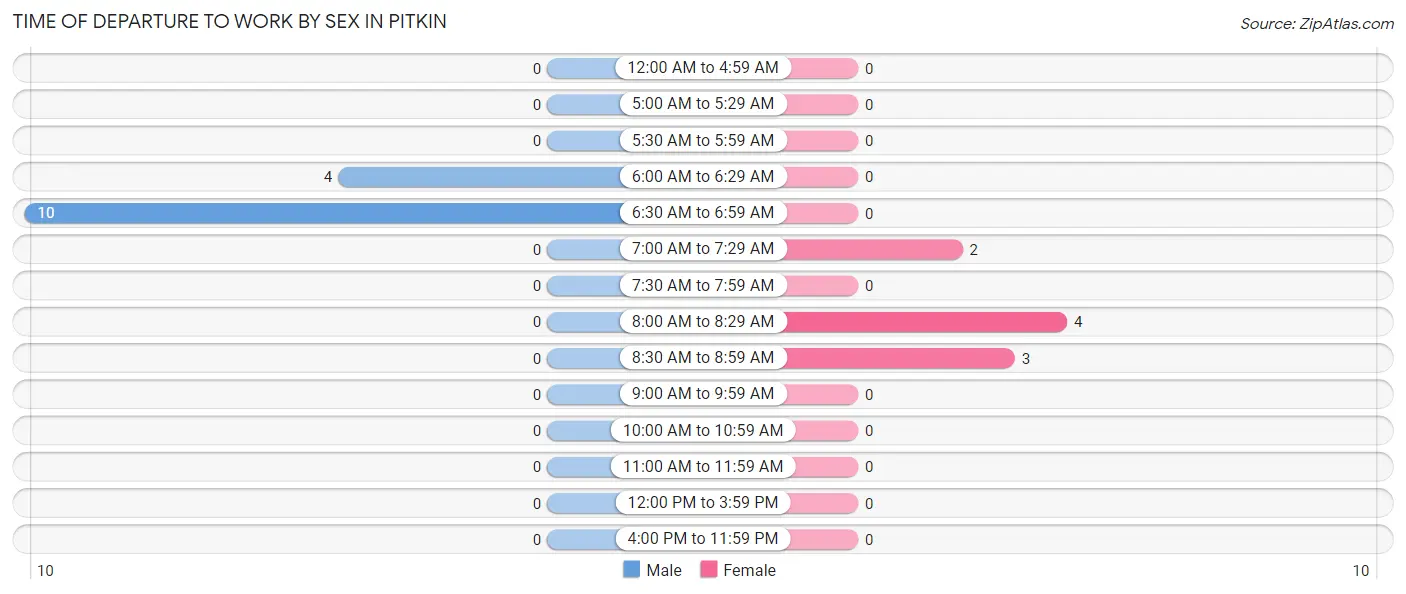
| Time of Departure | Male | Female |
| 12:00 AM to 4:59 AM | 0 (0.0%) | 0 (0.0%) |
| 5:00 AM to 5:29 AM | 0 (0.0%) | 0 (0.0%) |
| 5:30 AM to 5:59 AM | 0 (0.0%) | 0 (0.0%) |
| 6:00 AM to 6:29 AM | 4 (28.6%) | 0 (0.0%) |
| 6:30 AM to 6:59 AM | 10 (71.4%) | 0 (0.0%) |
| 7:00 AM to 7:29 AM | 0 (0.0%) | 2 (22.2%) |
| 7:30 AM to 7:59 AM | 0 (0.0%) | 0 (0.0%) |
| 8:00 AM to 8:29 AM | 0 (0.0%) | 4 (44.4%) |
| 8:30 AM to 8:59 AM | 0 (0.0%) | 3 (33.3%) |
| 9:00 AM to 9:59 AM | 0 (0.0%) | 0 (0.0%) |
| 10:00 AM to 10:59 AM | 0 (0.0%) | 0 (0.0%) |
| 11:00 AM to 11:59 AM | 0 (0.0%) | 0 (0.0%) |
| 12:00 PM to 3:59 PM | 0 (0.0%) | 0 (0.0%) |
| 4:00 PM to 11:59 PM | 0 (0.0%) | 0 (0.0%) |
| Total | 14 (100.0%) | 9 (100.0%) |
Housing Occupancy in Pitkin
Occupancy by Ownership in Pitkin
Of the total 37 dwellings in Pitkin, owner-occupied units account for 34 (91.9%), while renter-occupied units make up 3 (8.1%).
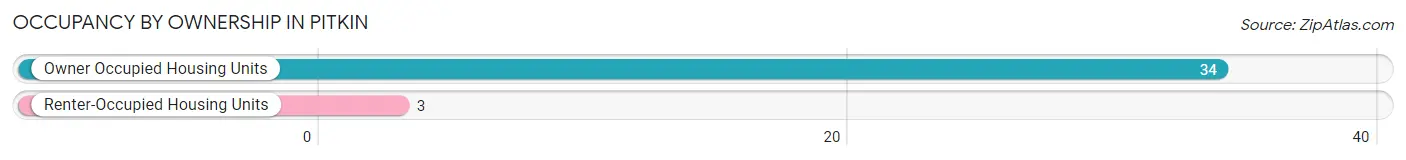
| Occupancy | # Housing Units | % Housing Units |
| Owner Occupied Housing Units | 34 | 91.9% |
| Renter-Occupied Housing Units | 3 | 8.1% |
| Total Occupied Housing Units | 37 | 100.0% |
Occupancy by Household Size in Pitkin
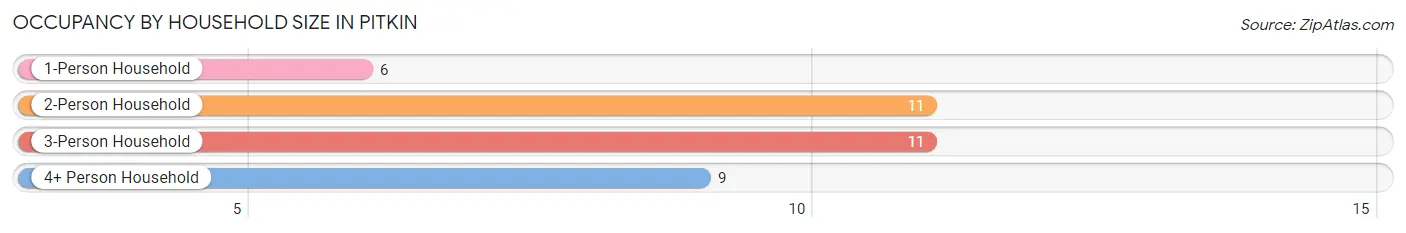
| Household Size | # Housing Units | % Housing Units |
| 1-Person Household | 6 | 16.2% |
| 2-Person Household | 11 | 29.7% |
| 3-Person Household | 11 | 29.7% |
| 4+ Person Household | 9 | 24.3% |
| Total Housing Units | 37 | 100.0% |
Occupancy by Ownership by Household Size in Pitkin
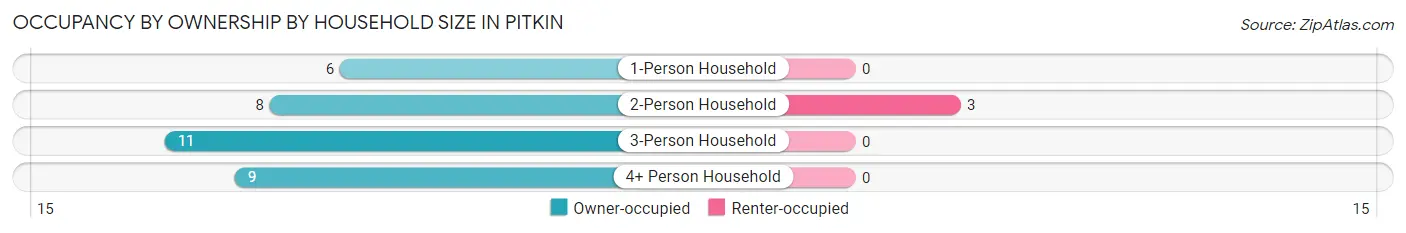
| Household Size | Owner-occupied | Renter-occupied |
| 1-Person Household | 6 (100.0%) | 0 (0.0%) |
| 2-Person Household | 8 (72.7%) | 3 (27.3%) |
| 3-Person Household | 11 (100.0%) | 0 (0.0%) |
| 4+ Person Household | 9 (100.0%) | 0 (0.0%) |
| Total Housing Units | 34 (91.9%) | 3 (8.1%) |
Occupancy by Educational Attainment in Pitkin
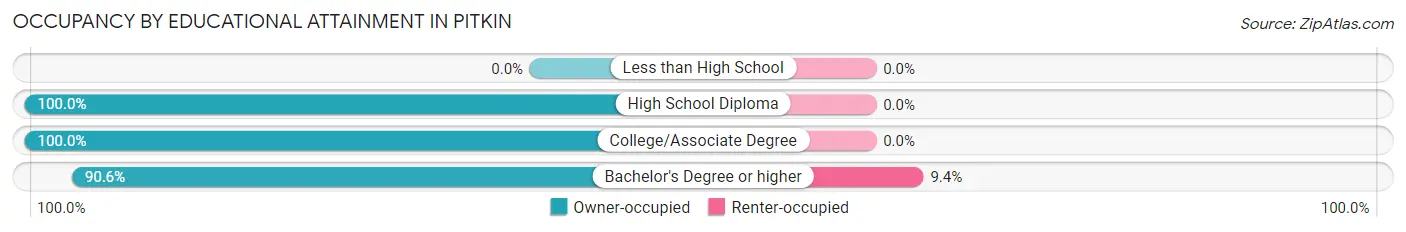
| Household Size | Owner-occupied | Renter-occupied |
| Less than High School | 0 (0.0%) | 0 (0.0%) |
| High School Diploma | 3 (100.0%) | 0 (0.0%) |
| College/Associate Degree | 2 (100.0%) | 0 (0.0%) |
| Bachelor's Degree or higher | 29 (90.6%) | 3 (9.4%) |
Occupancy by Age of Householder in Pitkin
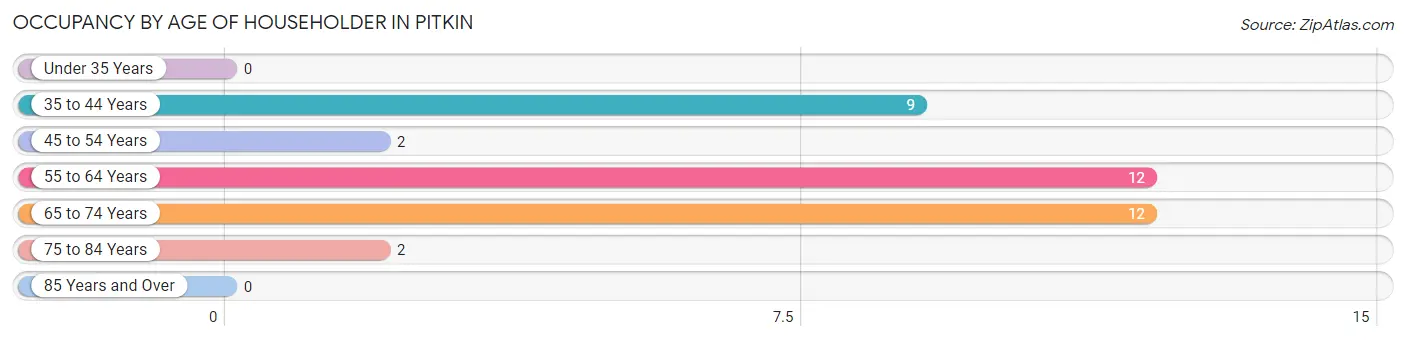
| Age Bracket | # Households | % Households |
| Under 35 Years | 0 | 0.0% |
| 35 to 44 Years | 9 | 24.3% |
| 45 to 54 Years | 2 | 5.4% |
| 55 to 64 Years | 12 | 32.4% |
| 65 to 74 Years | 12 | 32.4% |
| 75 to 84 Years | 2 | 5.4% |
| 85 Years and Over | 0 | 0.0% |
| Total | 37 | 100.0% |
Housing Finances in Pitkin
Median Income by Occupancy in Pitkin
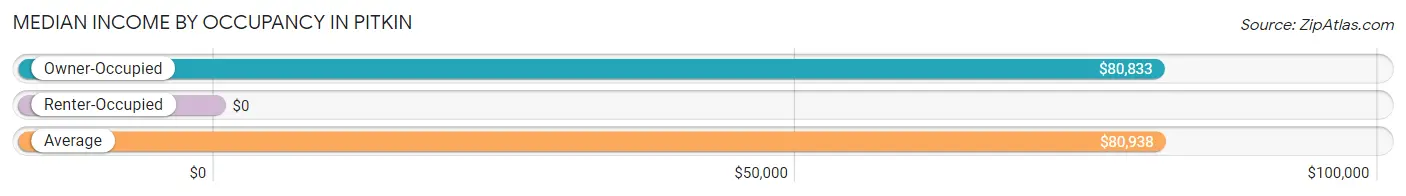
| Occupancy Type | # Households | Median Income |
| Owner-Occupied | 34 (91.9%) | $80,833 |
| Renter-Occupied | 3 (8.1%) | $0 |
| Average | 37 (100.0%) | $80,938 |
Occupancy by Householder Income Bracket in Pitkin
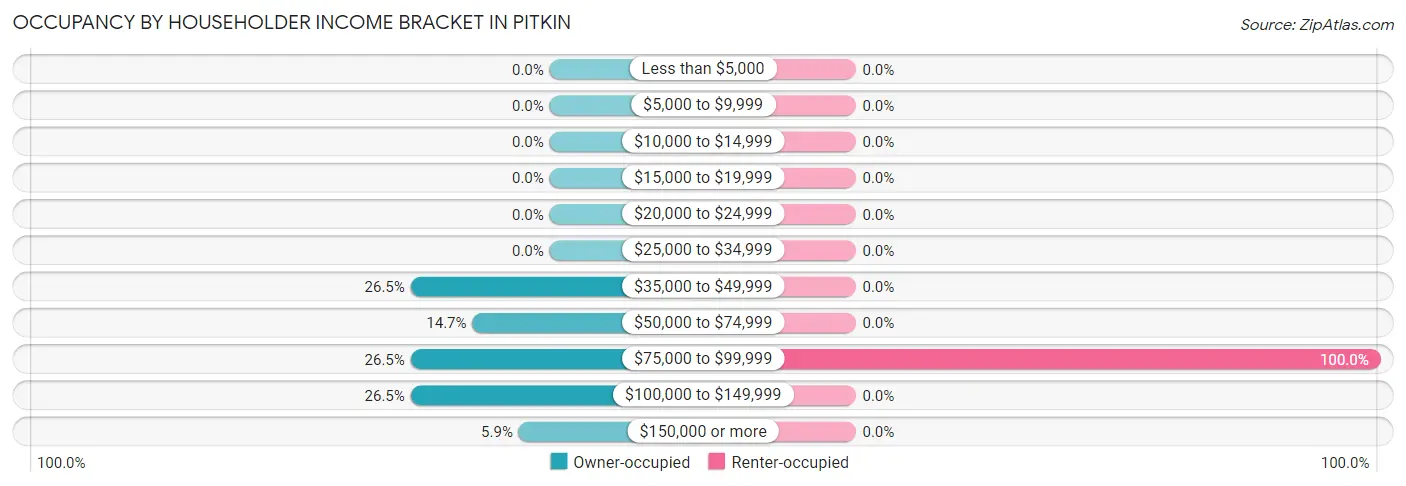
| Income Bracket | Owner-occupied | Renter-occupied |
| Less than $5,000 | 0 (0.0%) | 0 (0.0%) |
| $5,000 to $9,999 | 0 (0.0%) | 0 (0.0%) |
| $10,000 to $14,999 | 0 (0.0%) | 0 (0.0%) |
| $15,000 to $19,999 | 0 (0.0%) | 0 (0.0%) |
| $20,000 to $24,999 | 0 (0.0%) | 0 (0.0%) |
| $25,000 to $34,999 | 0 (0.0%) | 0 (0.0%) |
| $35,000 to $49,999 | 9 (26.5%) | 0 (0.0%) |
| $50,000 to $74,999 | 5 (14.7%) | 0 (0.0%) |
| $75,000 to $99,999 | 9 (26.5%) | 3 (100.0%) |
| $100,000 to $149,999 | 9 (26.5%) | 0 (0.0%) |
| $150,000 or more | 2 (5.9%) | 0 (0.0%) |
| Total | 34 (100.0%) | 3 (100.0%) |
Monthly Housing Cost Tiers in Pitkin
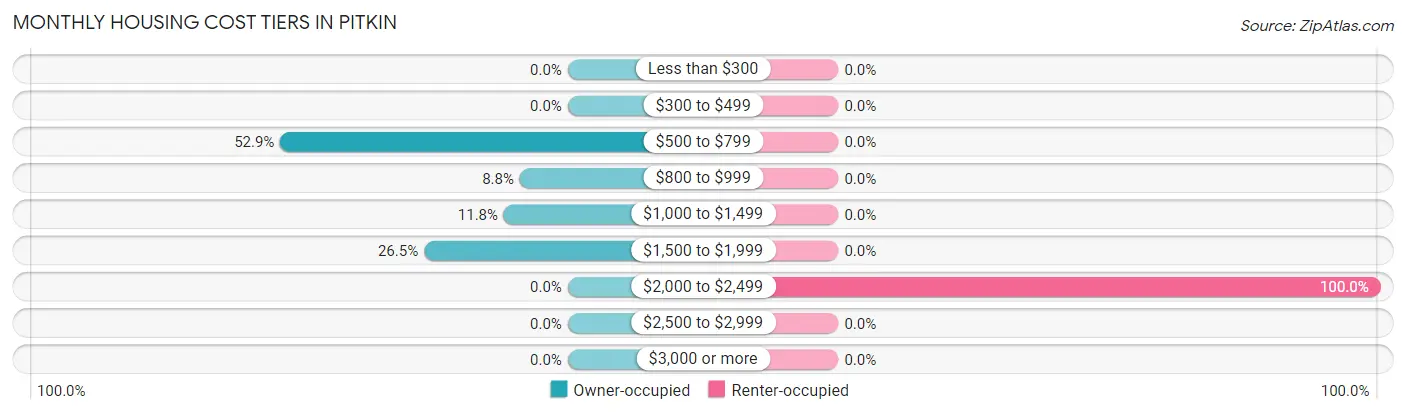
| Monthly Cost | Owner-occupied | Renter-occupied |
| Less than $300 | 0 (0.0%) | 0 (0.0%) |
| $300 to $499 | 0 (0.0%) | 0 (0.0%) |
| $500 to $799 | 18 (52.9%) | 0 (0.0%) |
| $800 to $999 | 3 (8.8%) | 0 (0.0%) |
| $1,000 to $1,499 | 4 (11.8%) | 0 (0.0%) |
| $1,500 to $1,999 | 9 (26.5%) | 0 (0.0%) |
| $2,000 to $2,499 | 0 (0.0%) | 3 (100.0%) |
| $2,500 to $2,999 | 0 (0.0%) | 0 (0.0%) |
| $3,000 or more | 0 (0.0%) | 0 (0.0%) |
| Total | 34 (100.0%) | 3 (100.0%) |
Physical Housing Characteristics in Pitkin
Housing Structures in Pitkin
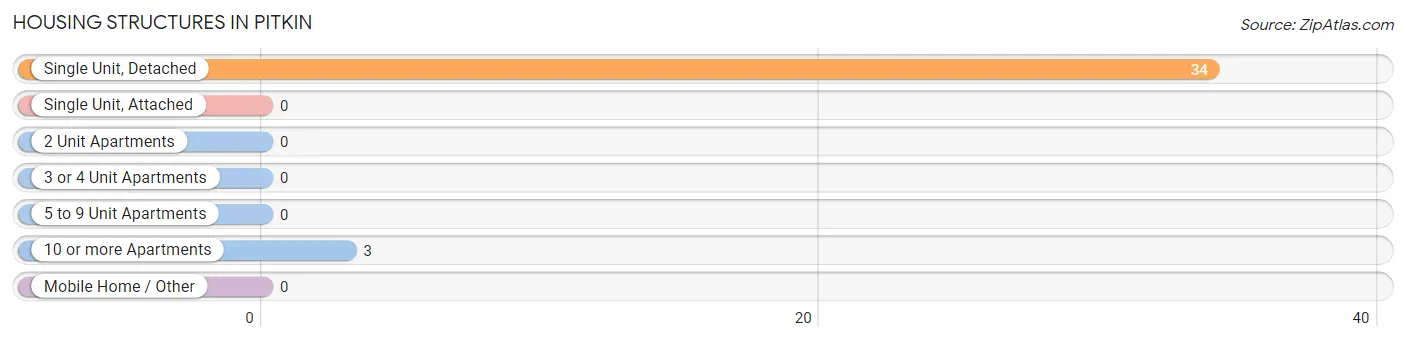
| Structure Type | # Housing Units | % Housing Units |
| Single Unit, Detached | 34 | 91.9% |
| Single Unit, Attached | 0 | 0.0% |
| 2 Unit Apartments | 0 | 0.0% |
| 3 or 4 Unit Apartments | 0 | 0.0% |
| 5 to 9 Unit Apartments | 0 | 0.0% |
| 10 or more Apartments | 3 | 8.1% |
| Mobile Home / Other | 0 | 0.0% |
| Total | 37 | 100.0% |
Housing Structures by Occupancy in Pitkin
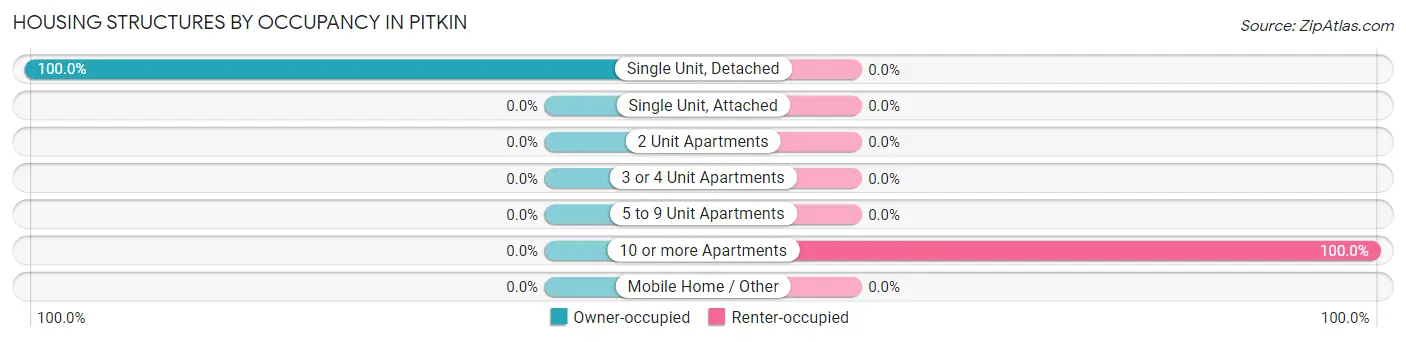
| Structure Type | Owner-occupied | Renter-occupied |
| Single Unit, Detached | 34 (100.0%) | 0 (0.0%) |
| Single Unit, Attached | 0 (0.0%) | 0 (0.0%) |
| 2 Unit Apartments | 0 (0.0%) | 0 (0.0%) |
| 3 or 4 Unit Apartments | 0 (0.0%) | 0 (0.0%) |
| 5 to 9 Unit Apartments | 0 (0.0%) | 0 (0.0%) |
| 10 or more Apartments | 0 (0.0%) | 3 (100.0%) |
| Mobile Home / Other | 0 (0.0%) | 0 (0.0%) |
| Total | 34 (91.9%) | 3 (8.1%) |
Housing Structures by Number of Rooms in Pitkin
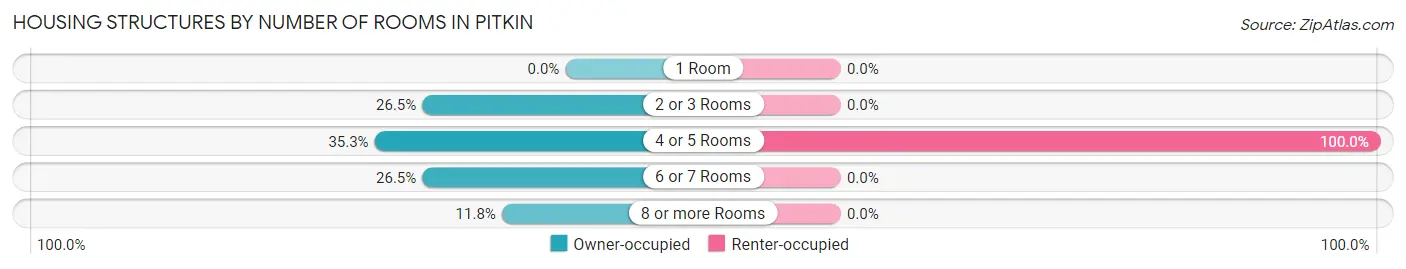
| Number of Rooms | Owner-occupied | Renter-occupied |
| 1 Room | 0 (0.0%) | 0 (0.0%) |
| 2 or 3 Rooms | 9 (26.5%) | 0 (0.0%) |
| 4 or 5 Rooms | 12 (35.3%) | 3 (100.0%) |
| 6 or 7 Rooms | 9 (26.5%) | 0 (0.0%) |
| 8 or more Rooms | 4 (11.8%) | 0 (0.0%) |
| Total | 34 (100.0%) | 3 (100.0%) |
Housing Structure by Heating Type in Pitkin
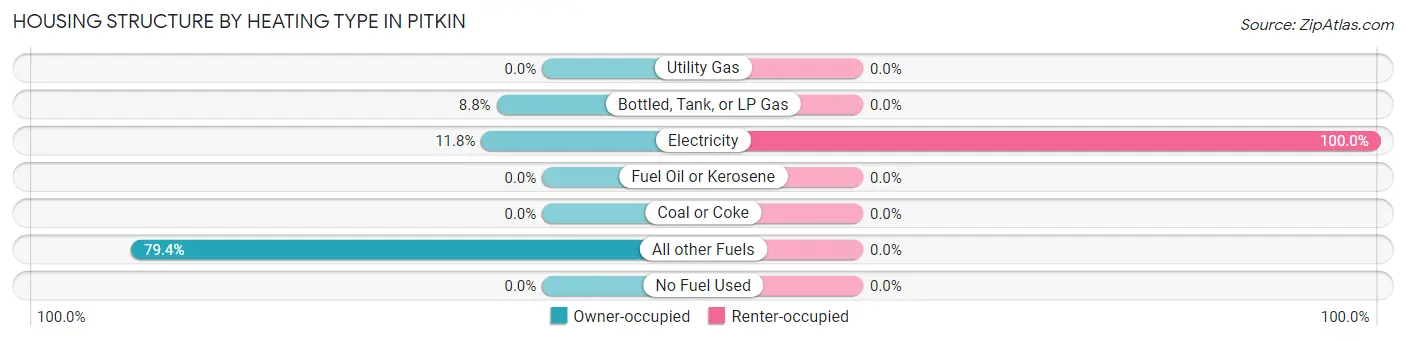
| Heating Type | Owner-occupied | Renter-occupied |
| Utility Gas | 0 (0.0%) | 0 (0.0%) |
| Bottled, Tank, or LP Gas | 3 (8.8%) | 0 (0.0%) |
| Electricity | 4 (11.8%) | 3 (100.0%) |
| Fuel Oil or Kerosene | 0 (0.0%) | 0 (0.0%) |
| Coal or Coke | 0 (0.0%) | 0 (0.0%) |
| All other Fuels | 27 (79.4%) | 0 (0.0%) |
| No Fuel Used | 0 (0.0%) | 0 (0.0%) |
| Total | 34 (100.0%) | 3 (100.0%) |
Household Vehicle Usage in Pitkin
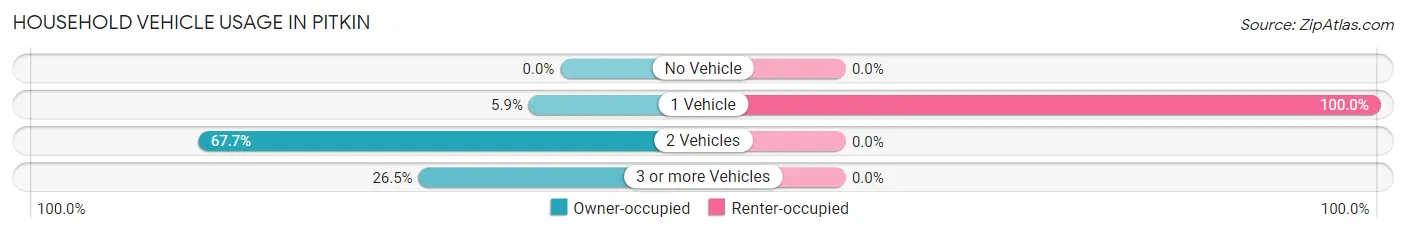
| Vehicles per Household | Owner-occupied | Renter-occupied |
| No Vehicle | 0 (0.0%) | 0 (0.0%) |
| 1 Vehicle | 2 (5.9%) | 3 (100.0%) |
| 2 Vehicles | 23 (67.6%) | 0 (0.0%) |
| 3 or more Vehicles | 9 (26.5%) | 0 (0.0%) |
| Total | 34 (100.0%) | 3 (100.0%) |
Real Estate & Mortgages in Pitkin
Real Estate and Mortgage Overview in Pitkin
| Characteristic | Without Mortgage | With Mortgage |
| Housing Units | 18 | 16 |
| Median Property Value | - | - |
| Median Household Income | $97,500 | $2 |
| Monthly Housing Costs | $636 | $0 |
| Real Estate Taxes | $1,321 | $0 |
Property Value by Mortgage Status in Pitkin
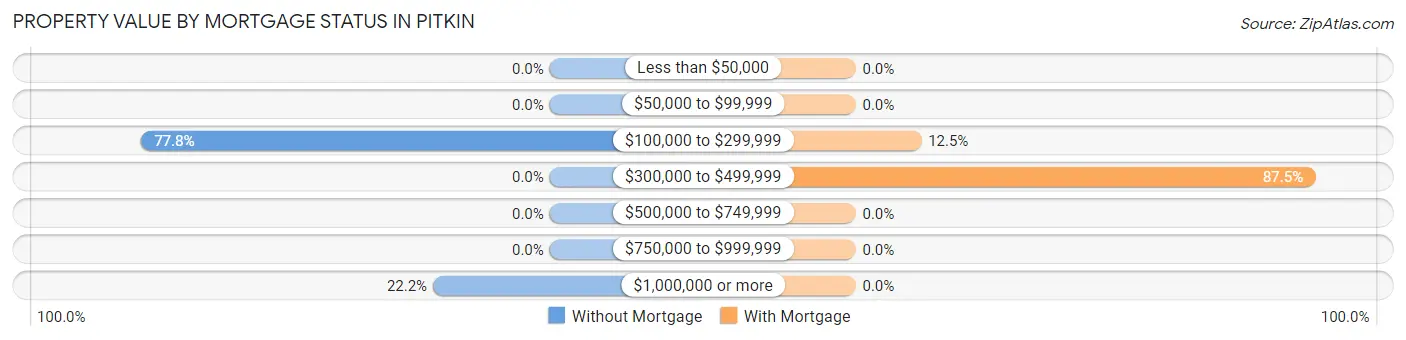
| Property Value | Without Mortgage | With Mortgage |
| Less than $50,000 | 0 (0.0%) | 0 (0.0%) |
| $50,000 to $99,999 | 0 (0.0%) | 0 (0.0%) |
| $100,000 to $299,999 | 14 (77.8%) | 2 (12.5%) |
| $300,000 to $499,999 | 0 (0.0%) | 14 (87.5%) |
| $500,000 to $749,999 | 0 (0.0%) | 0 (0.0%) |
| $750,000 to $999,999 | 0 (0.0%) | 0 (0.0%) |
| $1,000,000 or more | 4 (22.2%) | 0 (0.0%) |
| Total | 18 (100.0%) | 16 (100.0%) |
Household Income by Mortgage Status in Pitkin
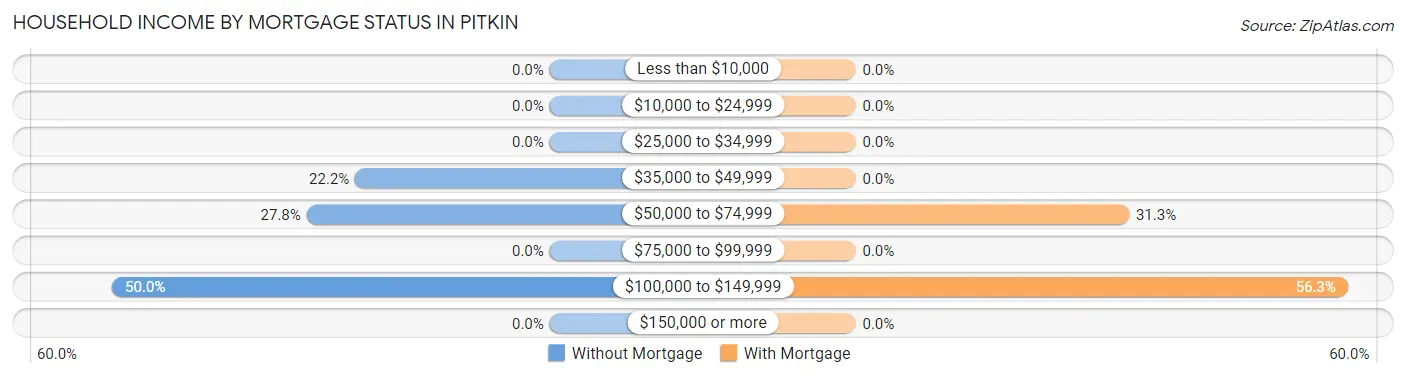
| Household Income | Without Mortgage | With Mortgage |
| Less than $10,000 | 0 (0.0%) | 0 (0.0%) |
| $10,000 to $24,999 | 0 (0.0%) | 0 (0.0%) |
| $25,000 to $34,999 | 0 (0.0%) | 0 (0.0%) |
| $35,000 to $49,999 | 4 (22.2%) | 0 (0.0%) |
| $50,000 to $74,999 | 5 (27.8%) | 5 (31.2%) |
| $75,000 to $99,999 | 0 (0.0%) | 0 (0.0%) |
| $100,000 to $149,999 | 9 (50.0%) | 9 (56.2%) |
| $150,000 or more | 0 (0.0%) | 0 (0.0%) |
| Total | 18 (100.0%) | 16 (100.0%) |
Property Value to Household Income Ratio in Pitkin
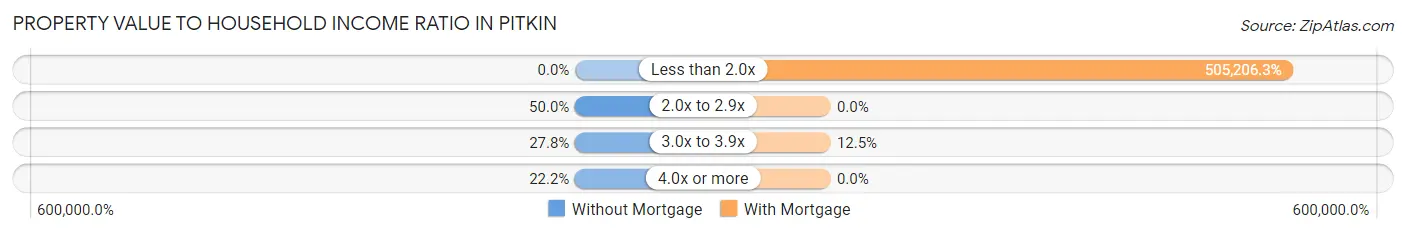
| Value-to-Income Ratio | Without Mortgage | With Mortgage |
| Less than 2.0x | 0 (0.0%) | 80,833 (505,206.2%) |
| 2.0x to 2.9x | 9 (50.0%) | 0 (0.0%) |
| 3.0x to 3.9x | 5 (27.8%) | 2 (12.5%) |
| 4.0x or more | 4 (22.2%) | 0 (0.0%) |
| Total | 18 (100.0%) | 16 (100.0%) |
Real Estate Taxes by Mortgage Status in Pitkin
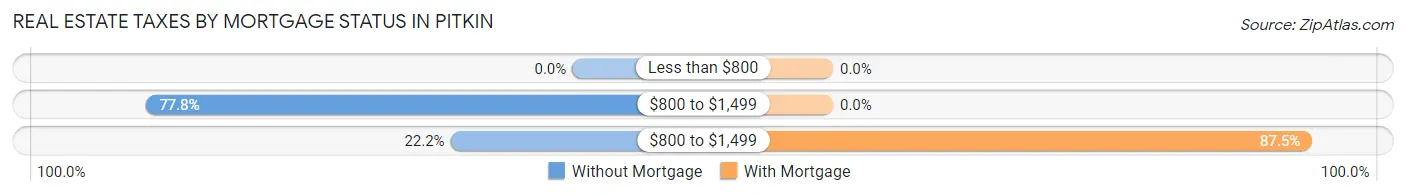
| Property Taxes | Without Mortgage | With Mortgage |
| Less than $800 | 0 (0.0%) | 0 (0.0%) |
| $800 to $1,499 | 14 (77.8%) | 0 (0.0%) |
| $800 to $1,499 | 4 (22.2%) | 14 (87.5%) |
| Total | 18 (100.0%) | 16 (100.0%) |
Health & Disability in Pitkin
Health Insurance Coverage by Age in Pitkin
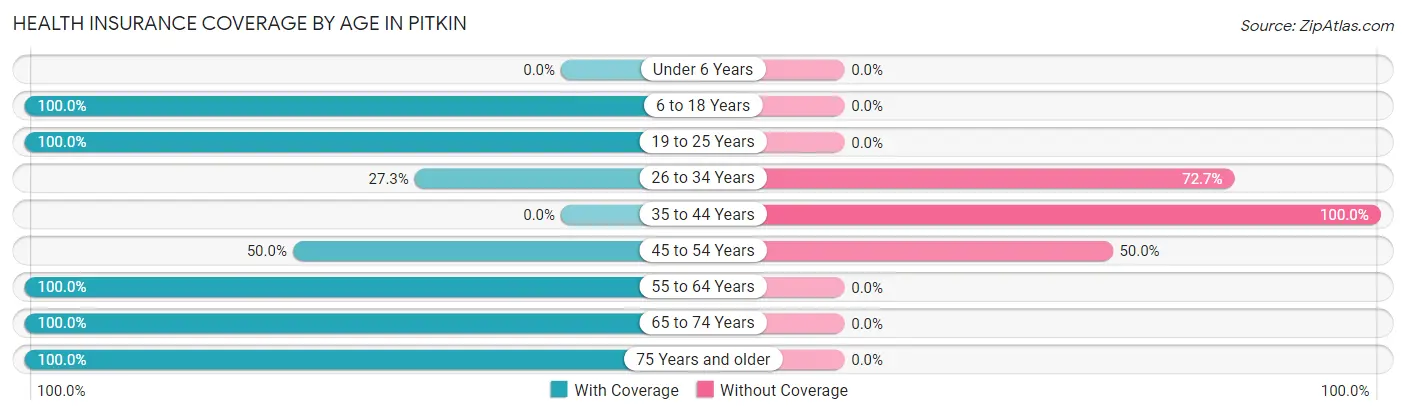
| Age Bracket | With Coverage | Without Coverage |
| Under 6 Years | 0 (0.0%) | 0 (0.0%) |
| 6 to 18 Years | 42 (100.0%) | 0 (0.0%) |
| 19 to 25 Years | 4 (100.0%) | 0 (0.0%) |
| 26 to 34 Years | 3 (27.3%) | 8 (72.7%) |
| 35 to 44 Years | 0 (0.0%) | 9 (100.0%) |
| 45 to 54 Years | 2 (50.0%) | 2 (50.0%) |
| 55 to 64 Years | 32 (100.0%) | 0 (0.0%) |
| 65 to 74 Years | 16 (100.0%) | 0 (0.0%) |
| 75 Years and older | 4 (100.0%) | 0 (0.0%) |
| Total | 103 (84.4%) | 19 (15.6%) |
Health Insurance Coverage by Citizenship Status in Pitkin
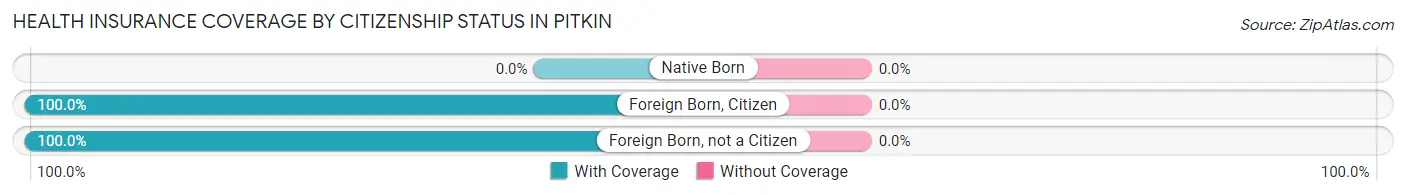
| Citizenship Status | With Coverage | Without Coverage |
| Native Born | 0 (0.0%) | 0 (0.0%) |
| Foreign Born, Citizen | 42 (100.0%) | 0 (0.0%) |
| Foreign Born, not a Citizen | 4 (100.0%) | 0 (0.0%) |
Health Insurance Coverage by Household Income in Pitkin
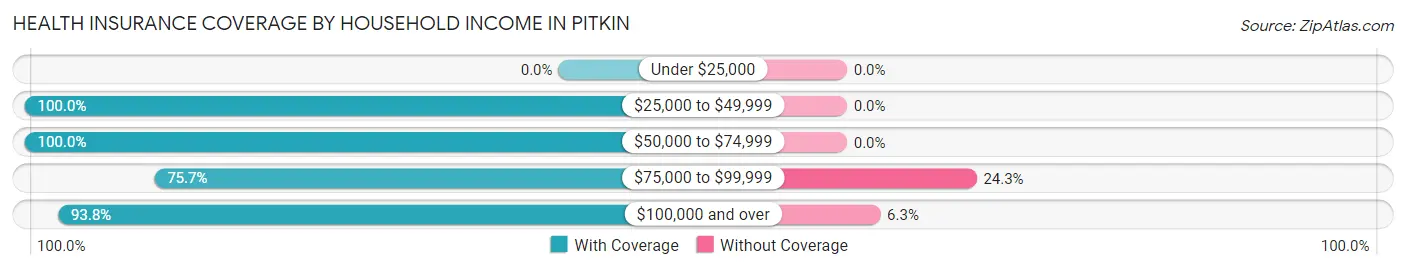
| Household Income | With Coverage | Without Coverage |
| Under $25,000 | 0 (0.0%) | 0 (0.0%) |
| $25,000 to $49,999 | 13 (100.0%) | 0 (0.0%) |
| $50,000 to $74,999 | 7 (100.0%) | 0 (0.0%) |
| $75,000 to $99,999 | 53 (75.7%) | 17 (24.3%) |
| $100,000 and over | 30 (93.8%) | 2 (6.2%) |
Public vs Private Health Insurance Coverage by Age in Pitkin
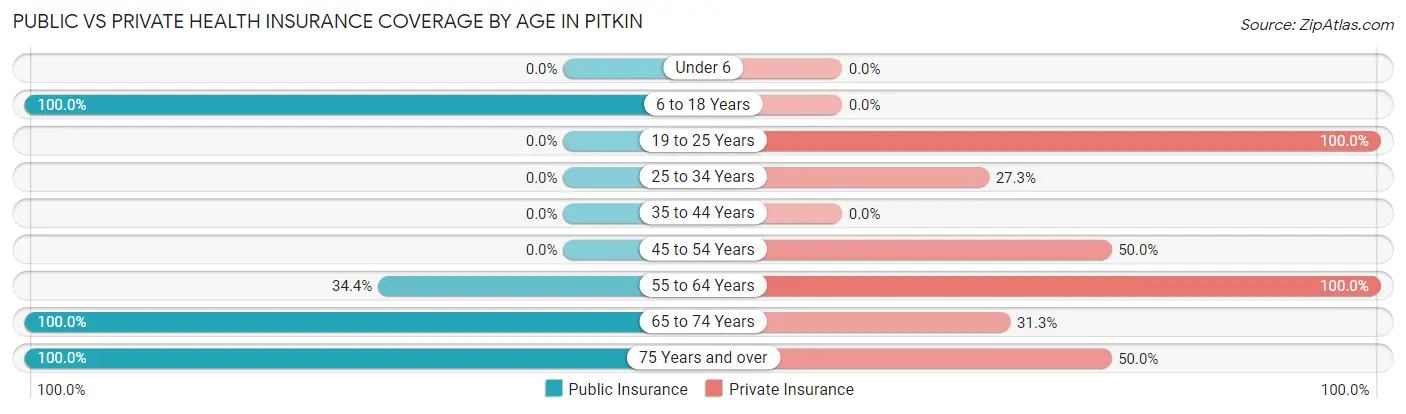
| Age Bracket | Public Insurance | Private Insurance |
| Under 6 | 0 (0.0%) | 0 (0.0%) |
| 6 to 18 Years | 42 (100.0%) | 0 (0.0%) |
| 19 to 25 Years | 0 (0.0%) | 4 (100.0%) |
| 25 to 34 Years | 0 (0.0%) | 3 (27.3%) |
| 35 to 44 Years | 0 (0.0%) | 0 (0.0%) |
| 45 to 54 Years | 0 (0.0%) | 2 (50.0%) |
| 55 to 64 Years | 11 (34.4%) | 32 (100.0%) |
| 65 to 74 Years | 16 (100.0%) | 5 (31.2%) |
| 75 Years and over | 4 (100.0%) | 2 (50.0%) |
| Total | 73 (59.8%) | 48 (39.3%) |
Disability Status by Sex by Age in Pitkin
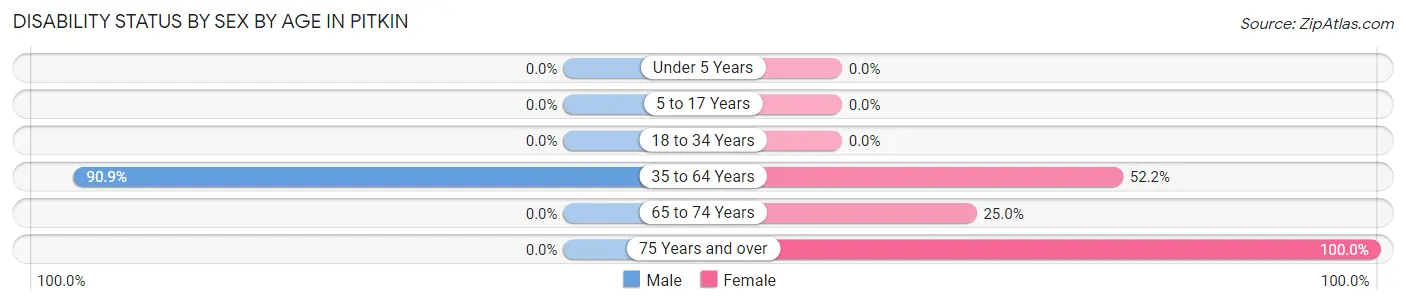
| Age Bracket | Male | Female |
| Under 5 Years | 0 (0.0%) | 0 (0.0%) |
| 5 to 17 Years | 0 (0.0%) | 0 (0.0%) |
| 18 to 34 Years | 0 (0.0%) | 0 (0.0%) |
| 35 to 64 Years | 20 (90.9%) | 12 (52.2%) |
| 65 to 74 Years | 0 (0.0%) | 3 (25.0%) |
| 75 Years and over | 0 (0.0%) | 2 (100.0%) |
Disability Class by Sex by Age in Pitkin
Disability Class: Hearing Difficulty
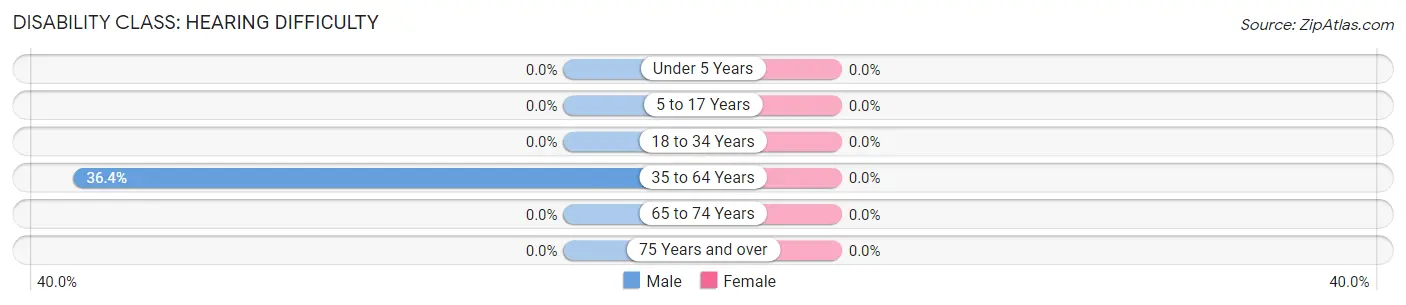
| Age Bracket | Male | Female |
| Under 5 Years | 0 (0.0%) | 0 (0.0%) |
| 5 to 17 Years | 0 (0.0%) | 0 (0.0%) |
| 18 to 34 Years | 0 (0.0%) | 0 (0.0%) |
| 35 to 64 Years | 8 (36.4%) | 0 (0.0%) |
| 65 to 74 Years | 0 (0.0%) | 0 (0.0%) |
| 75 Years and over | 0 (0.0%) | 0 (0.0%) |
Disability Class: Vision Difficulty
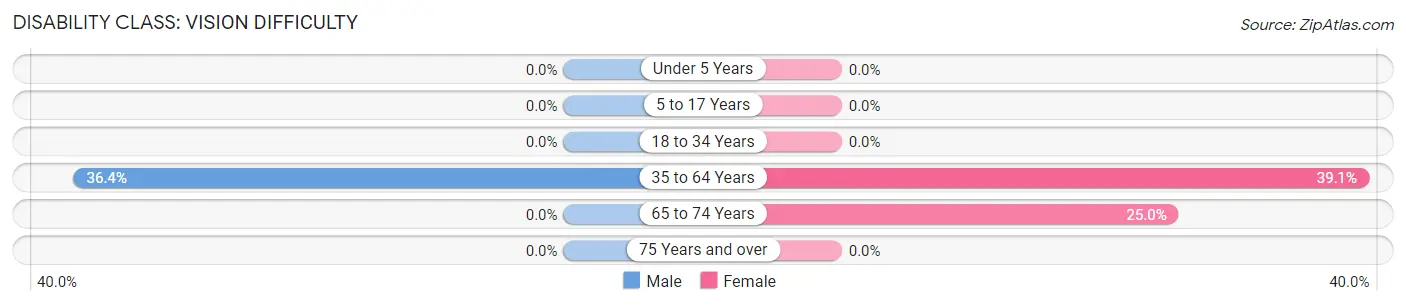
| Age Bracket | Male | Female |
| Under 5 Years | 0 (0.0%) | 0 (0.0%) |
| 5 to 17 Years | 0 (0.0%) | 0 (0.0%) |
| 18 to 34 Years | 0 (0.0%) | 0 (0.0%) |
| 35 to 64 Years | 8 (36.4%) | 9 (39.1%) |
| 65 to 74 Years | 0 (0.0%) | 3 (25.0%) |
| 75 Years and over | 0 (0.0%) | 0 (0.0%) |
Disability Class: Cognitive Difficulty
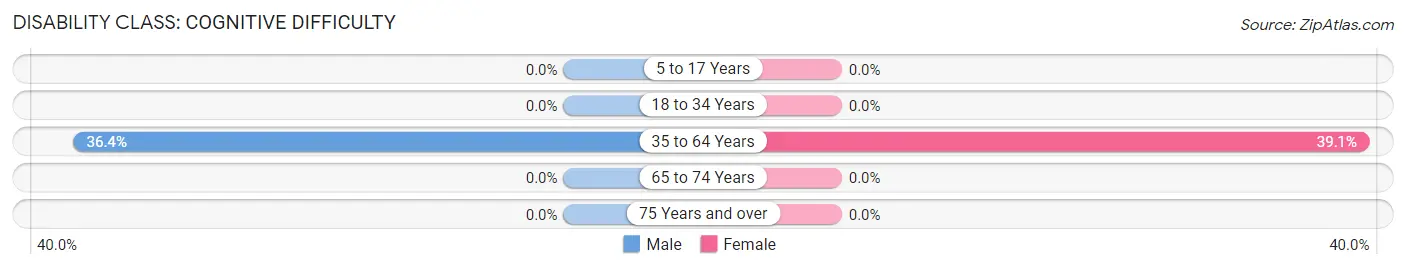
| Age Bracket | Male | Female |
| 5 to 17 Years | 0 (0.0%) | 0 (0.0%) |
| 18 to 34 Years | 0 (0.0%) | 0 (0.0%) |
| 35 to 64 Years | 8 (36.4%) | 9 (39.1%) |
| 65 to 74 Years | 0 (0.0%) | 0 (0.0%) |
| 75 Years and over | 0 (0.0%) | 0 (0.0%) |
Disability Class: Ambulatory Difficulty
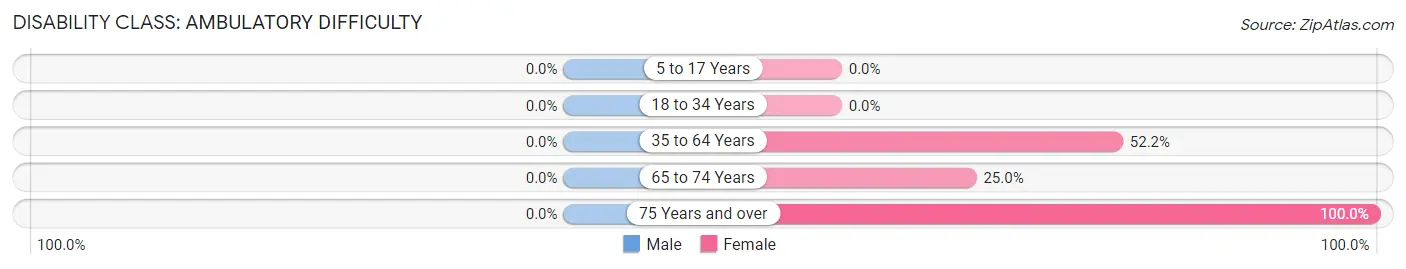
| Age Bracket | Male | Female |
| 5 to 17 Years | 0 (0.0%) | 0 (0.0%) |
| 18 to 34 Years | 0 (0.0%) | 0 (0.0%) |
| 35 to 64 Years | 0 (0.0%) | 12 (52.2%) |
| 65 to 74 Years | 0 (0.0%) | 3 (25.0%) |
| 75 Years and over | 0 (0.0%) | 2 (100.0%) |
Disability Class: Self-Care Difficulty
| Age Bracket | Male | Female |
| 5 to 17 Years | 0 (0.0%) | 0 (0.0%) |
| 18 to 34 Years | 0 (0.0%) | 0 (0.0%) |
| 35 to 64 Years | 0 (0.0%) | 0 (0.0%) |
| 65 to 74 Years | 0 (0.0%) | 0 (0.0%) |
| 75 Years and over | 0 (0.0%) | 0 (0.0%) |
Technology Access in Pitkin
Computing Device Access in Pitkin
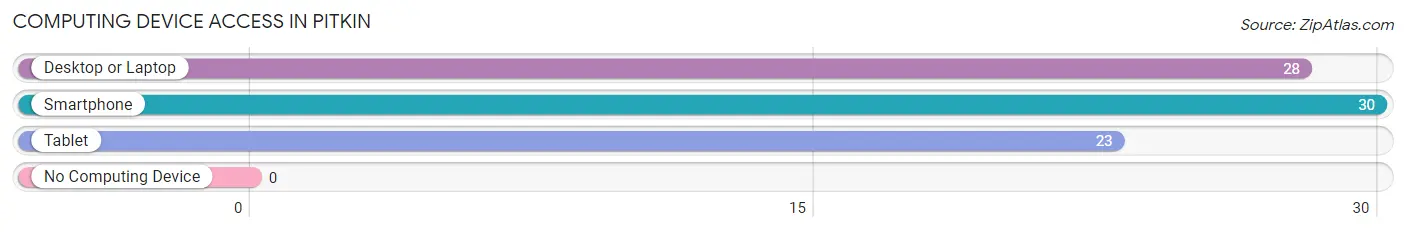
| Device Type | # Households | % Households |
| Desktop or Laptop | 28 | 75.7% |
| Smartphone | 30 | 81.1% |
| Tablet | 23 | 62.2% |
| No Computing Device | 0 | 0.0% |
| Total | 37 | 100.0% |
Internet Access in Pitkin
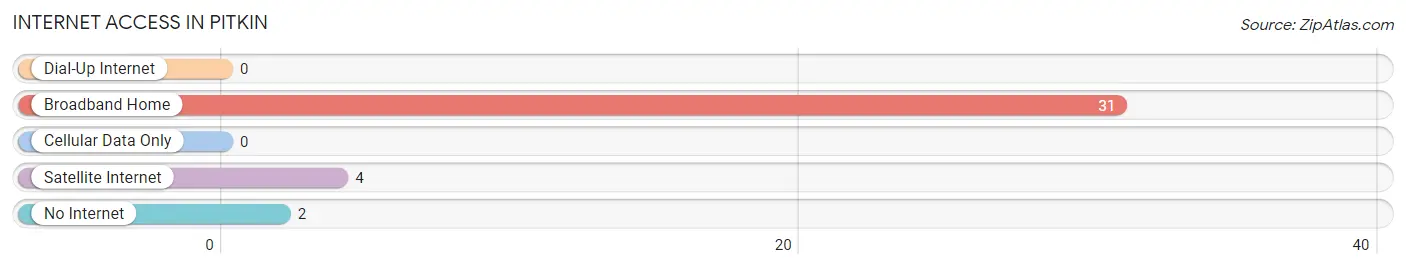
| Internet Type | # Households | % Households |
| Dial-Up Internet | 0 | 0.0% |
| Broadband Home | 31 | 83.8% |
| Cellular Data Only | 0 | 0.0% |
| Satellite Internet | 4 | 10.8% |
| No Internet | 2 | 5.4% |
| Total | 37 | 100.0% |
Pitkin Summary
Pitkin is a small town located in Gunnison County, Colorado, United States. It is situated in the Gunnison Valley, at the base of the Elk Mountains. The town has a population of approximately 200 people, and is located at an elevation of 8,945 feet.
History
Pitkin was founded in 1881 by miners who were searching for gold and silver in the area. The town was named after the nearby Pitkin Creek, which was named after a prospector named John Pitkin. The town quickly grew, and by 1883, it had a population of over 500 people. The town was home to several saloons, stores, and a post office.
In the late 1800s, the town was a major hub for the mining industry in the area. The town was home to several mines, including the Pitkin Mine, which was one of the largest in the area. The town also had a smelter, which was used to process ore from the mines.
In the early 1900s, the mining industry in the area began to decline, and the town's population began to dwindle. By the 1950s, the town had a population of only about 100 people.
Geography
Pitkin is located in the Gunnison Valley, at the base of the Elk Mountains. The town is situated at an elevation of 8,945 feet, and is surrounded by mountains and forests. The town is located near several ski resorts, including Crested Butte and Aspen.
The town is located near several rivers, including the Gunnison River, the Roaring Fork River, and the Crystal River. The town is also located near several lakes, including the Blue Mesa Reservoir, the Taylor Reservoir, and the McPhee Reservoir.
Economy
The economy of Pitkin is largely based on tourism. The town is home to several ski resorts, which attract visitors from all over the world. The town is also home to several restaurants, bars, and shops, which cater to tourists.
The town is also home to several small businesses, including a grocery store, a hardware store, and a gas station. The town is also home to several art galleries, which feature the work of local artists.
Demographics
As of the 2010 census, the population of Pitkin was 200 people. The town is predominantly white, with 95.5% of the population being white. The town also has a small Hispanic population, with 4.5% of the population being Hispanic.
The median household income in Pitkin is $45,000, and the median home value is $250,000. The town has a low unemployment rate, with only 3.3% of the population being unemployed.
Conclusion
Pitkin is a small town located in Gunnison County, Colorado. The town has a population of approximately 200 people, and is situated at an elevation of 8,945 feet. The town's economy is largely based on tourism, and the town is home to several ski resorts, restaurants, bars, and shops. The town is predominantly white, with 95.5% of the population being white. The median household income in Pitkin is $45,000, and the median home value is $250,000.
Common Questions
What is Per Capita Income in Pitkin?
Per Capita income in Pitkin is $26,266.
What is the Median Family Income in Pitkin?
Median Family Income in Pitkin is $81,563.
What is the Median Household income in Pitkin?
Median Household Income in Pitkin is $80,938.
What is Inequality or Gini Index in Pitkin?
Inequality or Gini Index in Pitkin is 0.23.
What is the Total Population of Pitkin?
Total Population of Pitkin is 122.
What is the Total Male Population of Pitkin?
Total Male Population of Pitkin is 65.
What is the Total Female Population of Pitkin?
Total Female Population of Pitkin is 57.
What is the Ratio of Males per 100 Females in Pitkin?
There are 114.04 Males per 100 Females in Pitkin.
What is the Ratio of Females per 100 Males in Pitkin?
There are 87.69 Females per 100 Males in Pitkin.
What is the Median Population Age in Pitkin?
Median Population Age in Pitkin is 35.4 Years.
What is the Average Family Size in Pitkin
Average Family Size in Pitkin is 3.7 People.
What is the Average Household Size in Pitkin
Average Household Size in Pitkin is 3.3 People.
How Large is the Labor Force in Pitkin?
There are 53 People in the Labor Forcein in Pitkin.
What is the Percentage of People in the Labor Force in Pitkin?
66.3% of People are in the Labor Force in Pitkin.