Zip Codes with the Highest Percentage of Self-Employed / Incorporated in Colorado Springs, CO

RELATED REPORTS & OPTIONS

Self-Employed / Incorporated
Population
Families and Households
Female Fertility
Female Fertility (Unmarried)
Race (Community Size)
Race (Percentage)
Ancestry (Community Size)
AfghanAfricanAlaskan AthabascanAlbanianAlsatianAmericanApacheArabArapahoArgentineanArmenianAustralianAustrianBangladeshiBarbadianBasqueBelgianBelizeanBermudanBhutaneseBlackfeetBolivianBrazilianBritishBritish West IndianBulgarianBurmeseCajunCambodianCanadianCape VerdeanCarpatho RusynCelticCentral AmericanCentral American IndianCherokeeCheyenneChickasawChileanChineseChippewaChoctawColombianComancheCosta RicanCreeCreekCroatianCubanCzechCzechoslovakianDanishDelawareDominicanDutchEastern EuropeanEcuadorianEgyptianEnglishEstonianEthiopianEuropeanFilipinoFinnishFrenchFrench CanadianGermanGerman RussianGhanaianGreekGuamanian / ChamorroGuatemalanHaitianHonduranHopiHungarianIcelanderIndian (Asian)IndonesianInupiatIranianIraqiIrishIroquoisIsraeliItalianJamaicanJapaneseJordanianKenyanKoreanLaotianLatvianLebaneseLiberianLithuanianLuxembourgerMacedonianMalaysianMexicanMexican American IndianNative HawaiianNavajoNew ZealanderNicaraguanNigerianNorthern EuropeanNorwegianOkinawanOsagePakistaniPalestinianPanamanianPennsylvania GermanPeruvianPolishPortuguesePotawatomiPuebloPuerto RicanRomanianRussianSalvadoranSamoanScandinavianScotch-IrishScottishSeminoleSerbianShoshoneSiouxSlavicSlovakSloveneSomaliSouth AfricanSouth AmericanSouth American IndianSpaniardSpanishSpanish AmericanSpanish American IndianSri LankanSubsaharan AfricanSudaneseSwedishSwissSyrianThaiTohono O'OdhamTrinidadian and TobagonianTurkishUkrainianUteVenezuelanWelshWest IndianYaquiYugoslavian
Ancestry (Percentage)
AfghanAfricanAlaskan AthabascanAlbanianAlsatianAmericanApacheArabArapahoArgentineanArmenianAustralianAustrianBangladeshiBarbadianBasqueBelgianBelizeanBermudanBhutaneseBlackfeetBolivianBrazilianBritishBritish West IndianBulgarianBurmeseCajunCambodianCanadianCape VerdeanCarpatho RusynCelticCentral AmericanCentral American IndianCherokeeCheyenneChickasawChileanChineseChippewaChoctawColombianComancheCosta RicanCreeCreekCroatianCubanCzechCzechoslovakianDanishDelawareDominicanDutchEastern EuropeanEcuadorianEgyptianEnglishEstonianEthiopianEuropeanFilipinoFinnishFrenchFrench CanadianGermanGerman RussianGhanaianGreekGuamanian / ChamorroGuatemalanHaitianHonduranHopiHungarianIcelanderIndian (Asian)IndonesianInupiatIranianIraqiIrishIroquoisIsraeliItalianJamaicanJapaneseJordanianKenyanKoreanLaotianLatvianLebaneseLiberianLithuanianLuxembourgerMacedonianMalaysianMexicanMexican American IndianNative HawaiianNavajoNew ZealanderNicaraguanNigerianNorthern EuropeanNorwegianOkinawanOsagePakistaniPalestinianPanamanianPennsylvania GermanPeruvianPolishPortuguesePotawatomiPuebloPuerto RicanRomanianRussianSalvadoranSamoanScandinavianScotch-IrishScottishSeminoleSerbianShoshoneSiouxSlavicSlovakSloveneSomaliSouth AfricanSouth AmericanSouth American IndianSpaniardSpanishSpanish AmericanSpanish American IndianSri LankanSubsaharan AfricanSudaneseSwedishSwissSyrianThaiTohono O'OdhamTrinidadian and TobagonianTurkishUkrainianUteVenezuelanWelshWest IndianYaquiYugoslavian
Immigrant Origin (Total)
AfghanistanAfricaArgentinaArmeniaAsiaAustraliaAustriaBangladeshBarbadosBelarusBoliviaBosnia and HerzegovinaBrazilBulgariaBurma / MyanmarCambodiaCameroonCanadaCaribbeanCentral AmericaChileChinaColombiaCosta RicaCroatiaCubaCzechoslovakiaDenmarkDominican RepublicEastern AfricaEastern AsiaEastern EuropeEcuadorEgyptEl SalvadorEnglandEritreaEthiopiaEuropeFranceGermanyGhanaGuatemalaGuyanaHaitiHondurasHong KongHungaryIndiaIndonesiaIranIraqIrelandIsraelItalyJamaicaJapanKazakhstanKenyaKoreaLaosLatin AmericaLebanonLiberiaLithuaniaMexicoMiddle AfricaMoldovaNepalNetherlandsNicaraguaNigeriaNorth MacedoniaNorthern AfricaNorthern EuropeNorwayOceaniaPakistanPanamaPeruPhilippinesPolandRomaniaRussiaScotlandSingaporeSomaliaSouth AfricaSouth AmericaSouth Central AsiaSouth Eastern AsiaSouthern EuropeSpainSt. Vincent and the GrenadinesSwedenSwitzerlandSyriaTaiwanThailandTrinidad and TobagoTurkeyUgandaUkraineUzbekistanVenezuelaVietnamWest IndiesWestern AfricaWestern AsiaWestern EuropeZaireZimbabwe
Immigrant Origin (Percentage)
AfghanistanAfricaArgentinaArmeniaAsiaAustraliaAustriaBangladeshBarbadosBelarusBoliviaBosnia and HerzegovinaBrazilBulgariaBurma / MyanmarCambodiaCameroonCanadaCaribbeanCentral AmericaChileChinaColombiaCosta RicaCroatiaCubaCzechoslovakiaDenmarkDominican RepublicEastern AfricaEastern AsiaEastern EuropeEcuadorEgyptEl SalvadorEnglandEritreaEthiopiaEuropeFranceGermanyGhanaGuatemalaGuyanaHaitiHondurasHong KongHungaryIndiaIndonesiaIranIraqIrelandIsraelItalyJamaicaJapanKazakhstanKenyaKoreaLaosLatin AmericaLebanonLiberiaLithuaniaMexicoMiddle AfricaMoldovaNepalNetherlandsNicaraguaNigeriaNorth MacedoniaNorthern AfricaNorthern EuropeNorwayOceaniaPakistanPanamaPeruPhilippinesPolandRomaniaRussiaScotlandSingaporeSomaliaSouth AfricaSouth AmericaSouth Central AsiaSouth Eastern AsiaSouthern EuropeSpainSt. Vincent and the GrenadinesSwedenSwitzerlandSyriaTaiwanThailandTrinidad and TobagoTurkeyUgandaUkraineUzbekistanVenezuelaVietnamWest IndiesWestern AfricaWestern AsiaWestern EuropeZaireZimbabwe
Income
Income (Families)
Income (Households)
Poverty
Poverty (Families)
Unemployment
Employment Occupations
Employment Industries
Employer Class
Commute Time
Commute Means
School Enrollment
Education by Degree Field
Occupancy
Finances
Physical Characteristics
Colorado Springs
Compare Zip Codes
Comparison Subject

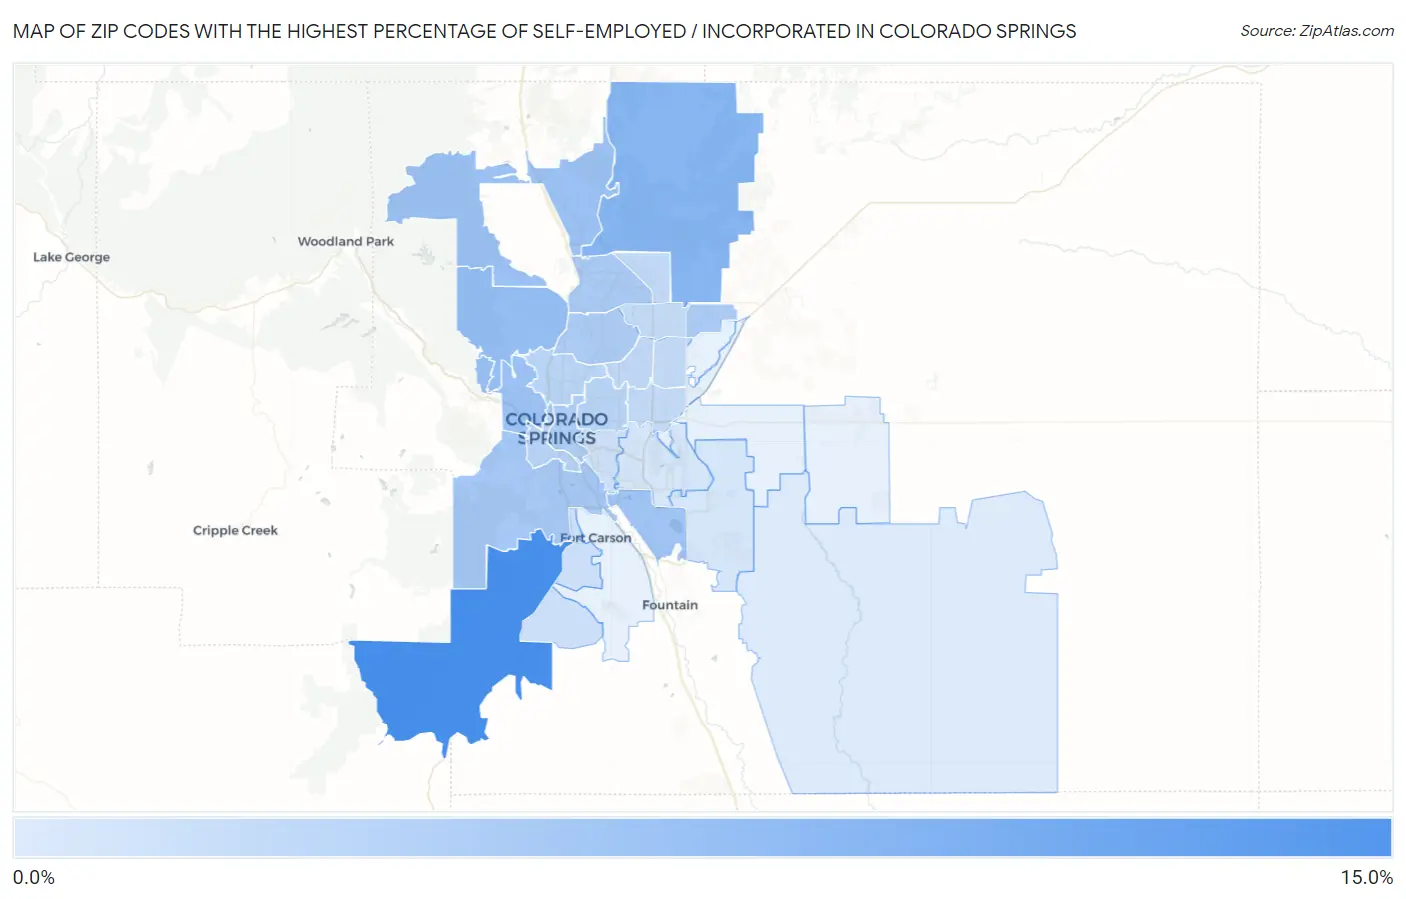
Map of Zip Codes with the Highest Percentage of Self-Employed / Incorporated in Colorado Springs

0.0%
15.0%
Zip Codes with the Highest Percentage of Self-Employed / Incorporated in Colorado Springs Map

Zip Codes with the Highest Percentage of Self-Employed / Incorporated in Colorado Springs, CO

Zip Code % Self-Employed / Incorporated vs State vs National
1.8092614.9%5.1%(+9.81)#333.8%(+11.1)#978
2.809088.6%5.1%(+3.50)#1003.8%(+4.76)#3,165
3.809197.1%5.1%(+2.06)#1393.8%(+3.32)#4,592
4.809046.7%5.1%(+1.59)#1623.8%(+2.85)#5,235
5.809216.7%5.1%(+1.57)#1633.8%(+2.83)#5,269
6.809116.2%5.1%(+1.11)#1813.8%(+2.37)#5,989
7.809065.7%5.1%(+0.603)#2043.8%(+1.86)#6,929
8.809275.3%5.1%(+0.238)#2303.8%(+1.50)#7,783
9.809205.3%5.1%(+0.187)#2333.8%(+1.45)#7,902
10.809185.2%5.1%(+0.079)#2393.8%(+1.34)#8,177
11.809034.9%5.1%(-0.177)#2573.8%(+1.08)#8,873
12.809054.0%5.1%(-1.06)#3073.8%(+0.205)#11,826
13.809073.8%5.1%(-1.23)#3153.8%(+0.028)#12,568
14.809093.7%5.1%(-1.39)#3253.8%(-0.126)#13,229
15.809173.3%5.1%(-1.83)#3483.8%(-0.566)#15,167
16.809243.1%5.1%(-1.99)#3573.8%(-0.728)#15,941
17.809223.0%5.1%(-2.12)#3653.8%(-0.863)#16,634
18.809152.9%5.1%(-2.15)#3663.8%(-0.892)#16,775
19.809232.7%5.1%(-2.42)#3733.8%(-1.16)#18,133
20.809022.1%5.1%(-2.94)#3943.8%(-1.68)#20,691
21.809101.8%5.1%(-3.26)#4073.8%(-2.00)#22,206
22.809251.3%5.1%(-3.74)#4153.8%(-2.47)#24,083
23.809161.3%5.1%(-3.74)#4163.8%(-2.47)#24,086
24.809280.68%5.1%(-4.40)#4333.8%(-3.14)#26,123

Common Questions

What are the Top 10 Zip Codes with the Highest Percentage of Self-Employed / Incorporated in Colorado Springs, CO?
Top 10 Zip Codes with the Highest Percentage of Self-Employed / Incorporated in Colorado Springs, CO are:
#1
14.9%
#2
8.6%
#3
7.1%
#4
6.7%
#5
6.7%
#6
6.2%
#7
5.7%
#8
5.3%
#9
5.3%
#10
5.2%
What zip code has the Highest Percentage of Self-Employed / Incorporated in Colorado Springs, CO?
80926 has the Highest Percentage of Self-Employed / Incorporated in Colorado Springs, CO with 14.9%.
What is the Percentage of Self-Employed / Incorporated in Colorado Springs, CO?
Percentage of Self-Employed / Incorporated in Colorado Springs is 4.2%.
What is the Percentage of Self-Employed / Incorporated in Colorado?
Percentage of Self-Employed / Incorporated in Colorado is 5.1%.
What is the Percentage of Self-Employed / Incorporated in the United States?
Percentage of Self-Employed / Incorporated in the United States is 3.8%.