Zip Codes with the Highest Percentage of Population Employed in Security & Protection in Rhode Island

RELATED REPORTS & OPTIONS

Security & Protection
Population
Families and Households
Female Fertility
Female Fertility (Unmarried)
Race (Community Size)
Race (Percentage)
Ancestry (Community Size)
AfghanAfricanAlaska NativeAlaskan AthabascanAlbanianAleutAlsatianAmericanApacheArabArapahoArgentineanArmenianAssyrian / Chaldean / SyriacAustralianAustrianBahamianBangladeshiBarbadianBasqueBelgianBelizeanBermudanBhutaneseBlackfeetBolivianBrazilianBritishBritish West IndianBulgarianBurmeseCajunCambodianCanadianCape VerdeanCarpatho RusynCelticCentral AmericanCentral American IndianCherokeeCheyenneChickasawChileanChineseChippewaChoctawColombianColvilleComancheCosta RicanCreeCreekCroatianCrowCubanCypriotCzechCzechoslovakianDanishDelawareDominicanDutchDutch West IndianEastern EuropeanEcuadorianEgyptianEnglishEstonianEthiopianEuropeanFijianFilipinoFinnishFrenchFrench American IndianFrench CanadianGermanGerman RussianGhanaianGreekGuamanian / ChamorroGuatemalanGuyaneseHaitianHmongHonduranHopiHoumaHungarianIcelanderIndian (Asian)IndonesianInupiatIranianIraqiIrishIroquoisIsraeliItalianJamaicanJapaneseJordanianKenyanKiowaKoreanLaotianLatvianLebaneseLiberianLithuanianLumbeeLuxembourgerMacedonianMalaysianMalteseMarshalleseMenomineeMexicanMexican American IndianMongolianMoroccanNative HawaiianNavajoNepaleseNew ZealanderNicaraguanNigerianNorthern EuropeanNorwegianOkinawanOsageOttawaPaiutePakistaniPalestinianPanamanianParaguayanPennsylvania GermanPeruvianPimaPolishPortuguesePotawatomiPuebloPuerto RicanPuget Sound SalishRomanianRussianSalvadoranSamoanScandinavianScotch-IrishScottishSeminoleSenegaleseSerbianShoshoneSierra LeoneanSiouxSlavicSlovakSloveneSomaliSouth AfricanSouth AmericanSouth American IndianSoviet UnionSpaniardSpanishSpanish AmericanSpanish American IndianSri LankanSubsaharan AfricanSudaneseSwedishSwissSyrianTaiwaneseThaiTlingit-HaidaTohono O'OdhamTonganTrinidadian and TobagonianTsimshianTurkishU.S. Virgin IslanderUgandanUkrainianUruguayanUteVenezuelanVietnameseWelshWest IndianYakamaYaquiYugoslavianYumanYup'ikZimbabwean
Ancestry (Percentage)
AfghanAfricanAlaska NativeAlaskan AthabascanAlbanianAleutAlsatianAmericanApacheArabArapahoArgentineanArmenianAssyrian / Chaldean / SyriacAustralianAustrianBahamianBangladeshiBarbadianBasqueBelgianBelizeanBermudanBhutaneseBlackfeetBolivianBrazilianBritishBritish West IndianBulgarianBurmeseCajunCambodianCanadianCape VerdeanCarpatho RusynCelticCentral AmericanCentral American IndianCherokeeCheyenneChickasawChileanChineseChippewaChoctawColombianColvilleComancheCosta RicanCreeCreekCroatianCrowCubanCypriotCzechCzechoslovakianDanishDelawareDominicanDutchDutch West IndianEastern EuropeanEcuadorianEgyptianEnglishEstonianEthiopianEuropeanFijianFilipinoFinnishFrenchFrench American IndianFrench CanadianGermanGerman RussianGhanaianGreekGuamanian / ChamorroGuatemalanGuyaneseHaitianHmongHonduranHopiHoumaHungarianIcelanderIndian (Asian)IndonesianInupiatIranianIraqiIrishIroquoisIsraeliItalianJamaicanJapaneseJordanianKenyanKiowaKoreanLaotianLatvianLebaneseLiberianLithuanianLumbeeLuxembourgerMacedonianMalaysianMalteseMarshalleseMenomineeMexicanMexican American IndianMongolianMoroccanNative HawaiianNavajoNepaleseNew ZealanderNicaraguanNigerianNorthern EuropeanNorwegianOkinawanOsageOttawaPaiutePakistaniPalestinianPanamanianParaguayanPennsylvania GermanPeruvianPimaPolishPortuguesePotawatomiPuebloPuerto RicanPuget Sound SalishRomanianRussianSalvadoranSamoanScandinavianScotch-IrishScottishSeminoleSenegaleseSerbianShoshoneSierra LeoneanSiouxSlavicSlovakSloveneSomaliSouth AfricanSouth AmericanSouth American IndianSoviet UnionSpaniardSpanishSpanish AmericanSpanish American IndianSri LankanSubsaharan AfricanSudaneseSwedishSwissSyrianTaiwaneseThaiTlingit-HaidaTohono O'OdhamTonganTrinidadian and TobagonianTsimshianTurkishU.S. Virgin IslanderUgandanUkrainianUruguayanUteVenezuelanVietnameseWelshWest IndianYakamaYaquiYugoslavianYumanYup'ikZimbabwean
Immigrant Origin (Total)
AfghanistanAfricaAlbaniaArgentinaArmeniaAsiaAustraliaAustriaAzoresBahamasBangladeshBarbadosBelarusBelgiumBelizeBoliviaBosnia and HerzegovinaBrazilBulgariaBurma / MyanmarCabo VerdeCambodiaCameroonCanadaCaribbeanCentral AmericaChileChinaColombiaCongoCosta RicaCroatiaCubaCzechoslovakiaDenmarkDominicaDominican RepublicEastern AfricaEastern AsiaEastern EuropeEcuadorEgyptEl SalvadorEnglandEritreaEthiopiaEuropeFijiFranceGermanyGhanaGreeceGrenadaGuatemalaGuyanaHaitiHondurasHong KongHungaryIndiaIndonesiaIranIraqIrelandIsraelItalyJamaicaJapanJordanKazakhstanKenyaKoreaKuwaitLaosLatin AmericaLatviaLebanonLiberiaLithuaniaMalaysiaMexicoMicronesiaMiddle AfricaMoldovaMoroccoNepalNetherlandsNicaraguaNigeriaNorth MacedoniaNorthern AfricaNorthern EuropeNorwayOceaniaPakistanPanamaPeruPhilippinesPolandPortugalRomaniaRussiaSaudi ArabiaScotlandSenegalSerbiaSierra LeoneSingaporeSomaliaSouth AfricaSouth AmericaSouth Central AsiaSouth Eastern AsiaSouthern EuropeSpainSri LankaSt. Vincent and the GrenadinesSudanSwedenSwitzerlandSyriaTaiwanThailandTrinidad and TobagoTurkeyUgandaUkraineUruguayUzbekistanVenezuelaVietnamWest IndiesWestern AfricaWestern AsiaWestern EuropeYemenZaireZimbabwe
Immigrant Origin (Percentage)
AfghanistanAfricaAlbaniaArgentinaArmeniaAsiaAustraliaAustriaAzoresBahamasBangladeshBarbadosBelarusBelgiumBelizeBoliviaBosnia and HerzegovinaBrazilBulgariaBurma / MyanmarCabo VerdeCambodiaCameroonCanadaCaribbeanCentral AmericaChileChinaColombiaCongoCosta RicaCroatiaCubaCzechoslovakiaDenmarkDominicaDominican RepublicEastern AfricaEastern AsiaEastern EuropeEcuadorEgyptEl SalvadorEnglandEritreaEthiopiaEuropeFijiFranceGermanyGhanaGreeceGrenadaGuatemalaGuyanaHaitiHondurasHong KongHungaryIndiaIndonesiaIranIraqIrelandIsraelItalyJamaicaJapanJordanKazakhstanKenyaKoreaKuwaitLaosLatin AmericaLatviaLebanonLiberiaLithuaniaMalaysiaMexicoMicronesiaMiddle AfricaMoldovaMoroccoNepalNetherlandsNicaraguaNigeriaNorth MacedoniaNorthern AfricaNorthern EuropeNorwayOceaniaPakistanPanamaPeruPhilippinesPolandPortugalRomaniaRussiaSaudi ArabiaScotlandSenegalSerbiaSierra LeoneSingaporeSomaliaSouth AfricaSouth AmericaSouth Central AsiaSouth Eastern AsiaSouthern EuropeSpainSri LankaSt. Vincent and the GrenadinesSudanSwedenSwitzerlandSyriaTaiwanThailandTrinidad and TobagoTurkeyUgandaUkraineUruguayUzbekistanVenezuelaVietnamWest IndiesWestern AfricaWestern AsiaWestern EuropeYemenZaireZimbabwe
Income
Income (Families)
Income (Households)
Poverty
Poverty (Families)
Unemployment
Employment Occupations
Employment Industries
Employer Class
Commute Time
Commute Means
School Enrollment
Education by Degree Field
Occupancy
Finances
Physical Characteristics
Rhode Island
Compare Zip Codes
Comparison Subject

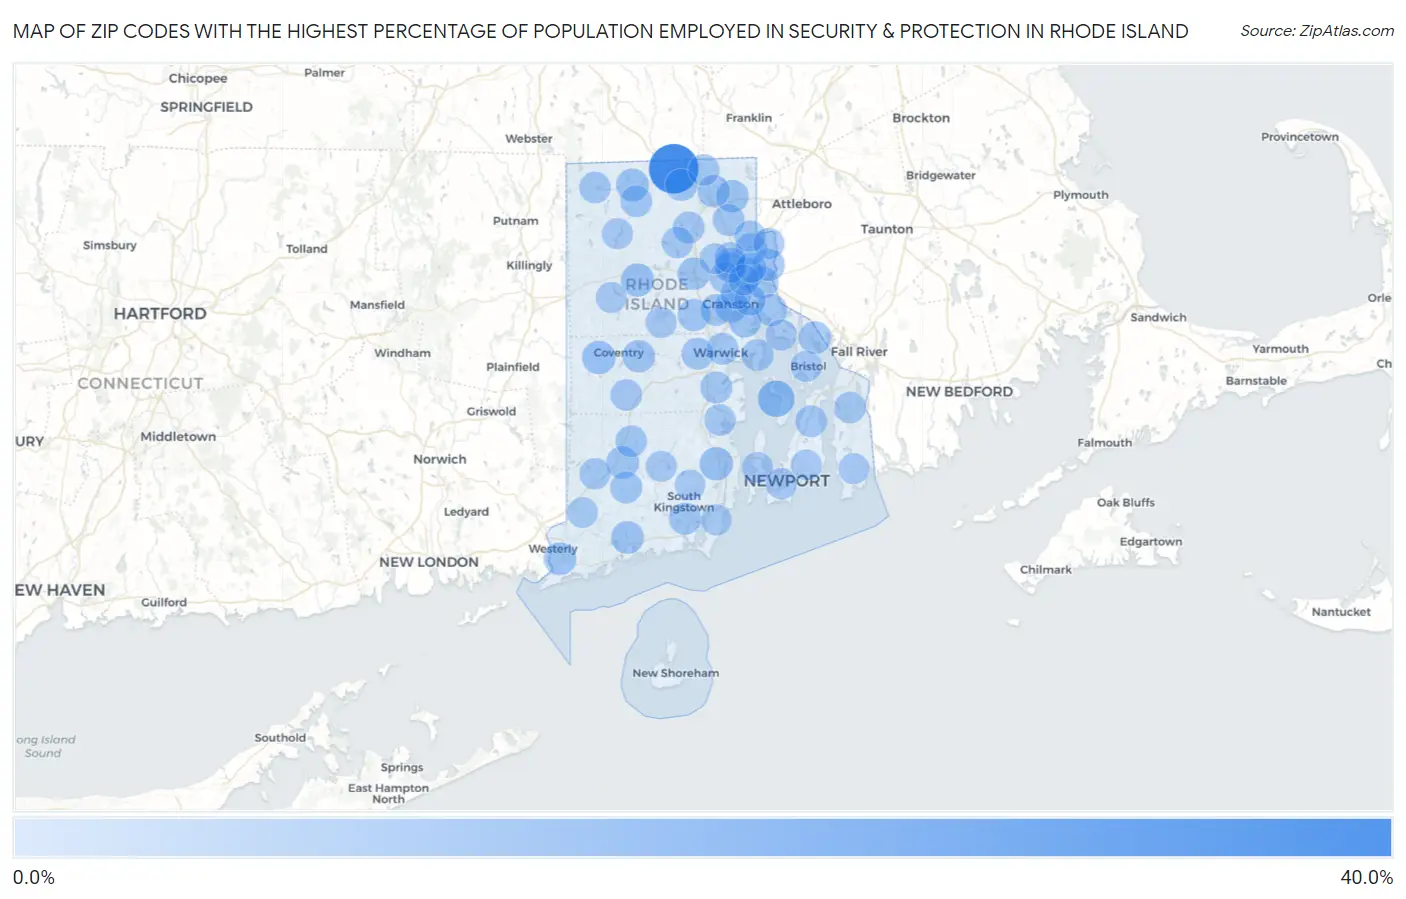
Map of Zip Codes with the Highest Percentage of Population Employed in Security & Protection in Rhode Island

0.0%
40.0%
Zip Codes with the Highest Percentage of Population Employed in Security & Protection in Rhode Island Map

Zip Codes with the Highest Percentage of Population Employed in Security & Protection in Rhode Island

Zip Code % Employed vs State vs National
1.0282435.7%2.4%(+33.3)#12.1%(+33.6)#69
2.0287211.1%2.4%(+8.68)#22.1%(+8.96)#637
3.028275.5%2.4%(+3.11)#32.1%(+3.40)#2,420
4.028745.5%2.4%(+3.09)#42.1%(+3.37)#2,435
5.028575.2%2.4%(+2.72)#52.1%(+3.01)#2,758
6.028304.4%2.4%(+1.99)#62.1%(+2.28)#3,740
7.028134.3%2.4%(+1.90)#72.1%(+2.18)#3,889
8.028984.2%2.4%(+1.78)#82.1%(+2.06)#4,107
9.029104.2%2.4%(+1.77)#92.1%(+2.05)#4,121
10.028914.2%2.4%(+1.75)#102.1%(+2.04)#4,157
11.028854.0%2.4%(+1.59)#112.1%(+1.87)#4,450
12.029193.9%2.4%(+1.45)#122.1%(+1.74)#4,714
13.028163.9%2.4%(+1.45)#132.1%(+1.74)#4,718
14.028883.8%2.4%(+1.39)#142.1%(+1.68)#4,851
15.028643.8%2.4%(+1.36)#152.1%(+1.64)#4,928
16.029143.5%2.4%(+1.11)#162.1%(+1.40)#5,553
17.029213.5%2.4%(+1.05)#172.1%(+1.34)#5,703
18.028963.5%2.4%(+1.02)#182.1%(+1.30)#5,798
19.028383.2%2.4%(+0.790)#192.1%(+1.08)#6,474
20.029163.2%2.4%(+0.761)#202.1%(+1.05)#6,554
21.028793.1%2.4%(+0.713)#212.1%(+1.00)#6,704
22.029122.9%2.4%(+0.500)#222.1%(+0.787)#7,495
23.028182.9%2.4%(+0.499)#232.1%(+0.786)#7,497
24.028122.9%2.4%(+0.475)#242.1%(+0.762)#7,598
25.028932.9%2.4%(+0.453)#252.1%(+0.740)#7,696
26.028652.9%2.4%(+0.439)#262.1%(+0.726)#7,761
27.028862.8%2.4%(+0.408)#272.1%(+0.695)#7,897
28.028892.8%2.4%(+0.381)#282.1%(+0.668)#8,044
29.029152.8%2.4%(+0.353)#292.1%(+0.640)#8,156
30.029172.8%2.4%(+0.338)#302.1%(+0.625)#8,228
31.028712.7%2.4%(+0.260)#312.1%(+0.548)#8,549
32.028602.7%2.4%(+0.256)#322.1%(+0.543)#8,576
33.028392.6%2.4%(+0.164)#332.1%(+0.452)#9,002
34.029202.6%2.4%(+0.143)#342.1%(+0.430)#9,108
35.029182.4%2.4%(-0.021)#352.1%(+0.267)#9,979
36.028592.4%2.4%(-0.055)#362.1%(+0.233)#10,151
37.028222.4%2.4%(-0.072)#372.1%(+0.215)#10,261
38.028172.2%2.4%(-0.224)#382.1%(+0.063)#11,187
39.028782.2%2.4%(-0.268)#392.1%(+0.019)#11,459
40.028282.1%2.4%(-0.384)#402.1%(-0.097)#12,239
41.028522.0%2.4%(-0.436)#412.1%(-0.149)#12,563
42.028951.9%2.4%(-0.529)#422.1%(-0.242)#13,176
43.028631.9%2.4%(-0.573)#432.1%(-0.286)#13,479
44.028611.8%2.4%(-0.611)#442.1%(-0.324)#13,752
45.029051.8%2.4%(-0.662)#452.1%(-0.375)#14,137
46.028321.7%2.4%(-0.710)#462.1%(-0.423)#14,488
47.028091.5%2.4%(-0.897)#472.1%(-0.610)#15,888
48.028061.5%2.4%(-0.940)#482.1%(-0.653)#16,243
49.029071.5%2.4%(-0.945)#492.1%(-0.658)#16,286
50.028401.4%2.4%(-1.03)#502.1%(-0.740)#16,891
51.028141.3%2.4%(-1.10)#512.1%(-0.814)#17,457
52.029091.3%2.4%(-1.17)#522.1%(-0.887)#18,050
53.028921.2%2.4%(-1.19)#532.1%(-0.906)#18,186
54.028311.2%2.4%(-1.20)#542.1%(-0.910)#18,210
55.028251.2%2.4%(-1.23)#552.1%(-0.940)#18,444
56.029081.1%2.4%(-1.36)#562.1%(-1.07)#19,437
57.028351.1%2.4%(-1.38)#572.1%(-1.09)#19,606
58.029111.0%2.4%(-1.41)#582.1%(-1.12)#19,853
59.029041.0%2.4%(-1.42)#592.1%(-1.13)#19,930
60.028420.91%2.4%(-1.53)#602.1%(-1.24)#20,740
61.028370.90%2.4%(-1.54)#612.1%(-1.25)#20,805
62.028820.85%2.4%(-1.59)#622.1%(-1.30)#21,112
63.028040.82%2.4%(-1.62)#632.1%(-1.33)#21,300
64.029030.77%2.4%(-1.67)#642.1%(-1.38)#21,612
65.028810.57%2.4%(-1.86)#652.1%(-1.58)#22,828
66.029060.53%2.4%(-1.91)#662.1%(-1.62)#23,087

Common Questions

What are the Top 10 Zip Codes with the Highest Percentage of Population Employed in Security & Protection in Rhode Island?
Top 10 Zip Codes with the Highest Percentage of Population Employed in Security & Protection in Rhode Island are:
#1
35.7%
#2
11.1%
#3
5.5%
#4
5.5%
#5
5.2%
#6
4.4%
#7
4.3%
#8
4.2%
#9
4.2%
#10
4.2%
What zip code has the Highest Percentage of Population Employed in Security & Protection in Rhode Island?
02824 has the Highest Percentage of Population Employed in Security & Protection in Rhode Island with 35.7%.
What is the Percentage of Population Employed in Security & Protection in the State of Rhode Island?
Percentage of Population Employed in Security & Protection in Rhode Island is 2.4%.
What is the Percentage of Population Employed in Security & Protection in the United States?
Percentage of Population Employed in Security & Protection in the United States is 2.1%.