Zip Codes with the Highest Percentage of Population Employed in Sales & Related in Los Angeles, CA
RELATED REPORTS & OPTIONS
Sales & Related
Los Angeles
Compare Zip Codes
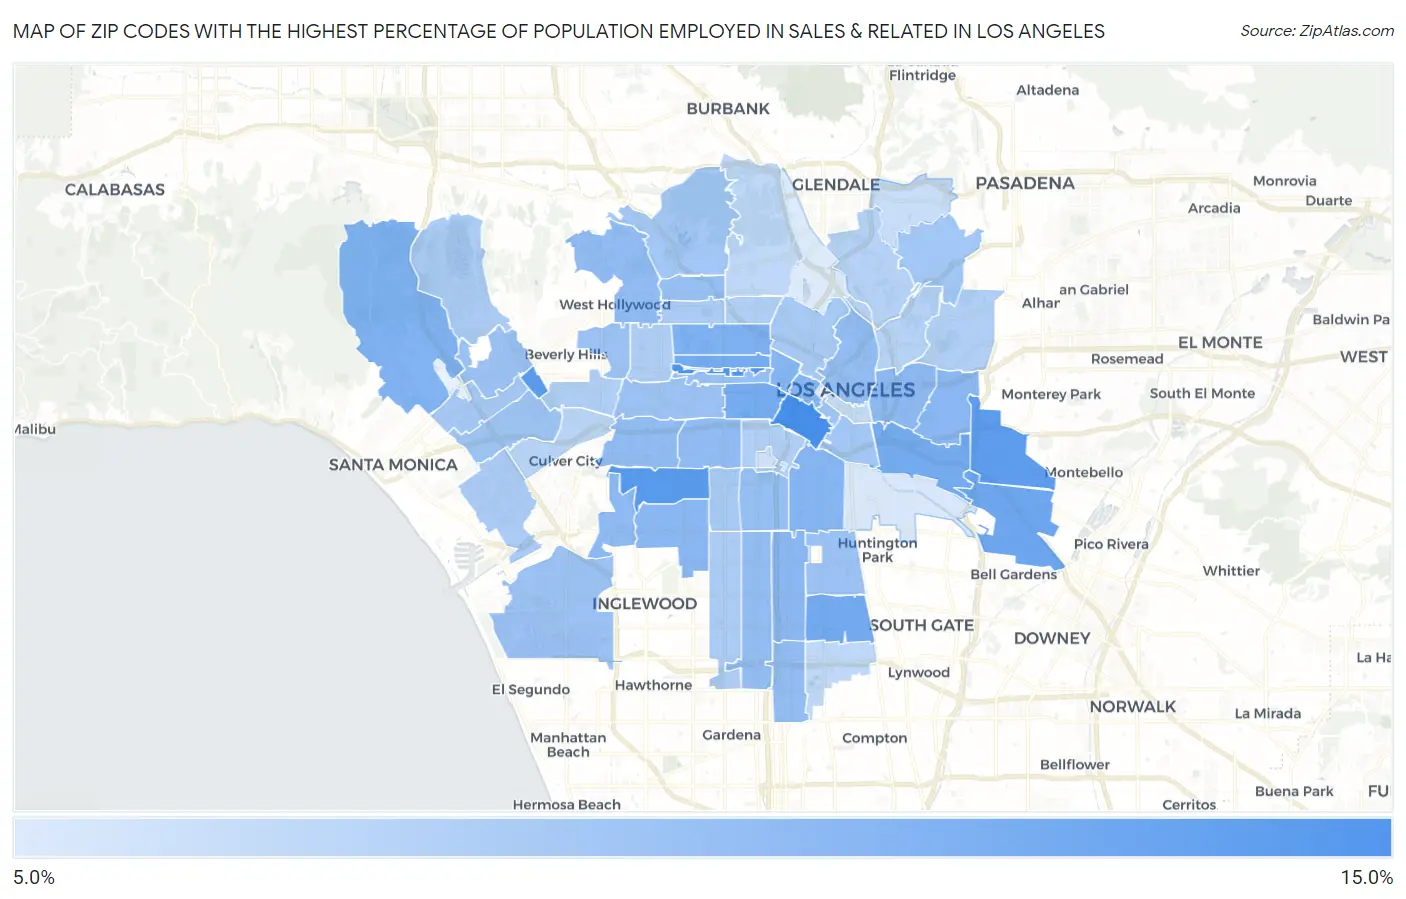
Map of Zip Codes with the Highest Percentage of Population Employed in Sales & Related in Los Angeles
5.1%
14.2%
Zip Codes with the Highest Percentage of Population Employed in Sales & Related in Los Angeles, CA
| Zip Code | % Employed | vs State | vs National | |
| 1. | 90015 | 14.2% | 9.4%(+4.79)#144 | 9.6%(+4.65)#3,303 |
| 2. | 90010 | 13.7% | 9.4%(+4.22)#171 | 9.6%(+4.07)#3,785 |
| 3. | 90008 | 13.2% | 9.4%(+3.72)#194 | 9.6%(+3.57)#4,311 |
| 4. | 90067 | 13.0% | 9.4%(+3.55)#198 | 9.6%(+3.40)#4,489 |
| 5. | 90022 | 12.8% | 9.4%(+3.30)#208 | 9.6%(+3.16)#4,822 |
| 6. | 90040 | 11.8% | 9.4%(+2.37)#294 | 9.6%(+2.22)#6,379 |
| 7. | 90002 | 11.5% | 9.4%(+2.09)#326 | 9.6%(+1.95)#6,923 |
| 8. | 90020 | 11.4% | 9.4%(+1.98)#338 | 9.6%(+1.83)#7,197 |
| 9. | 90023 | 11.3% | 9.4%(+1.90)#350 | 9.6%(+1.75)#7,378 |
| 10. | 90006 | 11.3% | 9.4%(+1.87)#357 | 9.6%(+1.72)#7,442 |
| 11. | 90004 | 10.8% | 9.4%(+1.35)#451 | 9.6%(+1.20)#8,716 |
| 12. | 90049 | 10.7% | 9.4%(+1.20)#483 | 9.6%(+1.06)#9,125 |
| 13. | 90057 | 10.4% | 9.4%(+0.986)#530 | 9.6%(+0.838)#9,713 |
| 14. | 90017 | 10.4% | 9.4%(+0.965)#533 | 9.6%(+0.818)#9,762 |
| 15. | 90011 | 10.4% | 9.4%(+0.960)#537 | 9.6%(+0.812)#9,786 |
| 16. | 90043 | 10.2% | 9.4%(+0.705)#597 | 9.6%(+0.557)#10,568 |
| 17. | 90003 | 10.1% | 9.4%(+0.680)#603 | 9.6%(+0.532)#10,634 |
| 18. | 90063 | 10.0% | 9.4%(+0.599)#617 | 9.6%(+0.452)#10,857 |
| 19. | 90033 | 9.9% | 9.4%(+0.440)#642 | 9.6%(+0.293)#11,364 |
| 20. | 90056 | 9.7% | 9.4%(+0.286)#680 | 9.6%(+0.138)#11,914 |
| 21. | 90046 | 9.7% | 9.4%(+0.219)#693 | 9.6%(+0.072)#12,151 |
| 22. | 90016 | 9.7% | 9.4%(+0.216)#696 | 9.6%(+0.068)#12,173 |
| 23. | 90018 | 9.7% | 9.4%(+0.215)#697 | 9.6%(+0.067)#12,176 |
| 24. | 90061 | 9.5% | 9.4%(+0.081)#742 | 9.6%(-0.066)#12,654 |
| 25. | 90044 | 9.5% | 9.4%(+0.076)#745 | 9.6%(-0.072)#12,677 |
| 26. | 90012 | 9.5% | 9.4%(+0.026)#761 | 9.6%(-0.122)#12,830 |
| 27. | 90037 | 9.3% | 9.4%(-0.137)#805 | 9.6%(-0.284)#13,392 |
| 28. | 90028 | 9.2% | 9.4%(-0.229)#824 | 9.6%(-0.376)#13,711 |
| 29. | 90005 | 9.2% | 9.4%(-0.264)#833 | 9.6%(-0.412)#13,854 |
| 30. | 90019 | 9.1% | 9.4%(-0.312)#848 | 9.6%(-0.459)#14,012 |
| 31. | 90045 | 9.1% | 9.4%(-0.317)#853 | 9.6%(-0.465)#14,037 |
| 32. | 90048 | 9.1% | 9.4%(-0.340)#860 | 9.6%(-0.488)#14,120 |
| 33. | 90024 | 8.9% | 9.4%(-0.509)#902 | 9.6%(-0.656)#14,747 |
| 34. | 90001 | 8.9% | 9.4%(-0.538)#912 | 9.6%(-0.686)#14,865 |
| 35. | 90014 | 8.9% | 9.4%(-0.587)#928 | 9.6%(-0.735)#15,033 |
| 36. | 90064 | 8.8% | 9.4%(-0.687)#948 | 9.6%(-0.835)#15,402 |
| 37. | 90042 | 8.6% | 9.4%(-0.869)#992 | 9.6%(-1.02)#16,057 |
| 38. | 90068 | 8.6% | 9.4%(-0.896)#996 | 9.6%(-1.04)#16,160 |
| 39. | 90021 | 8.5% | 9.4%(-0.954)#1,010 | 9.6%(-1.10)#16,373 |
| 40. | 90025 | 8.4% | 9.4%(-1.02)#1,035 | 9.6%(-1.17)#16,626 |
| 41. | 90026 | 8.3% | 9.4%(-1.14)#1,057 | 9.6%(-1.28)#17,028 |
| 42. | 90062 | 8.2% | 9.4%(-1.23)#1,081 | 9.6%(-1.38)#17,356 |
| 43. | 90066 | 8.2% | 9.4%(-1.25)#1,084 | 9.6%(-1.40)#17,416 |
| 44. | 90038 | 8.1% | 9.4%(-1.32)#1,096 | 9.6%(-1.47)#17,633 |
| 45. | 90047 | 8.0% | 9.4%(-1.44)#1,113 | 9.6%(-1.59)#18,024 |
| 46. | 90077 | 8.0% | 9.4%(-1.48)#1,123 | 9.6%(-1.63)#18,144 |
| 47. | 90036 | 7.8% | 9.4%(-1.62)#1,145 | 9.6%(-1.77)#18,604 |
| 48. | 90007 | 7.8% | 9.4%(-1.67)#1,157 | 9.6%(-1.82)#18,760 |
| 49. | 90032 | 7.7% | 9.4%(-1.70)#1,164 | 9.6%(-1.85)#18,844 |
| 50. | 90029 | 7.7% | 9.4%(-1.71)#1,165 | 9.6%(-1.86)#18,879 |
| 51. | 90035 | 7.7% | 9.4%(-1.74)#1,170 | 9.6%(-1.88)#18,949 |
| 52. | 90031 | 7.4% | 9.4%(-2.01)#1,211 | 9.6%(-2.16)#19,877 |
| 53. | 90065 | 7.4% | 9.4%(-2.06)#1,217 | 9.6%(-2.21)#20,029 |
| 54. | 90034 | 7.2% | 9.4%(-2.25)#1,247 | 9.6%(-2.40)#20,659 |
| 55. | 90059 | 6.9% | 9.4%(-2.54)#1,279 | 9.6%(-2.69)#21,466 |
| 56. | 90027 | 6.9% | 9.4%(-2.56)#1,285 | 9.6%(-2.71)#21,519 |
| 57. | 90013 | 6.7% | 9.4%(-2.80)#1,309 | 9.6%(-2.94)#22,081 |
| 58. | 90041 | 6.3% | 9.4%(-3.14)#1,342 | 9.6%(-3.29)#22,931 |
| 59. | 90089 | 6.0% | 9.4%(-3.45)#1,381 | 9.6%(-3.60)#23,652 |
| 60. | 90058 | 5.4% | 9.4%(-4.06)#1,434 | 9.6%(-4.21)#24,889 |
| 61. | 90039 | 5.1% | 9.4%(-4.32)#1,452 | 9.6%(-4.47)#25,344 |
1
Common Questions
What are the Top 10 Zip Codes with the Highest Percentage of Population Employed in Sales & Related in Los Angeles, CA?
Top 10 Zip Codes with the Highest Percentage of Population Employed in Sales & Related in Los Angeles, CA are:
What zip code has the Highest Percentage of Population Employed in Sales & Related in Los Angeles, CA?
90015 has the Highest Percentage of Population Employed in Sales & Related in Los Angeles, CA with 14.2%.
What is the Percentage of Population Employed in Sales & Related in Los Angeles, CA?
Percentage of Population Employed in Sales & Related in Los Angeles is 9.4%.
What is the Percentage of Population Employed in Sales & Related in California?
Percentage of Population Employed in Sales & Related in California is 9.4%.
What is the Percentage of Population Employed in Sales & Related in the United States?
Percentage of Population Employed in Sales & Related in the United States is 9.6%.