Zip Codes with the Highest Percentage of Population Employed in Security & Protection in Oklahoma
RELATED REPORTS & OPTIONS
Security & Protection
Oklahoma
Compare Zip Codes
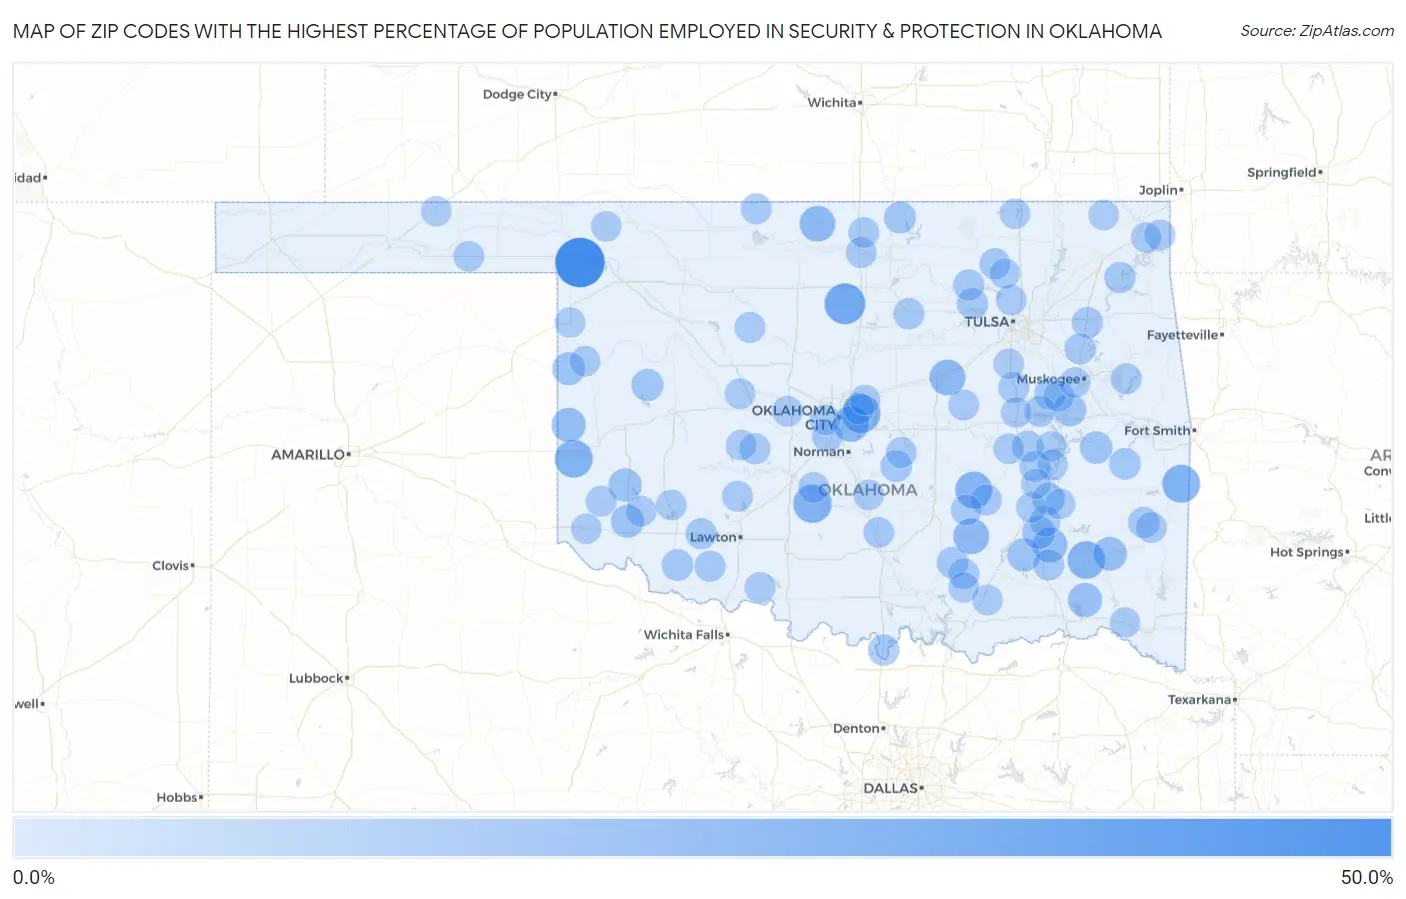
Map of Zip Codes with the Highest Percentage of Population Employed in Security & Protection in Oklahoma
0.0%
50.0%
Zip Codes with the Highest Percentage of Population Employed in Security & Protection in Oklahoma
| Zip Code | % Employed | vs State | vs National | |
| 1. | 73851 | 41.2% | 2.0%(+39.2)#1 | 2.1%(+39.0)#54 |
| 2. | 73757 | 23.8% | 2.0%(+21.8)#2 | 2.1%(+21.7)#142 |
| 3. | 73066 | 19.2% | 2.0%(+17.2)#3 | 2.1%(+17.1)#217 |
| 4. | 73011 | 19.1% | 2.0%(+17.1)#4 | 2.1%(+16.9)#224 |
| 5. | 73645 | 18.4% | 2.0%(+16.4)#5 | 2.1%(+16.2)#238 |
| 6. | 74947 | 18.2% | 2.0%(+16.2)#6 | 2.1%(+16.0)#244 |
| 7. | 74567 | 17.6% | 2.0%(+15.6)#7 | 2.1%(+15.5)#264 |
| 8. | 74827 | 16.5% | 2.0%(+14.5)#8 | 2.1%(+14.3)#297 |
| 9. | 73145 | 14.8% | 2.0%(+12.8)#9 | 2.1%(+12.6)#371 |
| 10. | 74046 | 14.3% | 2.0%(+12.3)#10 | 2.1%(+12.1)#400 |
| 11. | 74534 | 14.3% | 2.0%(+12.3)#11 | 2.1%(+12.1)#401 |
| 12. | 73759 | 14.0% | 2.0%(+12.0)#12 | 2.1%(+11.9)#415 |
| 13. | 74540 | 12.2% | 2.0%(+10.2)#13 | 2.1%(+10.0)#535 |
| 14. | 73666 | 11.2% | 2.0%(+9.19)#14 | 2.1%(+9.05)#627 |
| 15. | 74760 | 10.9% | 2.0%(+8.90)#15 | 2.1%(+8.76)#657 |
| 16. | 74558 | 10.2% | 2.0%(+8.20)#16 | 2.1%(+8.06)#744 |
| 17. | 73547 | 9.3% | 2.0%(+7.32)#17 | 2.1%(+7.18)#858 |
| 18. | 74569 | 9.3% | 2.0%(+7.26)#18 | 2.1%(+7.12)#867 |
| 19. | 73556 | 9.1% | 2.0%(+7.08)#19 | 2.1%(+6.94)#897 |
| 20. | 74560 | 8.8% | 2.0%(+6.80)#20 | 2.1%(+6.66)#950 |
| 21. | 73642 | 8.8% | 2.0%(+6.76)#21 | 2.1%(+6.62)#959 |
| 22. | 74459 | 8.0% | 2.0%(+5.99)#22 | 2.1%(+5.85)#1,172 |
| 23. | 74472 | 7.9% | 2.0%(+5.85)#23 | 2.1%(+5.71)#1,219 |
| 24. | 73625 | 7.2% | 2.0%(+5.21)#24 | 2.1%(+5.07)#1,432 |
| 25. | 74647 | 7.0% | 2.0%(+4.95)#25 | 2.1%(+4.81)#1,552 |
| 26. | 74522 | 6.7% | 2.0%(+4.66)#26 | 2.1%(+4.52)#1,710 |
| 27. | 73542 | 6.3% | 2.0%(+4.25)#27 | 2.1%(+4.11)#1,916 |
| 28. | 74852 | 6.2% | 2.0%(+4.16)#28 | 2.1%(+4.02)#1,972 |
| 29. | 74530 | 6.2% | 2.0%(+4.14)#29 | 2.1%(+4.01)#1,985 |
| 30. | 74944 | 6.1% | 2.0%(+4.10)#30 | 2.1%(+3.96)#2,009 |
| 31. | 74422 | 6.0% | 2.0%(+3.94)#31 | 2.1%(+3.80)#2,111 |
| 32. | 73459 | 5.7% | 2.0%(+3.67)#32 | 2.1%(+3.53)#2,296 |
| 33. | 74054 | 5.6% | 2.0%(+3.64)#33 | 2.1%(+3.50)#2,327 |
| 34. | 74337 | 5.5% | 2.0%(+3.52)#34 | 2.1%(+3.38)#2,431 |
| 35. | 74032 | 5.5% | 2.0%(+3.51)#35 | 2.1%(+3.37)#2,439 |
| 36. | 74035 | 5.5% | 2.0%(+3.49)#36 | 2.1%(+3.36)#2,453 |
| 37. | 74531 | 5.5% | 2.0%(+3.49)#37 | 2.1%(+3.35)#2,460 |
| 38. | 74577 | 5.5% | 2.0%(+3.45)#38 | 2.1%(+3.31)#2,490 |
| 39. | 74350 | 5.4% | 2.0%(+3.42)#39 | 2.1%(+3.28)#2,508 |
| 40. | 73042 | 5.2% | 2.0%(+3.22)#40 | 2.1%(+3.08)#2,690 |
| 41. | 74845 | 5.2% | 2.0%(+3.21)#41 | 2.1%(+3.08)#2,694 |
| 42. | 73528 | 5.2% | 2.0%(+3.18)#42 | 2.1%(+3.04)#2,722 |
| 43. | 74442 | 5.1% | 2.0%(+3.12)#43 | 2.1%(+2.98)#2,780 |
| 44. | 73084 | 5.1% | 2.0%(+3.09)#44 | 2.1%(+2.95)#2,810 |
| 45. | 74447 | 5.1% | 2.0%(+3.09)#45 | 2.1%(+2.95)#2,813 |
| 46. | 74438 | 5.1% | 2.0%(+3.06)#46 | 2.1%(+2.92)#2,843 |
| 47. | 73552 | 5.1% | 2.0%(+3.04)#47 | 2.1%(+2.91)#2,858 |
| 48. | 74002 | 5.1% | 2.0%(+3.04)#48 | 2.1%(+2.90)#2,861 |
| 49. | 74557 | 5.1% | 2.0%(+3.04)#49 | 2.1%(+2.90)#2,866 |
| 50. | 74467 | 4.9% | 2.0%(+2.94)#50 | 2.1%(+2.80)#2,988 |
| 51. | 73719 | 4.9% | 2.0%(+2.91)#51 | 2.1%(+2.77)#3,027 |
| 52. | 73036 | 4.9% | 2.0%(+2.90)#52 | 2.1%(+2.76)#3,033 |
| 53. | 74451 | 4.9% | 2.0%(+2.89)#53 | 2.1%(+2.75)#3,047 |
| 54. | 73173 | 4.9% | 2.0%(+2.89)#54 | 2.1%(+2.75)#3,052 |
| 55. | 74528 | 4.9% | 2.0%(+2.87)#55 | 2.1%(+2.73)#3,071 |
| 56. | 73568 | 4.9% | 2.0%(+2.84)#56 | 2.1%(+2.70)#3,104 |
| 57. | 73461 | 4.8% | 2.0%(+2.82)#57 | 2.1%(+2.68)#3,130 |
| 58. | 74653 | 4.8% | 2.0%(+2.78)#58 | 2.1%(+2.64)#3,184 |
| 59. | 74729 | 4.8% | 2.0%(+2.74)#59 | 2.1%(+2.60)#3,234 |
| 60. | 73006 | 4.7% | 2.0%(+2.73)#60 | 2.1%(+2.59)#3,247 |
| 61. | 74468 | 4.7% | 2.0%(+2.66)#61 | 2.1%(+2.52)#3,336 |
| 62. | 73554 | 4.7% | 2.0%(+2.66)#62 | 2.1%(+2.52)#3,345 |
| 63. | 74825 | 4.6% | 2.0%(+2.58)#63 | 2.1%(+2.44)#3,466 |
| 64. | 73763 | 4.6% | 2.0%(+2.58)#64 | 2.1%(+2.44)#3,470 |
| 65. | 73526 | 4.6% | 2.0%(+2.58)#65 | 2.1%(+2.44)#3,471 |
| 66. | 74631 | 4.6% | 2.0%(+2.57)#66 | 2.1%(+2.43)#3,478 |
| 67. | 73002 | 4.5% | 2.0%(+2.49)#67 | 2.1%(+2.35)#3,616 |
| 68. | 74873 | 4.5% | 2.0%(+2.48)#68 | 2.1%(+2.34)#3,628 |
| 69. | 74949 | 4.5% | 2.0%(+2.47)#69 | 2.1%(+2.33)#3,642 |
| 70. | 74073 | 4.5% | 2.0%(+2.46)#70 | 2.1%(+2.32)#3,661 |
| 71. | 74460 | 4.4% | 2.0%(+2.44)#71 | 2.1%(+2.30)#3,699 |
| 72. | 74833 | 4.4% | 2.0%(+2.42)#72 | 2.1%(+2.28)#3,737 |
| 73. | 73564 | 4.4% | 2.0%(+2.40)#73 | 2.1%(+2.26)#3,755 |
| 74. | 73931 | 4.4% | 2.0%(+2.37)#74 | 2.1%(+2.23)#3,804 |
| 75. | 74430 | 4.4% | 2.0%(+2.37)#75 | 2.1%(+2.23)#3,811 |
| 76. | 73095 | 4.4% | 2.0%(+2.34)#76 | 2.1%(+2.20)#3,856 |
| 77. | 73098 | 4.3% | 2.0%(+2.34)#77 | 2.1%(+2.20)#3,858 |
| 78. | 74839 | 4.3% | 2.0%(+2.34)#78 | 2.1%(+2.20)#3,862 |
| 79. | 73638 | 4.3% | 2.0%(+2.34)#79 | 2.1%(+2.20)#3,867 |
| 80. | 74370 | 4.3% | 2.0%(+2.27)#80 | 2.1%(+2.13)#3,981 |
| 81. | 74546 | 4.2% | 2.0%(+2.22)#81 | 2.1%(+2.08)#4,080 |
| 82. | 74001 | 4.2% | 2.0%(+2.22)#82 | 2.1%(+2.08)#4,081 |
| 83. | 73128 | 4.2% | 2.0%(+2.21)#83 | 2.1%(+2.07)#4,088 |
| 84. | 73009 | 4.2% | 2.0%(+2.18)#84 | 2.1%(+2.04)#4,133 |
| 85. | 73040 | 4.2% | 2.0%(+2.15)#85 | 2.1%(+2.01)#4,198 |
| 86. | 73432 | 4.1% | 2.0%(+2.13)#86 | 2.1%(+1.99)#4,230 |
| 87. | 74047 | 4.1% | 2.0%(+2.13)#87 | 2.1%(+1.99)#4,237 |
| 88. | 73834 | 4.1% | 2.0%(+2.13)#88 | 2.1%(+1.99)#4,240 |
| 89. | 73544 | 4.1% | 2.0%(+2.11)#89 | 2.1%(+1.98)#4,259 |
| 90. | 74369 | 4.1% | 2.0%(+2.09)#90 | 2.1%(+1.95)#4,303 |
| 91. | 74565 | 4.0% | 2.0%(+2.01)#91 | 2.1%(+1.87)#4,456 |
| 92. | 73049 | 4.0% | 2.0%(+2.00)#92 | 2.1%(+1.86)#4,479 |
| 93. | 74022 | 4.0% | 2.0%(+1.99)#93 | 2.1%(+1.85)#4,504 |
| 94. | 73858 | 4.0% | 2.0%(+1.98)#94 | 2.1%(+1.84)#4,521 |
| 95. | 74432 | 4.0% | 2.0%(+1.98)#95 | 2.1%(+1.84)#4,526 |
| 96. | 74401 | 4.0% | 2.0%(+1.97)#96 | 2.1%(+1.83)#4,538 |
| 97. | 74343 | 4.0% | 2.0%(+1.97)#97 | 2.1%(+1.83)#4,539 |
| 98. | 73951 | 4.0% | 2.0%(+1.96)#98 | 2.1%(+1.82)#4,553 |
| 99. | 74750 | 3.9% | 2.0%(+1.89)#99 | 2.1%(+1.75)#4,697 |
| 100. | 74501 | 3.9% | 2.0%(+1.85)#100 | 2.1%(+1.71)#4,796 |
Common Questions
What are the Top 10 Zip Codes with the Highest Percentage of Population Employed in Security & Protection in Oklahoma?
Top 10 Zip Codes with the Highest Percentage of Population Employed in Security & Protection in Oklahoma are:
What zip code has the Highest Percentage of Population Employed in Security & Protection in Oklahoma?
73851 has the Highest Percentage of Population Employed in Security & Protection in Oklahoma with 41.2%.
What is the Percentage of Population Employed in Security & Protection in the State of Oklahoma?
Percentage of Population Employed in Security & Protection in Oklahoma is 2.0%.
What is the Percentage of Population Employed in Security & Protection in the United States?
Percentage of Population Employed in Security & Protection in the United States is 2.1%.