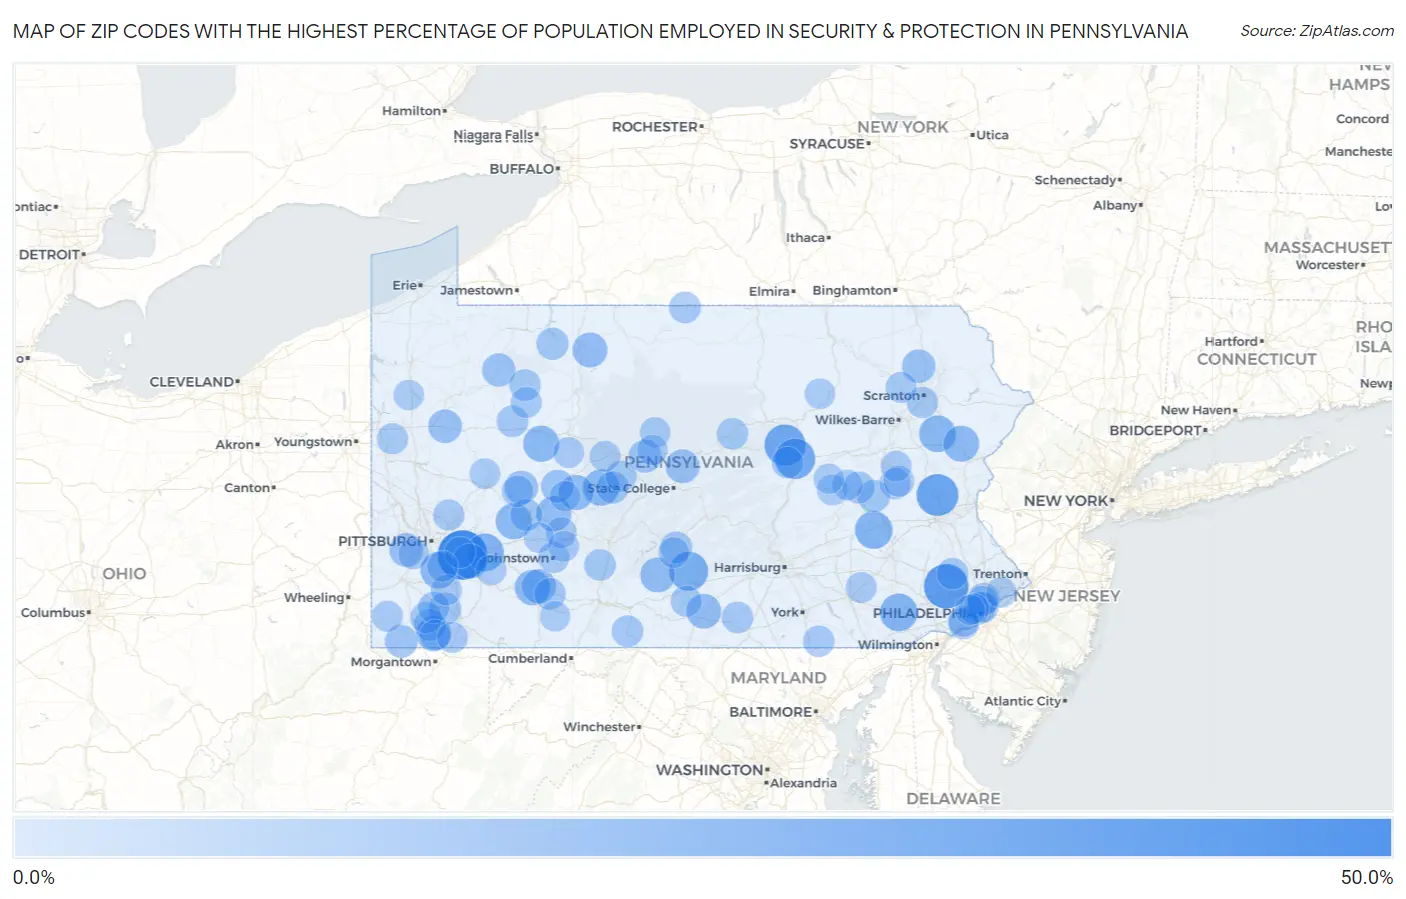
Zip Codes with the Highest Percentage of Population Employed in Security & Protection in Pennsylvania
RELATED REPORTS & OPTIONS
Security & Protection
Pennsylvania
Compare Zip Codes
Map of Zip Codes with the Highest Percentage of Population Employed in Security & Protection in Pennsylvania
0.0%
50.0%
Zip Codes with the Highest Percentage of Population Employed in Security & Protection in Pennsylvania
| Zip Code | % Employed | vs State | vs National | |
| 1. | 15647 | 50.0% | 2.0%(+48.0)#1 | 2.1%(+47.9)#39 |
| 2. | 19456 | 38.3% | 2.0%(+36.3)#2 | 2.1%(+36.2)#59 |
| 3. | 18035 | 32.0% | 2.0%(+30.0)#3 | 2.1%(+29.9)#84 |
| 4. | 17887 | 30.2% | 2.0%(+28.1)#4 | 2.1%(+28.0)#96 |
| 5. | 17865 | 28.6% | 2.0%(+26.6)#5 | 2.1%(+26.4)#105 |
| 6. | 17217 | 25.0% | 2.0%(+23.0)#6 | 2.1%(+22.9)#131 |
| 7. | 15633 | 22.9% | 2.0%(+20.9)#7 | 2.1%(+20.8)#148 |
| 8. | 19554 | 22.2% | 2.0%(+20.2)#8 | 2.1%(+20.1)#162 |
| 9. | 19367 | 22.2% | 2.0%(+20.2)#9 | 2.1%(+20.1)#164 |
| 10. | 18347 | 20.2% | 2.0%(+18.2)#10 | 2.1%(+18.0)#189 |
| 11. | 15038 | 20.0% | 2.0%(+18.0)#11 | 2.1%(+17.9)#193 |
| 12. | 16645 | 19.5% | 2.0%(+17.5)#12 | 2.1%(+17.3)#208 |
| 13. | 15847 | 18.9% | 2.0%(+16.8)#13 | 2.1%(+16.7)#227 |
| 14. | 15713 | 18.8% | 2.0%(+16.7)#14 | 2.1%(+16.6)#231 |
| 15. | 18370 | 18.3% | 2.0%(+16.3)#15 | 2.1%(+16.2)#239 |
| 16. | 15544 | 17.2% | 2.0%(+15.1)#16 | 2.1%(+15.0)#281 |
| 17. | 15745 | 16.5% | 2.0%(+14.5)#17 | 2.1%(+14.4)#296 |
| 18. | 16692 | 16.4% | 2.0%(+14.3)#18 | 2.1%(+14.2)#301 |
| 19. | 15334 | 16.3% | 2.0%(+14.3)#19 | 2.1%(+14.2)#302 |
| 20. | 15611 | 16.2% | 2.0%(+14.2)#20 | 2.1%(+14.1)#306 |
| 21. | 17253 | 16.2% | 2.0%(+14.1)#21 | 2.1%(+14.0)#309 |
| 22. | 16733 | 16.0% | 2.0%(+14.0)#22 | 2.1%(+13.9)#318 |
| 23. | 17254 | 15.7% | 2.0%(+13.7)#23 | 2.1%(+13.6)#329 |
| 24. | 15546 | 14.6% | 2.0%(+12.6)#24 | 2.1%(+12.5)#383 |
| 25. | 16853 | 13.8% | 2.0%(+11.8)#25 | 2.1%(+11.6)#428 |
| 26. | 15082 | 13.7% | 2.0%(+11.7)#26 | 2.1%(+11.5)#436 |
| 27. | 16372 | 13.1% | 2.0%(+11.1)#27 | 2.1%(+11.0)#471 |
| 28. | 18420 | 13.0% | 2.0%(+10.9)#28 | 2.1%(+10.8)#477 |
| 29. | 16211 | 12.9% | 2.0%(+10.9)#29 | 2.1%(+10.8)#481 |
| 30. | 16321 | 12.5% | 2.0%(+10.5)#30 | 2.1%(+10.4)#511 |
| 31. | 16839 | 11.8% | 2.0%(+9.74)#31 | 2.1%(+9.62)#571 |
| 32. | 15741 | 11.8% | 2.0%(+9.74)#32 | 2.1%(+9.62)#573 |
| 33. | 15316 | 11.4% | 2.0%(+9.37)#33 | 2.1%(+9.24)#616 |
| 34. | 17953 | 10.7% | 2.0%(+8.65)#34 | 2.1%(+8.53)#682 |
| 35. | 15413 | 10.7% | 2.0%(+8.65)#35 | 2.1%(+8.52)#683 |
| 36. | 16671 | 10.3% | 2.0%(+8.24)#36 | 2.1%(+8.11)#736 |
| 37. | 16333 | 9.9% | 2.0%(+7.84)#37 | 2.1%(+7.71)#785 |
| 38. | 17075 | 9.5% | 2.0%(+7.50)#38 | 2.1%(+7.38)#834 |
| 39. | 15705 | 9.5% | 2.0%(+7.43)#39 | 2.1%(+7.30)#849 |
| 40. | 17949 | 9.4% | 2.0%(+7.41)#40 | 2.1%(+7.29)#851 |
| 41. | 15320 | 9.2% | 2.0%(+7.13)#41 | 2.1%(+7.00)#884 |
| 42. | 16258 | 8.9% | 2.0%(+6.83)#42 | 2.1%(+6.70)#943 |
| 43. | 16941 | 8.8% | 2.0%(+6.80)#43 | 2.1%(+6.68)#948 |
| 44. | 15344 | 8.7% | 2.0%(+6.69)#44 | 2.1%(+6.57)#967 |
| 45. | 19126 | 8.6% | 2.0%(+6.57)#45 | 2.1%(+6.44)#986 |
| 46. | 17850 | 8.6% | 2.0%(+6.54)#46 | 2.1%(+6.41)#995 |
| 47. | 16625 | 8.5% | 2.0%(+6.53)#47 | 2.1%(+6.40)#999 |
| 48. | 19474 | 8.5% | 2.0%(+6.49)#48 | 2.1%(+6.36)#1,005 |
| 49. | 16239 | 8.5% | 2.0%(+6.48)#49 | 2.1%(+6.35)#1,008 |
| 50. | 15450 | 8.5% | 2.0%(+6.47)#50 | 2.1%(+6.34)#1,010 |
| 51. | 17267 | 8.5% | 2.0%(+6.45)#51 | 2.1%(+6.32)#1,017 |
| 52. | 19132 | 8.5% | 2.0%(+6.44)#52 | 2.1%(+6.31)#1,019 |
| 53. | 17303 | 8.4% | 2.0%(+6.40)#53 | 2.1%(+6.27)#1,032 |
| 54. | 16250 | 8.4% | 2.0%(+6.39)#54 | 2.1%(+6.26)#1,035 |
| 55. | 17748 | 8.2% | 2.0%(+6.22)#55 | 2.1%(+6.09)#1,087 |
| 56. | 15563 | 8.2% | 2.0%(+6.18)#56 | 2.1%(+6.05)#1,097 |
| 57. | 17363 | 8.1% | 2.0%(+6.03)#57 | 2.1%(+5.90)#1,148 |
| 58. | 15615 | 7.9% | 2.0%(+5.92)#58 | 2.1%(+5.79)#1,189 |
| 59. | 16172 | 7.8% | 2.0%(+5.74)#59 | 2.1%(+5.61)#1,251 |
| 60. | 18507 | 7.8% | 2.0%(+5.73)#60 | 2.1%(+5.60)#1,254 |
| 61. | 17265 | 7.6% | 2.0%(+5.63)#61 | 2.1%(+5.50)#1,278 |
| 62. | 15076 | 7.6% | 2.0%(+5.55)#62 | 2.1%(+5.42)#1,307 |
| 63. | 19133 | 7.5% | 2.0%(+5.48)#63 | 2.1%(+5.36)#1,334 |
| 64. | 18615 | 7.3% | 2.0%(+5.32)#64 | 2.1%(+5.20)#1,383 |
| 65. | 16666 | 7.3% | 2.0%(+5.32)#65 | 2.1%(+5.19)#1,385 |
| 66. | 15828 | 7.3% | 2.0%(+5.30)#66 | 2.1%(+5.17)#1,391 |
| 67. | 18218 | 7.2% | 2.0%(+5.21)#67 | 2.1%(+5.08)#1,430 |
| 68. | 15337 | 7.2% | 2.0%(+5.19)#68 | 2.1%(+5.06)#1,437 |
| 69. | 15432 | 7.2% | 2.0%(+5.16)#69 | 2.1%(+5.03)#1,453 |
| 70. | 19076 | 7.2% | 2.0%(+5.15)#70 | 2.1%(+5.02)#1,458 |
| 71. | 17834 | 7.1% | 2.0%(+5.11)#71 | 2.1%(+4.99)#1,477 |
| 72. | 15088 | 7.1% | 2.0%(+5.09)#72 | 2.1%(+4.96)#1,487 |
| 73. | 15901 | 7.1% | 2.0%(+5.08)#73 | 2.1%(+4.95)#1,490 |
| 74. | 18232 | 7.0% | 2.0%(+5.01)#74 | 2.1%(+4.88)#1,519 |
| 75. | 15338 | 7.0% | 2.0%(+4.96)#75 | 2.1%(+4.83)#1,540 |
| 76. | 18216 | 7.0% | 2.0%(+4.95)#76 | 2.1%(+4.82)#1,548 |
| 77. | 17508 | 6.9% | 2.0%(+4.91)#77 | 2.1%(+4.78)#1,565 |
| 78. | 16843 | 6.9% | 2.0%(+4.86)#78 | 2.1%(+4.73)#1,590 |
| 79. | 15866 | 6.8% | 2.0%(+4.83)#79 | 2.1%(+4.70)#1,608 |
| 80. | 15064 | 6.8% | 2.0%(+4.81)#80 | 2.1%(+4.68)#1,616 |
| 81. | 15478 | 6.8% | 2.0%(+4.80)#81 | 2.1%(+4.68)#1,620 |
| 82. | 15960 | 6.8% | 2.0%(+4.78)#82 | 2.1%(+4.65)#1,629 |
| 83. | 19141 | 6.7% | 2.0%(+4.71)#83 | 2.1%(+4.58)#1,672 |
| 84. | 17066 | 6.7% | 2.0%(+4.67)#84 | 2.1%(+4.55)#1,691 |
| 85. | 19043 | 6.7% | 2.0%(+4.63)#85 | 2.1%(+4.51)#1,715 |
| 86. | 15942 | 6.6% | 2.0%(+4.55)#86 | 2.1%(+4.42)#1,762 |
| 87. | 17920 | 6.6% | 2.0%(+4.54)#87 | 2.1%(+4.41)#1,769 |
| 88. | 16845 | 6.5% | 2.0%(+4.48)#88 | 2.1%(+4.36)#1,782 |
| 89. | 19131 | 6.4% | 2.0%(+4.41)#89 | 2.1%(+4.28)#1,815 |
| 90. | 16210 | 6.3% | 2.0%(+4.25)#90 | 2.1%(+4.12)#1,911 |
| 91. | 19154 | 6.3% | 2.0%(+4.24)#91 | 2.1%(+4.11)#1,919 |
| 92. | 17731 | 6.2% | 2.0%(+4.23)#92 | 2.1%(+4.10)#1,925 |
| 93. | 16859 | 6.1% | 2.0%(+4.12)#93 | 2.1%(+3.99)#1,994 |
| 94. | 16114 | 6.1% | 2.0%(+4.06)#94 | 2.1%(+3.94)#2,026 |
| 95. | 15920 | 6.0% | 2.0%(+4.03)#95 | 2.1%(+3.90)#2,042 |
| 96. | 15724 | 6.0% | 2.0%(+4.00)#96 | 2.1%(+3.87)#2,065 |
| 97. | 15530 | 6.0% | 2.0%(+3.96)#97 | 2.1%(+3.83)#2,092 |
| 98. | 17824 | 5.9% | 2.0%(+3.91)#98 | 2.1%(+3.78)#2,125 |
| 99. | 15676 | 5.9% | 2.0%(+3.91)#99 | 2.1%(+3.78)#2,126 |
| 100. | 19151 | 5.9% | 2.0%(+3.89)#100 | 2.1%(+3.77)#2,138 |
Common Questions
What are the Top 10 Zip Codes with the Highest Percentage of Population Employed in Security & Protection in Pennsylvania?
Top 10 Zip Codes with the Highest Percentage of Population Employed in Security & Protection in Pennsylvania are:
What zip code has the Highest Percentage of Population Employed in Security & Protection in Pennsylvania?
15647 has the Highest Percentage of Population Employed in Security & Protection in Pennsylvania with 50.0%.
What is the Percentage of Population Employed in Security & Protection in the State of Pennsylvania?
Percentage of Population Employed in Security & Protection in Pennsylvania is 2.0%.
What is the Percentage of Population Employed in Security & Protection in the United States?
Percentage of Population Employed in Security & Protection in the United States is 2.1%.