Zip Codes with the Highest Percentage of Population Employed in Security & Protection in Alaska
RELATED REPORTS & OPTIONS
Security & Protection
Alaska
Compare Zip Codes
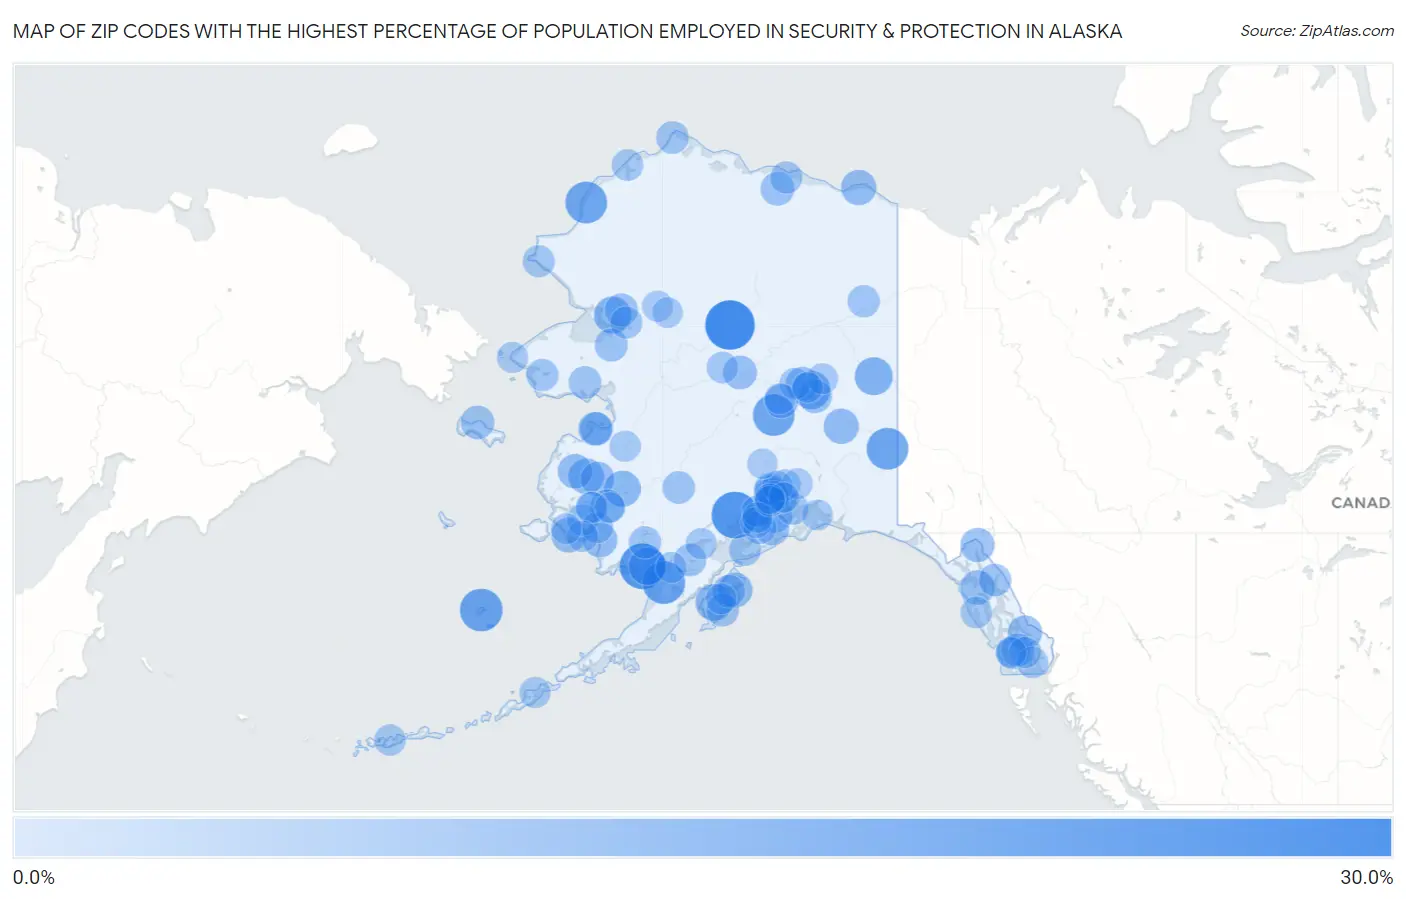
Map of Zip Codes with the Highest Percentage of Population Employed in Security & Protection in Alaska
0.0%
30.0%
Zip Codes with the Highest Percentage of Population Employed in Security & Protection in Alaska
| Zip Code | % Employed | vs State | vs National | |
| 1. | 99720 | 25.8% | 2.9%(+22.9)#1 | 2.1%(+23.7)#122 |
| 2. | 99635 | 22.2% | 2.9%(+19.3)#2 | 2.1%(+20.1)#165 |
| 3. | 99628 | 21.0% | 2.9%(+18.1)#3 | 2.1%(+18.9)#181 |
| 4. | 99579 | 17.4% | 2.9%(+14.4)#4 | 2.1%(+15.2)#274 |
| 5. | 99660 | 17.3% | 2.9%(+14.3)#5 | 2.1%(+15.1)#277 |
| 6. | 99759 | 16.1% | 2.9%(+13.2)#6 | 2.1%(+14.0)#311 |
| 7. | 99764 | 16.1% | 2.9%(+13.1)#7 | 2.1%(+13.9)#315 |
| 8. | 99743 | 15.9% | 2.9%(+13.0)#8 | 2.1%(+13.8)#321 |
| 9. | 99702 | 11.6% | 2.9%(+8.66)#9 | 2.1%(+9.46)#587 |
| 10. | 99738 | 11.4% | 2.9%(+8.48)#10 | 2.1%(+9.28)#612 |
| 11. | 99569 | 11.1% | 2.9%(+8.17)#11 | 2.1%(+8.96)#639 |
| 12. | 99763 | 10.3% | 2.9%(+7.37)#12 | 2.1%(+8.17)#729 |
| 13. | 99624 | 9.7% | 2.9%(+6.73)#13 | 2.1%(+7.53)#807 |
| 14. | 99626 | 9.2% | 2.9%(+6.29)#14 | 2.1%(+7.08)#872 |
| 15. | 99650 | 8.6% | 2.9%(+5.63)#15 | 2.1%(+6.42)#993 |
| 16. | 99747 | 8.1% | 2.9%(+5.16)#16 | 2.1%(+5.96)#1,128 |
| 17. | 99614 | 8.0% | 2.9%(+5.08)#17 | 2.1%(+5.88)#1,157 |
| 18. | 99631 | 8.0% | 2.9%(+5.08)#18 | 2.1%(+5.87)#1,160 |
| 19. | 99737 | 8.0% | 2.9%(+5.01)#19 | 2.1%(+5.80)#1,184 |
| 20. | 99644 | 7.8% | 2.9%(+4.90)#20 | 2.1%(+5.69)#1,226 |
| 21. | 99506 | 7.8% | 2.9%(+4.81)#21 | 2.1%(+5.61)#1,253 |
| 22. | 99655 | 7.4% | 2.9%(+4.45)#22 | 2.1%(+5.24)#1,366 |
| 23. | 99632 | 7.2% | 2.9%(+4.23)#23 | 2.1%(+5.03)#1,455 |
| 24. | 99829 | 7.1% | 2.9%(+4.20)#24 | 2.1%(+4.99)#1,471 |
| 25. | 99840 | 6.8% | 2.9%(+3.88)#25 | 2.1%(+4.67)#1,622 |
| 26. | 99929 | 6.7% | 2.9%(+3.80)#26 | 2.1%(+4.60)#1,659 |
| 27. | 99585 | 6.7% | 2.9%(+3.72)#27 | 2.1%(+4.52)#1,708 |
| 28. | 99777 | 6.5% | 2.9%(+3.51)#28 | 2.1%(+4.30)#1,808 |
| 29. | 99551 | 6.4% | 2.9%(+3.44)#29 | 2.1%(+4.23)#1,838 |
| 30. | 99744 | 6.4% | 2.9%(+3.44)#30 | 2.1%(+4.23)#1,839 |
| 31. | 99703 | 6.3% | 2.9%(+3.38)#31 | 2.1%(+4.18)#1,885 |
| 32. | 99519 | 6.2% | 2.9%(+3.29)#32 | 2.1%(+4.09)#1,931 |
| 33. | 99671 | 6.2% | 2.9%(+3.27)#33 | 2.1%(+4.07)#1,940 |
| 34. | 99714 | 6.2% | 2.9%(+3.26)#34 | 2.1%(+4.05)#1,955 |
| 35. | 99769 | 6.2% | 2.9%(+3.21)#35 | 2.1%(+4.01)#1,981 |
| 36. | 99664 | 5.8% | 2.9%(+2.82)#36 | 2.1%(+3.62)#2,241 |
| 37. | 99659 | 5.7% | 2.9%(+2.77)#37 | 2.1%(+3.57)#2,277 |
| 38. | 99921 | 5.6% | 2.9%(+2.70)#38 | 2.1%(+3.49)#2,334 |
| 39. | 99749 | 5.6% | 2.9%(+2.61)#39 | 2.1%(+3.41)#2,411 |
| 40. | 99568 | 5.4% | 2.9%(+2.49)#40 | 2.1%(+3.29)#2,501 |
| 41. | 99727 | 5.4% | 2.9%(+2.46)#41 | 2.1%(+3.26)#2,532 |
| 42. | 99643 | 5.4% | 2.9%(+2.41)#42 | 2.1%(+3.21)#2,578 |
| 43. | 99919 | 5.3% | 2.9%(+2.36)#43 | 2.1%(+3.15)#2,640 |
| 44. | 99550 | 5.1% | 2.9%(+2.14)#44 | 2.1%(+2.94)#2,827 |
| 45. | 99739 | 5.0% | 2.9%(+2.05)#45 | 2.1%(+2.85)#2,928 |
| 46. | 99613 | 5.0% | 2.9%(+2.01)#46 | 2.1%(+2.81)#2,975 |
| 47. | 99557 | 4.9% | 2.9%(+2.00)#47 | 2.1%(+2.80)#2,990 |
| 48. | 99723 | 4.9% | 2.9%(+1.93)#48 | 2.1%(+2.72)#3,073 |
| 49. | 99801 | 4.8% | 2.9%(+1.90)#49 | 2.1%(+2.70)#3,116 |
| 50. | 99577 | 4.6% | 2.9%(+1.64)#50 | 2.1%(+2.44)#3,463 |
| 51. | 99576 | 4.6% | 2.9%(+1.63)#51 | 2.1%(+2.43)#3,483 |
| 52. | 99762 | 4.5% | 2.9%(+1.57)#52 | 2.1%(+2.36)#3,595 |
| 53. | 99734 | 4.5% | 2.9%(+1.53)#53 | 2.1%(+2.33)#3,641 |
| 54. | 99740 | 4.5% | 2.9%(+1.51)#54 | 2.1%(+2.31)#3,671 |
| 55. | 99693 | 4.4% | 2.9%(+1.47)#55 | 2.1%(+2.27)#3,746 |
| 56. | 99770 | 4.4% | 2.9%(+1.45)#56 | 2.1%(+2.25)#3,783 |
| 57. | 99766 | 4.2% | 2.9%(+1.25)#57 | 2.1%(+2.05)#4,129 |
| 58. | 99663 | 4.0% | 2.9%(+1.10)#58 | 2.1%(+1.90)#4,405 |
| 59. | 99652 | 3.9% | 2.9%(+0.949)#59 | 2.1%(+1.75)#4,699 |
| 60. | 99504 | 3.8% | 2.9%(+0.879)#60 | 2.1%(+1.68)#4,854 |
| 61. | 99768 | 3.8% | 2.9%(+0.852)#61 | 2.1%(+1.65)#4,912 |
| 62. | 99641 | 3.7% | 2.9%(+0.789)#62 | 2.1%(+1.59)#5,057 |
| 63. | 99835 | 3.7% | 2.9%(+0.770)#63 | 2.1%(+1.57)#5,102 |
| 64. | 99782 | 3.7% | 2.9%(+0.758)#64 | 2.1%(+1.56)#5,136 |
| 65. | 99546 | 3.6% | 2.9%(+0.681)#65 | 2.1%(+1.48)#5,343 |
| 66. | 99559 | 3.6% | 2.9%(+0.632)#66 | 2.1%(+1.43)#5,461 |
| 67. | 99926 | 3.6% | 2.9%(+0.626)#67 | 2.1%(+1.42)#5,470 |
| 68. | 99709 | 3.6% | 2.9%(+0.612)#68 | 2.1%(+1.41)#5,512 |
| 69. | 99578 | 3.4% | 2.9%(+0.479)#69 | 2.1%(+1.28)#5,864 |
| 70. | 99901 | 3.4% | 2.9%(+0.455)#70 | 2.1%(+1.25)#5,931 |
| 71. | 99611 | 3.4% | 2.9%(+0.411)#71 | 2.1%(+1.21)#6,067 |
| 72. | 99609 | 3.3% | 2.9%(+0.388)#72 | 2.1%(+1.18)#6,151 |
| 73. | 99622 | 3.3% | 2.9%(+0.333)#73 | 2.1%(+1.13)#6,313 |
| 74. | 99669 | 3.3% | 2.9%(+0.327)#74 | 2.1%(+1.12)#6,334 |
| 75. | 99645 | 3.3% | 2.9%(+0.327)#75 | 2.1%(+1.12)#6,337 |
| 76. | 99685 | 3.2% | 2.9%(+0.247)#76 | 2.1%(+1.04)#6,567 |
| 77. | 99590 | 3.2% | 2.9%(+0.229)#77 | 2.1%(+1.03)#6,617 |
| 78. | 99606 | 3.2% | 2.9%(+0.212)#78 | 2.1%(+1.01)#6,669 |
| 79. | 99502 | 3.1% | 2.9%(+0.152)#79 | 2.1%(+0.949)#6,896 |
| 80. | 99783 | 3.0% | 2.9%(+0.085)#80 | 2.1%(+0.882)#7,112 |
| 81. | 99633 | 3.0% | 2.9%(+0.070)#81 | 2.1%(+0.867)#7,168 |
| 82. | 99623 | 3.0% | 2.9%(+0.043)#82 | 2.1%(+0.840)#7,274 |
| 83. | 99615 | 3.0% | 2.9%(+0.008)#83 | 2.1%(+0.805)#7,414 |
| 84. | 99786 | 2.9% | 2.9%(-0.047)#84 | 2.1%(+0.750)#7,648 |
| 85. | 99712 | 2.8% | 2.9%(-0.124)#85 | 2.1%(+0.673)#8,014 |
| 86. | 99760 | 2.8% | 2.9%(-0.134)#86 | 2.1%(+0.663)#8,067 |
| 87. | 99574 | 2.7% | 2.9%(-0.229)#87 | 2.1%(+0.568)#8,461 |
| 88. | 99505 | 2.7% | 2.9%(-0.234)#88 | 2.1%(+0.563)#8,475 |
| 89. | 99674 | 2.6% | 2.9%(-0.314)#89 | 2.1%(+0.483)#8,865 |
| 90. | 99654 | 2.6% | 2.9%(-0.346)#90 | 2.1%(+0.451)#9,003 |
| 91. | 99561 | 2.6% | 2.9%(-0.381)#91 | 2.1%(+0.416)#9,185 |
| 92. | 99773 | 2.5% | 2.9%(-0.414)#92 | 2.1%(+0.383)#9,344 |
| 93. | 99515 | 2.5% | 2.9%(-0.455)#93 | 2.1%(+0.342)#9,567 |
| 94. | 99925 | 2.4% | 2.9%(-0.506)#94 | 2.1%(+0.291)#9,855 |
| 95. | 99705 | 2.4% | 2.9%(-0.508)#95 | 2.1%(+0.289)#9,868 |
| 96. | 99567 | 2.4% | 2.9%(-0.521)#96 | 2.1%(+0.276)#9,930 |
| 97. | 99672 | 2.4% | 2.9%(-0.574)#97 | 2.1%(+0.223)#10,218 |
| 98. | 99552 | 2.3% | 2.9%(-0.647)#98 | 2.1%(+0.150)#10,654 |
| 99. | 99683 | 2.3% | 2.9%(-0.660)#99 | 2.1%(+0.137)#10,732 |
| 100. | 99517 | 2.2% | 2.9%(-0.708)#100 | 2.1%(+0.089)#11,026 |
Common Questions
What are the Top 10 Zip Codes with the Highest Percentage of Population Employed in Security & Protection in Alaska?
Top 10 Zip Codes with the Highest Percentage of Population Employed in Security & Protection in Alaska are:
What zip code has the Highest Percentage of Population Employed in Security & Protection in Alaska?
99720 has the Highest Percentage of Population Employed in Security & Protection in Alaska with 25.8%.
What is the Percentage of Population Employed in Security & Protection in the State of Alaska?
Percentage of Population Employed in Security & Protection in Alaska is 2.9%.
What is the Percentage of Population Employed in Security & Protection in the United States?
Percentage of Population Employed in Security & Protection in the United States is 2.1%.