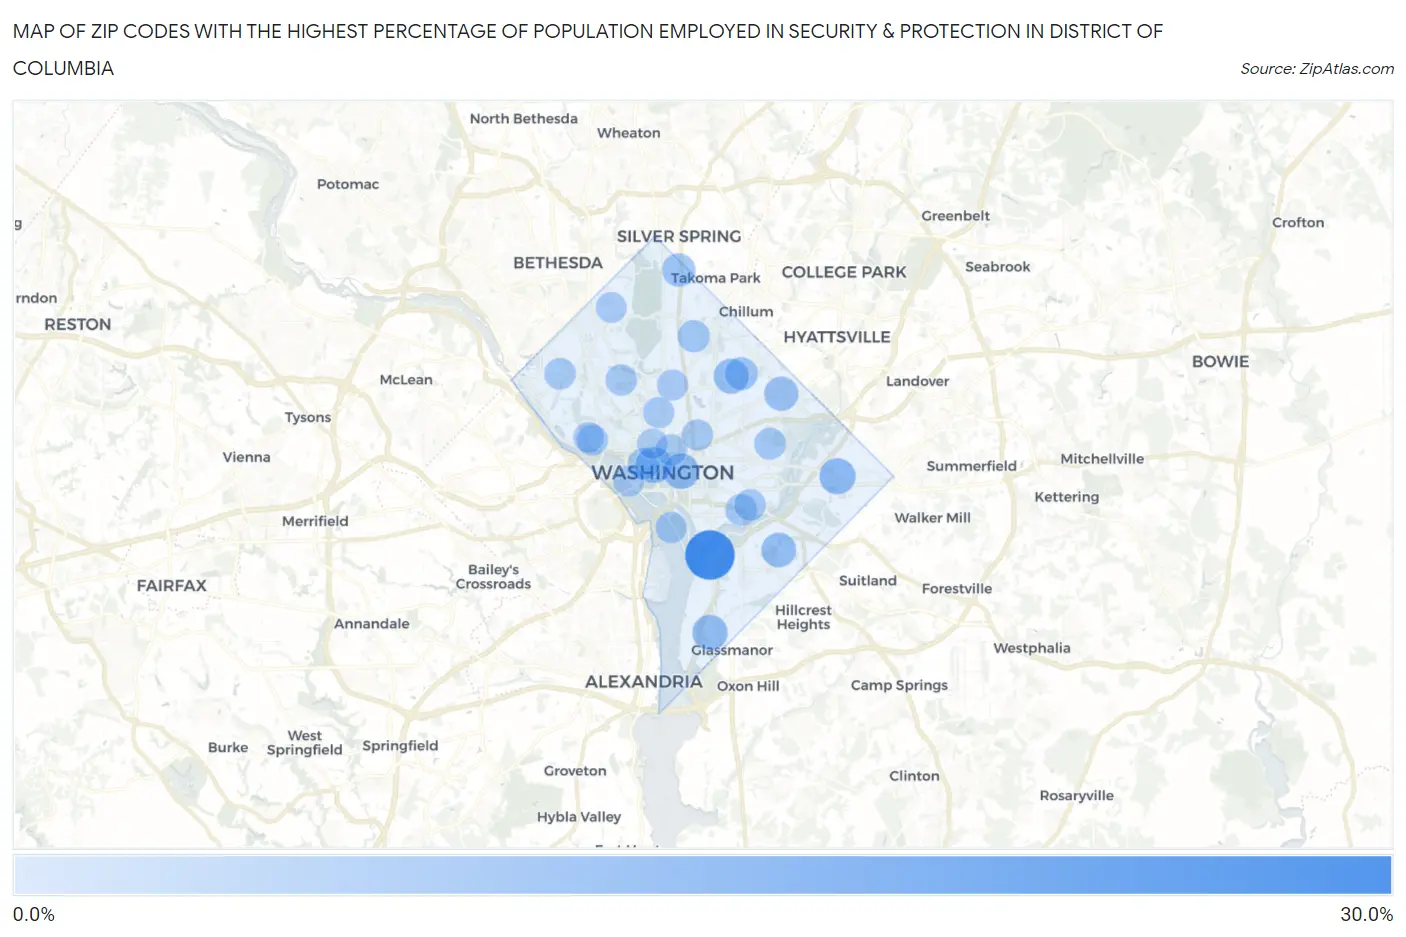
Zip Codes with the Highest Percentage of Population Employed in Security & Protection in District Of Columbia
RELATED REPORTS & OPTIONS
Security & Protection
District Of Columbia
Compare Zip Codes
Map of Zip Codes with the Highest Percentage of Population Employed in Security & Protection in District Of Columbia
0.0%
30.0%

Zip Codes with the Highest Percentage of Population Employed in Security & Protection in District Of Columbia
| Zip Code | % Employed | vs State | vs National | |
| 1. | 20373 | 25.4% | 2.4%(+23.0)#1 | 2.1%(+23.2)#126 |
| 2. | 20006 | 7.6% | 2.4%(+5.16)#2 | 2.1%(+5.46)#1,291 |
| 3. | 20019 | 7.3% | 2.4%(+4.87)#3 | 2.1%(+5.17)#1,393 |
| 4. | 20004 | 6.9% | 2.4%(+4.45)#4 | 2.1%(+4.75)#1,579 |
| 5. | 20032 | 6.4% | 2.4%(+3.91)#5 | 2.1%(+4.20)#1,860 |
| 6. | 20064 | 6.0% | 2.4%(+3.53)#6 | 2.1%(+3.83)#2,095 |
| 7. | 20020 | 5.5% | 2.4%(+3.05)#7 | 2.1%(+3.34)#2,462 |
| 8. | 20018 | 4.9% | 2.4%(+2.47)#8 | 2.1%(+2.76)#3,036 |
| 9. | 20012 | 3.8% | 2.4%(+1.38)#9 | 2.1%(+1.68)#4,857 |
| 10. | 20017 | 3.4% | 2.4%(+0.929)#10 | 2.1%(+1.22)#6,014 |
| 11. | 20011 | 2.4% | 2.4%(-0.080)#11 | 2.1%(+0.215)#10,260 |
| 12. | 20052 | 1.9% | 2.4%(-0.531)#12 | 2.1%(-0.235)#13,129 |
| 13. | 20002 | 1.7% | 2.4%(-0.739)#13 | 2.1%(-0.443)#14,645 |
| 14. | 20390 | 1.7% | 2.4%(-0.763)#14 | 2.1%(-0.468)#14,826 |
| 15. | 20003 | 1.6% | 2.4%(-0.868)#15 | 2.1%(-0.573)#15,596 |
| 16. | 20005 | 1.5% | 2.4%(-0.980)#16 | 2.1%(-0.685)#16,472 |
| 17. | 20016 | 1.4% | 2.4%(-1.02)#17 | 2.1%(-0.729)#16,809 |
| 18. | 20008 | 1.3% | 2.4%(-1.12)#18 | 2.1%(-0.822)#17,527 |
| 19. | 20001 | 1.2% | 2.4%(-1.26)#19 | 2.1%(-0.966)#18,645 |
| 20. | 20024 | 1.1% | 2.4%(-1.38)#20 | 2.1%(-1.09)#19,567 |
| 21. | 20057 | 1.1% | 2.4%(-1.39)#21 | 2.1%(-1.10)#19,660 |
| 22. | 20009 | 0.98% | 2.4%(-1.46)#22 | 2.1%(-1.17)#20,210 |
| 23. | 20010 | 0.82% | 2.4%(-1.62)#23 | 2.1%(-1.33)#21,307 |
| 24. | 20037 | 0.76% | 2.4%(-1.68)#24 | 2.1%(-1.39)#21,647 |
| 25. | 20007 | 0.58% | 2.4%(-1.87)#25 | 2.1%(-1.57)#22,806 |
| 26. | 20015 | 0.48% | 2.4%(-1.96)#26 | 2.1%(-1.67)#23,316 |
| 27. | 20036 | 0.22% | 2.4%(-2.23)#27 | 2.1%(-1.93)#24,478 |
1
Common Questions
What are the Top 10 Zip Codes with the Highest Percentage of Population Employed in Security & Protection in District Of Columbia?
Top 10 Zip Codes with the Highest Percentage of Population Employed in Security & Protection in District Of Columbia are:
What zip code has the Highest Percentage of Population Employed in Security & Protection in District Of Columbia?
20373 has the Highest Percentage of Population Employed in Security & Protection in District Of Columbia with 25.4%.
What is the Percentage of Population Employed in Security & Protection in the State of District Of Columbia?
Percentage of Population Employed in Security & Protection in District Of Columbia is 2.4%.
What is the Percentage of Population Employed in Security & Protection in the United States?
Percentage of Population Employed in Security & Protection in the United States is 2.1%.