Zip Codes with the Highest Percentage of White / Caucasian Population in Los Angeles, CA
RELATED REPORTS & OPTIONS
White / Caucasian
Los Angeles
Compare Zip Codes
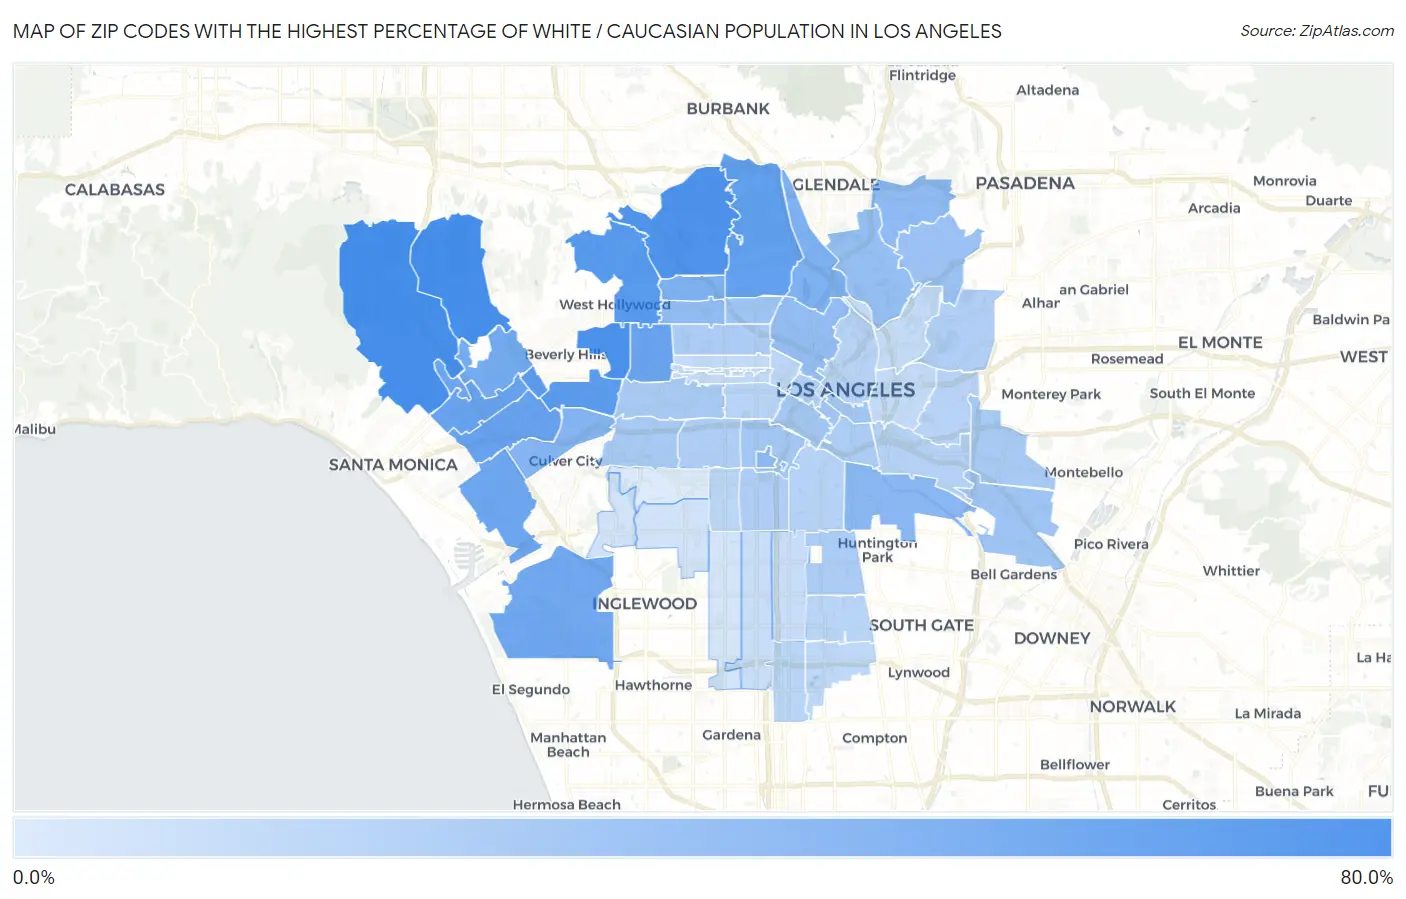
Map of Zip Codes with the Highest Percentage of White / Caucasian Population in Los Angeles
9.5%
79.6%
Zip Codes with the Highest Percentage of White / Caucasian Population in Los Angeles, CA
| Zip Code | White / Caucasian | vs State | vs National | |
| 1. | 90077 | 79.6% | 48.1%(+31.5)#392 | 65.9%(+13.7)#21,177 |
| 2. | 90049 | 79.1% | 48.1%(+31.0)#404 | 65.9%(+13.2)#21,369 |
| 3. | 90048 | 76.6% | 48.1%(+28.5)#475 | 65.9%(+10.8)#22,407 |
| 4. | 90068 | 76.0% | 48.1%(+27.9)#492 | 65.9%(+10.1)#22,659 |
| 5. | 90046 | 70.7% | 48.1%(+22.6)#655 | 65.9%(+4.86)#24,497 |
| 6. | 90035 | 69.4% | 48.1%(+21.2)#678 | 65.9%(+3.50)#24,889 |
| 7. | 90067 | 68.8% | 48.1%(+20.7)#692 | 65.9%(+2.91)#25,047 |
| 8. | 90027 | 64.0% | 48.1%(+15.9)#824 | 65.9%(-1.86)#26,390 |
| 9. | 90064 | 61.7% | 48.1%(+13.5)#880 | 65.9%(-4.20)#26,909 |
| 10. | 90025 | 61.5% | 48.1%(+13.4)#885 | 65.9%(-4.33)#26,939 |
| 11. | 90036 | 60.2% | 48.1%(+12.1)#911 | 65.9%(-5.67)#27,241 |
| 12. | 90066 | 58.1% | 48.1%(+10.0)#959 | 65.9%(-7.73)#27,668 |
| 13. | 90073 | 57.5% | 48.1%(+9.36)#973 | 65.9%(-8.38)#27,806 |
| 14. | 90045 | 56.3% | 48.1%(+8.18)#1,006 | 65.9%(-9.56)#28,043 |
| 15. | 90024 | 54.7% | 48.1%(+6.61)#1,050 | 65.9%(-11.1)#28,348 |
| 16. | 90039 | 50.0% | 48.1%(+1.90)#1,163 | 65.9%(-15.8)#29,179 |
| 17. | 90028 | 49.6% | 48.1%(+1.45)#1,175 | 65.9%(-16.3)#29,254 |
| 18. | 90034 | 45.8% | 48.1%(-2.31)#1,249 | 65.9%(-20.1)#29,799 |
| 19. | 90089 | 44.1% | 48.1%(-3.99)#1,284 | 65.9%(-21.7)#30,028 |
| 20. | 90058 | 43.7% | 48.1%(-4.41)#1,297 | 65.9%(-22.2)#30,082 |
| 21. | 90041 | 41.9% | 48.1%(-6.21)#1,337 | 65.9%(-24.0)#30,307 |
| 22. | 90038 | 40.2% | 48.1%(-7.91)#1,362 | 65.9%(-25.7)#30,501 |
| 23. | 90026 | 39.7% | 48.1%(-8.44)#1,372 | 65.9%(-26.2)#30,552 |
| 24. | 90065 | 38.2% | 48.1%(-9.89)#1,400 | 65.9%(-27.6)#30,727 |
| 25. | 90042 | 35.4% | 48.1%(-12.7)#1,458 | 65.9%(-30.4)#31,022 |
| 26. | 90040 | 34.6% | 48.1%(-13.5)#1,474 | 65.9%(-31.3)#31,096 |
| 27. | 90029 | 34.3% | 48.1%(-13.8)#1,478 | 65.9%(-31.6)#31,121 |
| 28. | 90014 | 33.5% | 48.1%(-14.6)#1,492 | 65.9%(-32.3)#31,179 |
| 29. | 90015 | 32.6% | 48.1%(-15.5)#1,511 | 65.9%(-33.3)#31,264 |
| 30. | 90007 | 32.6% | 48.1%(-15.6)#1,513 | 65.9%(-33.3)#31,266 |
| 31. | 90013 | 32.6% | 48.1%(-15.6)#1,514 | 65.9%(-33.3)#31,270 |
| 32. | 90016 | 30.8% | 48.1%(-17.4)#1,543 | 65.9%(-35.1)#31,424 |
| 33. | 90019 | 30.5% | 48.1%(-17.6)#1,549 | 65.9%(-35.4)#31,446 |
| 34. | 90022 | 30.1% | 48.1%(-18.0)#1,558 | 65.9%(-35.8)#31,479 |
| 35. | 90004 | 28.9% | 48.1%(-19.2)#1,575 | 65.9%(-37.0)#31,577 |
| 36. | 90001 | 28.2% | 48.1%(-19.9)#1,582 | 65.9%(-37.6)#31,620 |
| 37. | 90021 | 28.2% | 48.1%(-19.9)#1,583 | 65.9%(-37.7)#31,621 |
| 38. | 90037 | 27.4% | 48.1%(-20.7)#1,597 | 65.9%(-38.5)#31,672 |
| 39. | 90018 | 27.1% | 48.1%(-21.0)#1,603 | 65.9%(-38.7)#31,691 |
| 40. | 90032 | 26.1% | 48.1%(-22.0)#1,616 | 65.9%(-39.7)#31,756 |
| 41. | 90017 | 26.1% | 48.1%(-22.0)#1,617 | 65.9%(-39.7)#31,757 |
| 42. | 90023 | 24.8% | 48.1%(-23.4)#1,629 | 65.9%(-41.1)#31,834 |
| 43. | 90011 | 24.2% | 48.1%(-23.9)#1,633 | 65.9%(-41.7)#31,873 |
| 44. | 90063 | 24.0% | 48.1%(-24.1)#1,635 | 65.9%(-41.9)#31,885 |
| 45. | 90012 | 24.0% | 48.1%(-24.1)#1,636 | 65.9%(-41.9)#31,888 |
| 46. | 90006 | 23.4% | 48.1%(-24.7)#1,644 | 65.9%(-42.5)#31,926 |
| 47. | 90002 | 23.2% | 48.1%(-25.0)#1,650 | 65.9%(-42.7)#31,947 |
| 48. | 90061 | 22.5% | 48.1%(-25.6)#1,662 | 65.9%(-43.4)#32,001 |
| 49. | 90057 | 22.2% | 48.1%(-25.9)#1,666 | 65.9%(-43.7)#32,022 |
| 50. | 90062 | 21.7% | 48.1%(-26.4)#1,669 | 65.9%(-44.2)#32,037 |
| 51. | 90059 | 21.0% | 48.1%(-27.1)#1,676 | 65.9%(-44.8)#32,076 |
| 52. | 90005 | 19.5% | 48.1%(-28.6)#1,689 | 65.9%(-46.4)#32,152 |
| 53. | 90033 | 19.5% | 48.1%(-28.7)#1,690 | 65.9%(-46.4)#32,157 |
| 54. | 90020 | 19.2% | 48.1%(-28.9)#1,695 | 65.9%(-46.7)#32,172 |
| 55. | 90010 | 19.2% | 48.1%(-28.9)#1,696 | 65.9%(-46.7)#32,173 |
| 56. | 90031 | 19.1% | 48.1%(-29.0)#1,698 | 65.9%(-46.8)#32,178 |
| 57. | 90003 | 17.2% | 48.1%(-31.0)#1,714 | 65.9%(-48.7)#32,291 |
| 58. | 90044 | 17.1% | 48.1%(-31.1)#1,719 | 65.9%(-48.8)#32,300 |
| 59. | 90071 | 16.6% | 48.1%(-31.5)#1,724 | 65.9%(-49.3)#32,321 |
| 60. | 90043 | 13.5% | 48.1%(-34.7)#1,736 | 65.9%(-52.4)#32,456 |
| 61. | 90056 | 13.4% | 48.1%(-34.7)#1,737 | 65.9%(-52.4)#32,457 |
| 62. | 90047 | 13.2% | 48.1%(-34.9)#1,741 | 65.9%(-52.7)#32,468 |
| 63. | 90008 | 9.5% | 48.1%(-38.7)#1,749 | 65.9%(-56.4)#32,629 |
1
Common Questions
What are the Top 10 Zip Codes with the Highest Percentage of White / Caucasian Population in Los Angeles, CA?
Top 10 Zip Codes with the Highest Percentage of White / Caucasian Population in Los Angeles, CA are:
What zip code has the Highest Percentage of White / Caucasian Population in Los Angeles, CA?
90077 has the Highest Percentage of White / Caucasian Population in Los Angeles, CA with 79.6%.
What is the Percentage of White / Caucasian Population in Los Angeles, CA?
Percentage of White / Caucasian Population in Los Angeles is 41.2%.
What is the Percentage of White / Caucasian Population in California?
Percentage of White / Caucasian Population in California is 48.1%.
What is the Percentage of White / Caucasian Population in the United States?
Percentage of White / Caucasian Population in the United States is 65.9%.