Zip Codes with the Highest Percentage of Population Employed in Security & Protection in Missouri
RELATED REPORTS & OPTIONS
Security & Protection
Missouri
Compare Zip Codes
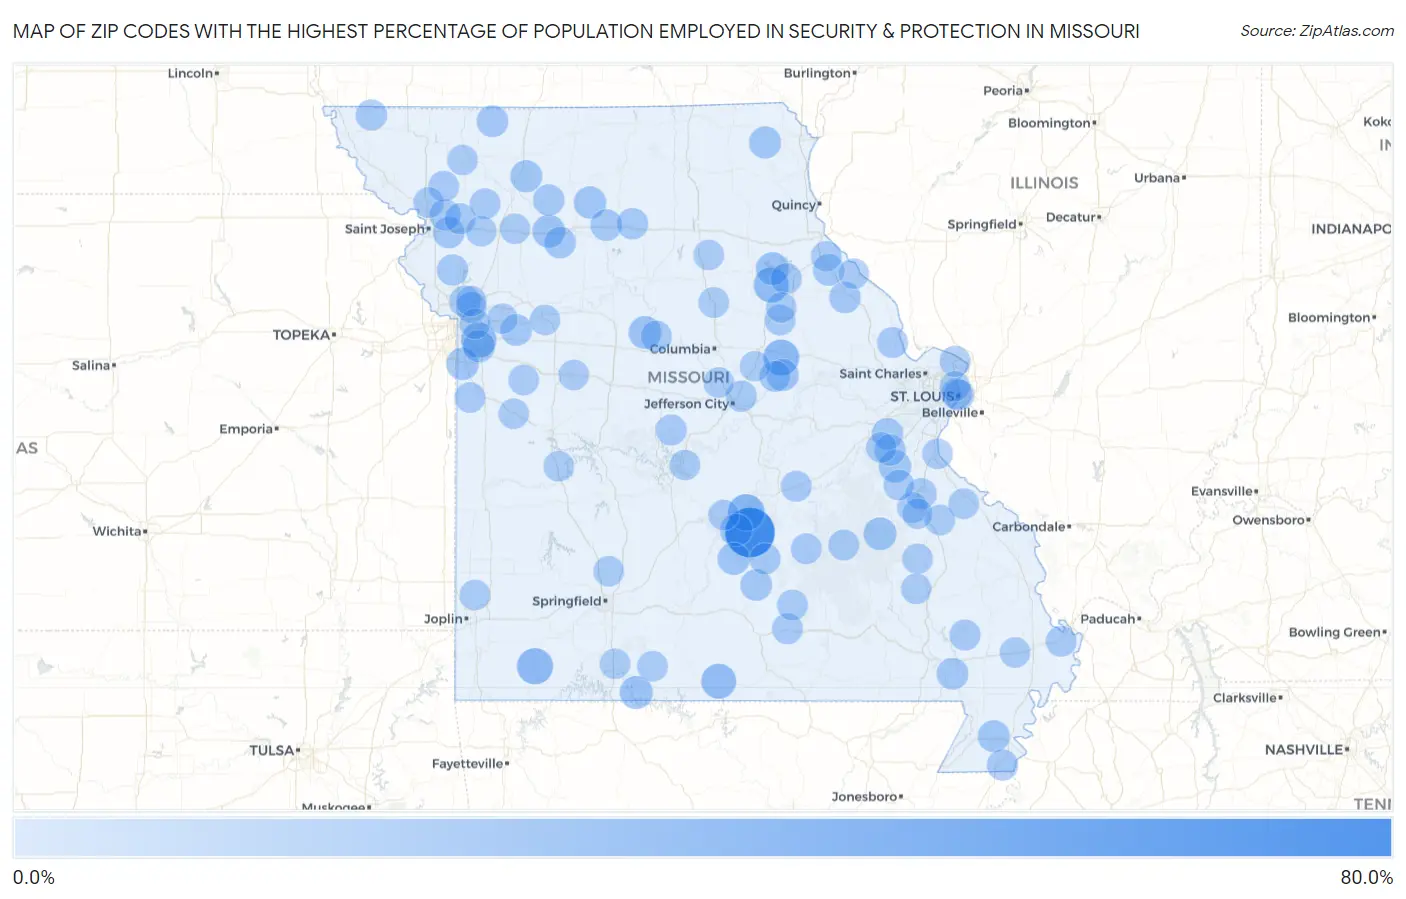
Map of Zip Codes with the Highest Percentage of Population Employed in Security & Protection in Missouri
0.0%
80.0%
Zip Codes with the Highest Percentage of Population Employed in Security & Protection in Missouri
| Zip Code | % Employed | vs State | vs National | |
| 1. | 65461 | 67.3% | 1.9%(+65.5)#1 | 2.1%(+65.2)#22 |
| 2. | 65457 | 24.1% | 1.9%(+22.2)#2 | 2.1%(+22.0)#138 |
| 3. | 65623 | 22.2% | 1.9%(+20.3)#3 | 2.1%(+20.1)#167 |
| 4. | 63388 | 21.7% | 1.9%(+19.8)#4 | 2.1%(+19.6)#173 |
| 5. | 64136 | 19.4% | 1.9%(+17.5)#5 | 2.1%(+17.3)#211 |
| 6. | 65282 | 19.1% | 1.9%(+17.3)#6 | 2.1%(+17.0)#221 |
| 7. | 65760 | 18.4% | 1.9%(+16.5)#7 | 2.1%(+16.3)#236 |
| 8. | 65283 | 12.4% | 1.9%(+10.5)#8 | 2.1%(+10.3)#514 |
| 9. | 65627 | 12.1% | 1.9%(+10.2)#9 | 2.1%(+9.98)#542 |
| 10. | 65320 | 11.8% | 1.9%(+9.87)#10 | 2.1%(+9.62)#574 |
| 11. | 63623 | 11.7% | 1.9%(+9.78)#11 | 2.1%(+9.52)#582 |
| 12. | 64625 | 11.5% | 1.9%(+9.64)#12 | 2.1%(+9.38)#596 |
| 13. | 65473 | 10.7% | 1.9%(+8.77)#13 | 2.1%(+8.52)#684 |
| 14. | 64147 | 10.6% | 1.9%(+8.70)#14 | 2.1%(+8.44)#693 |
| 15. | 63030 | 10.5% | 1.9%(+8.58)#15 | 2.1%(+8.33)#710 |
| 16. | 64635 | 10.1% | 1.9%(+8.21)#16 | 2.1%(+7.95)#753 |
| 17. | 65552 | 10.0% | 1.9%(+8.13)#17 | 2.1%(+7.88)#761 |
| 18. | 65067 | 9.7% | 1.9%(+7.80)#18 | 2.1%(+7.54)#805 |
| 19. | 64139 | 9.6% | 1.9%(+7.71)#19 | 2.1%(+7.46)#823 |
| 20. | 63474 | 9.1% | 1.9%(+7.20)#20 | 2.1%(+6.94)#892 |
| 21. | 64636 | 9.1% | 1.9%(+7.20)#21 | 2.1%(+6.94)#894 |
| 22. | 63827 | 8.5% | 1.9%(+6.56)#22 | 2.1%(+6.30)#1,026 |
| 23. | 63932 | 8.2% | 1.9%(+6.30)#23 | 2.1%(+6.04)#1,100 |
| 24. | 65483 | 7.8% | 1.9%(+5.90)#24 | 2.1%(+5.64)#1,243 |
| 25. | 64074 | 7.7% | 1.9%(+5.83)#25 | 2.1%(+5.58)#1,262 |
| 26. | 64656 | 7.7% | 1.9%(+5.80)#26 | 2.1%(+5.54)#1,269 |
| 27. | 64420 | 7.7% | 1.9%(+5.80)#27 | 2.1%(+5.54)#1,271 |
| 28. | 63441 | 7.4% | 1.9%(+5.49)#28 | 2.1%(+5.23)#1,370 |
| 29. | 64659 | 7.4% | 1.9%(+5.48)#29 | 2.1%(+5.22)#1,374 |
| 30. | 63334 | 7.3% | 1.9%(+5.40)#30 | 2.1%(+5.14)#1,403 |
| 31. | 64443 | 7.2% | 1.9%(+5.30)#31 | 2.1%(+5.05)#1,440 |
| 32. | 63072 | 7.1% | 1.9%(+5.23)#32 | 2.1%(+4.98)#1,480 |
| 33. | 63041 | 6.9% | 1.9%(+5.01)#33 | 2.1%(+4.75)#1,582 |
| 34. | 64156 | 6.8% | 1.9%(+4.94)#34 | 2.1%(+4.68)#1,617 |
| 35. | 64648 | 6.8% | 1.9%(+4.92)#35 | 2.1%(+4.66)#1,626 |
| 36. | 64628 | 6.8% | 1.9%(+4.91)#36 | 2.1%(+4.66)#1,627 |
| 37. | 64436 | 6.8% | 1.9%(+4.87)#37 | 2.1%(+4.61)#1,652 |
| 38. | 65250 | 6.7% | 1.9%(+4.81)#38 | 2.1%(+4.56)#1,684 |
| 39. | 64444 | 6.4% | 1.9%(+4.56)#39 | 2.1%(+4.30)#1,809 |
| 40. | 65043 | 6.4% | 1.9%(+4.49)#40 | 2.1%(+4.23)#1,844 |
| 41. | 63839 | 6.3% | 1.9%(+4.46)#41 | 2.1%(+4.20)#1,866 |
| 42. | 64498 | 6.2% | 1.9%(+4.28)#42 | 2.1%(+4.02)#1,970 |
| 43. | 64430 | 6.2% | 1.9%(+4.27)#43 | 2.1%(+4.01)#1,977 |
| 44. | 65542 | 6.1% | 1.9%(+4.18)#44 | 2.1%(+3.92)#2,031 |
| 45. | 63462 | 5.9% | 1.9%(+3.96)#45 | 2.1%(+3.70)#2,178 |
| 46. | 65077 | 5.8% | 1.9%(+3.90)#46 | 2.1%(+3.64)#2,213 |
| 47. | 63960 | 5.7% | 1.9%(+3.83)#47 | 2.1%(+3.58)#2,267 |
| 48. | 63628 | 5.7% | 1.9%(+3.78)#48 | 2.1%(+3.52)#2,306 |
| 49. | 64158 | 5.6% | 1.9%(+3.75)#49 | 2.1%(+3.49)#2,335 |
| 50. | 65011 | 5.6% | 1.9%(+3.67)#50 | 2.1%(+3.42)#2,399 |
| 51. | 63106 | 5.4% | 1.9%(+3.51)#51 | 2.1%(+3.25)#2,542 |
| 52. | 63386 | 5.4% | 1.9%(+3.47)#52 | 2.1%(+3.21)#2,577 |
| 53. | 65232 | 5.3% | 1.9%(+3.44)#53 | 2.1%(+3.18)#2,602 |
| 54. | 65548 | 5.3% | 1.9%(+3.44)#54 | 2.1%(+3.18)#2,607 |
| 55. | 63389 | 5.3% | 1.9%(+3.38)#55 | 2.1%(+3.12)#2,656 |
| 56. | 63102 | 5.3% | 1.9%(+3.36)#56 | 2.1%(+3.10)#2,677 |
| 57. | 65440 | 5.2% | 1.9%(+3.34)#57 | 2.1%(+3.08)#2,686 |
| 58. | 63834 | 5.2% | 1.9%(+3.33)#58 | 2.1%(+3.07)#2,695 |
| 59. | 65559 | 5.1% | 1.9%(+3.19)#59 | 2.1%(+2.94)#2,828 |
| 60. | 65571 | 5.0% | 1.9%(+3.14)#60 | 2.1%(+2.88)#2,889 |
| 61. | 64469 | 5.0% | 1.9%(+3.10)#61 | 2.1%(+2.85)#2,932 |
| 62. | 64480 | 5.0% | 1.9%(+3.08)#62 | 2.1%(+2.82)#2,960 |
| 63. | 65560 | 5.0% | 1.9%(+3.07)#63 | 2.1%(+2.82)#2,968 |
| 64. | 64485 | 4.8% | 1.9%(+2.87)#64 | 2.1%(+2.61)#3,227 |
| 65. | 63670 | 4.7% | 1.9%(+2.79)#65 | 2.1%(+2.53)#3,331 |
| 66. | 63653 | 4.7% | 1.9%(+2.76)#66 | 2.1%(+2.50)#3,365 |
| 67. | 63630 | 4.6% | 1.9%(+2.75)#67 | 2.1%(+2.49)#3,382 |
| 68. | 64040 | 4.6% | 1.9%(+2.71)#68 | 2.1%(+2.45)#3,447 |
| 69. | 65614 | 4.6% | 1.9%(+2.69)#69 | 2.1%(+2.43)#3,481 |
| 70. | 65725 | 4.6% | 1.9%(+2.68)#70 | 2.1%(+2.42)#3,493 |
| 71. | 64746 | 4.5% | 1.9%(+2.62)#71 | 2.1%(+2.36)#3,593 |
| 72. | 64474 | 4.5% | 1.9%(+2.62)#72 | 2.1%(+2.36)#3,599 |
| 73. | 64857 | 4.5% | 1.9%(+2.58)#73 | 2.1%(+2.32)#3,655 |
| 74. | 63640 | 4.5% | 1.9%(+2.58)#74 | 2.1%(+2.32)#3,657 |
| 75. | 65583 | 4.5% | 1.9%(+2.57)#75 | 2.1%(+2.31)#3,673 |
| 76. | 65243 | 4.4% | 1.9%(+2.49)#76 | 2.1%(+2.24)#3,801 |
| 77. | 63459 | 4.3% | 1.9%(+2.41)#77 | 2.1%(+2.16)#3,939 |
| 78. | 63019 | 4.3% | 1.9%(+2.41)#78 | 2.1%(+2.15)#3,948 |
| 79. | 63060 | 4.3% | 1.9%(+2.38)#79 | 2.1%(+2.13)#3,986 |
| 80. | 64067 | 4.3% | 1.9%(+2.36)#80 | 2.1%(+2.11)#4,012 |
| 81. | 65039 | 4.2% | 1.9%(+2.36)#81 | 2.1%(+2.10)#4,029 |
| 82. | 65336 | 4.2% | 1.9%(+2.33)#82 | 2.1%(+2.07)#4,092 |
| 83. | 63621 | 4.2% | 1.9%(+2.31)#83 | 2.1%(+2.05)#4,124 |
| 84. | 65771 | 4.2% | 1.9%(+2.30)#84 | 2.1%(+2.04)#4,141 |
| 85. | 63868 | 4.2% | 1.9%(+2.28)#85 | 2.1%(+2.02)#4,185 |
| 86. | 65047 | 4.1% | 1.9%(+2.25)#86 | 2.1%(+1.99)#4,227 |
| 87. | 64763 | 4.1% | 1.9%(+2.25)#87 | 2.1%(+1.99)#4,228 |
| 88. | 64054 | 4.1% | 1.9%(+2.20)#88 | 2.1%(+1.94)#4,314 |
| 89. | 64088 | 4.1% | 1.9%(+2.19)#89 | 2.1%(+1.94)#4,331 |
| 90. | 64157 | 4.0% | 1.9%(+2.08)#90 | 2.1%(+1.82)#4,555 |
| 91. | 65280 | 3.9% | 1.9%(+2.06)#91 | 2.1%(+1.80)#4,594 |
| 92. | 63353 | 3.9% | 1.9%(+2.03)#92 | 2.1%(+1.77)#4,651 |
| 93. | 64739 | 3.9% | 1.9%(+2.02)#93 | 2.1%(+1.77)#4,662 |
| 94. | 65260 | 3.9% | 1.9%(+2.02)#94 | 2.1%(+1.76)#4,663 |
| 95. | 64489 | 3.9% | 1.9%(+2.02)#95 | 2.1%(+1.76)#4,668 |
| 96. | 63636 | 3.9% | 1.9%(+2.00)#96 | 2.1%(+1.75)#4,696 |
| 97. | 64649 | 3.9% | 1.9%(+1.98)#97 | 2.1%(+1.73)#4,744 |
| 98. | 65251 | 3.9% | 1.9%(+1.97)#98 | 2.1%(+1.72)#4,764 |
| 99. | 63601 | 3.8% | 1.9%(+1.96)#99 | 2.1%(+1.70)#4,807 |
| 100. | 63147 | 3.8% | 1.9%(+1.95)#100 | 2.1%(+1.70)#4,818 |
Common Questions
What are the Top 10 Zip Codes with the Highest Percentage of Population Employed in Security & Protection in Missouri?
Top 10 Zip Codes with the Highest Percentage of Population Employed in Security & Protection in Missouri are:
What zip code has the Highest Percentage of Population Employed in Security & Protection in Missouri?
65461 has the Highest Percentage of Population Employed in Security & Protection in Missouri with 67.3%.
What is the Percentage of Population Employed in Security & Protection in the State of Missouri?
Percentage of Population Employed in Security & Protection in Missouri is 1.9%.
What is the Percentage of Population Employed in Security & Protection in the United States?
Percentage of Population Employed in Security & Protection in the United States is 2.1%.