Zip Codes with the Highest Percentage of Population Employed in Security & Protection in Illinois
RELATED REPORTS & OPTIONS
Security & Protection
Illinois
Compare Zip Codes
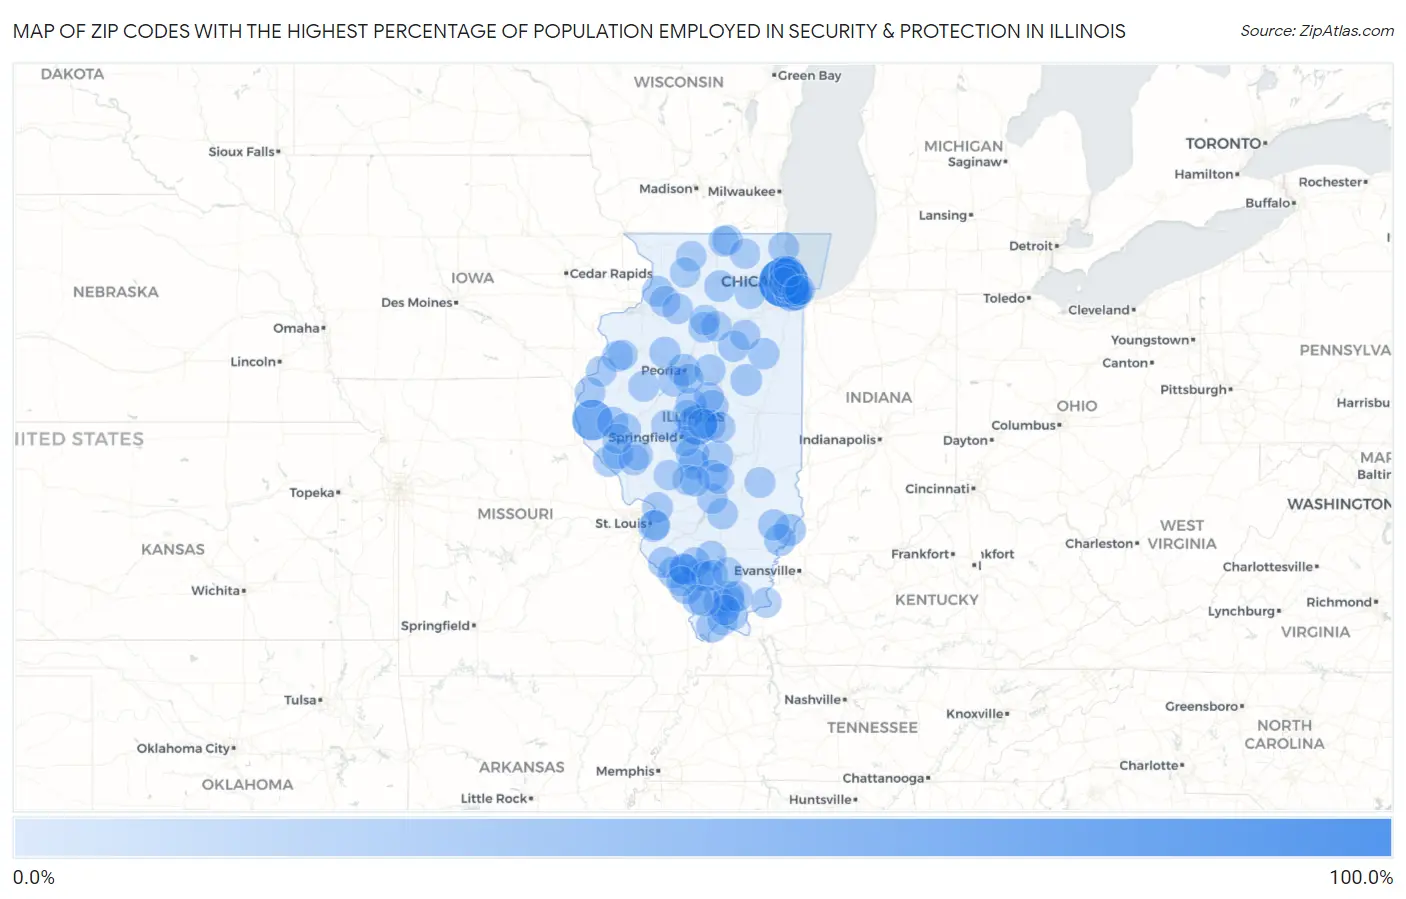
Map of Zip Codes with the Highest Percentage of Population Employed in Security & Protection in Illinois
0.0%
100.0%
Zip Codes with the Highest Percentage of Population Employed in Security & Protection in Illinois
| Zip Code | % Employed | vs State | vs National | |
| 1. | 60141 | 100.0% | 2.2%(+97.8)#1 | 2.1%(+97.9)#3 |
| 2. | 62359 | 55.3% | 2.2%(+53.1)#2 | 2.1%(+53.1)#29 |
| 3. | 62541 | 50.0% | 2.2%(+47.8)#3 | 2.1%(+47.9)#38 |
| 4. | 62570 | 19.2% | 2.2%(+17.0)#4 | 2.1%(+17.1)#215 |
| 5. | 62950 | 17.9% | 2.2%(+15.7)#5 | 2.1%(+15.8)#259 |
| 6. | 60655 | 17.6% | 2.2%(+15.4)#6 | 2.1%(+15.4)#266 |
| 7. | 62970 | 15.6% | 2.2%(+13.4)#7 | 2.1%(+13.5)#335 |
| 8. | 61625 | 15.2% | 2.2%(+13.0)#8 | 2.1%(+13.1)#352 |
| 9. | 61778 | 12.9% | 2.2%(+10.7)#9 | 2.1%(+10.8)#480 |
| 10. | 61720 | 12.4% | 2.2%(+10.2)#10 | 2.1%(+10.3)#515 |
| 11. | 62410 | 12.4% | 2.2%(+10.2)#11 | 2.1%(+10.2)#518 |
| 12. | 62811 | 12.3% | 2.2%(+10.1)#12 | 2.1%(+10.2)#523 |
| 13. | 62233 | 12.3% | 2.2%(+10.1)#13 | 2.1%(+10.2)#524 |
| 14. | 62972 | 11.8% | 2.2%(+9.57)#14 | 2.1%(+9.62)#569 |
| 15. | 60530 | 11.6% | 2.2%(+9.40)#15 | 2.1%(+9.45)#588 |
| 16. | 62994 | 11.4% | 2.2%(+9.21)#16 | 2.1%(+9.25)#614 |
| 17. | 60631 | 11.1% | 2.2%(+8.87)#17 | 2.1%(+8.91)#642 |
| 18. | 62375 | 11.0% | 2.2%(+8.85)#18 | 2.1%(+8.89)#645 |
| 19. | 61451 | 10.8% | 2.2%(+8.58)#19 | 2.1%(+8.62)#670 |
| 20. | 62452 | 10.6% | 2.2%(+8.40)#20 | 2.1%(+8.44)#694 |
| 21. | 62366 | 10.5% | 2.2%(+8.26)#21 | 2.1%(+8.30)#715 |
| 22. | 60946 | 10.4% | 2.2%(+8.23)#22 | 2.1%(+8.27)#720 |
| 23. | 61319 | 10.3% | 2.2%(+8.06)#23 | 2.1%(+8.11)#735 |
| 24. | 62643 | 10.1% | 2.2%(+7.92)#24 | 2.1%(+7.97)#751 |
| 25. | 62510 | 10.0% | 2.2%(+7.78)#25 | 2.1%(+7.82)#769 |
| 26. | 62242 | 9.9% | 2.2%(+7.72)#26 | 2.1%(+7.77)#779 |
| 27. | 61771 | 9.7% | 2.2%(+7.54)#27 | 2.1%(+7.58)#800 |
| 28. | 62207 | 9.7% | 2.2%(+7.54)#28 | 2.1%(+7.58)#802 |
| 29. | 62378 | 9.5% | 2.2%(+7.28)#29 | 2.1%(+7.33)#844 |
| 30. | 62543 | 9.1% | 2.2%(+6.90)#30 | 2.1%(+6.94)#891 |
| 31. | 62997 | 9.0% | 2.2%(+6.84)#31 | 2.1%(+6.88)#909 |
| 32. | 62807 | 9.0% | 2.2%(+6.77)#32 | 2.1%(+6.82)#922 |
| 33. | 62363 | 8.8% | 2.2%(+6.61)#33 | 2.1%(+6.66)#951 |
| 34. | 60088 | 8.6% | 2.2%(+6.41)#34 | 2.1%(+6.45)#985 |
| 35. | 61251 | 8.5% | 2.2%(+6.27)#35 | 2.1%(+6.31)#1,023 |
| 36. | 62883 | 8.4% | 2.2%(+6.22)#36 | 2.1%(+6.27)#1,033 |
| 37. | 60643 | 8.2% | 2.2%(+6.03)#37 | 2.1%(+6.07)#1,091 |
| 38. | 60620 | 8.2% | 2.2%(+6.00)#38 | 2.1%(+6.04)#1,099 |
| 39. | 61340 | 8.1% | 2.2%(+5.92)#39 | 2.1%(+5.96)#1,126 |
| 40. | 61477 | 8.1% | 2.2%(+5.89)#40 | 2.1%(+5.93)#1,137 |
| 41. | 61539 | 8.1% | 2.2%(+5.87)#41 | 2.1%(+5.92)#1,145 |
| 42. | 61447 | 8.0% | 2.2%(+5.82)#42 | 2.1%(+5.86)#1,166 |
| 43. | 62078 | 8.0% | 2.2%(+5.81)#43 | 2.1%(+5.85)#1,171 |
| 44. | 62939 | 8.0% | 2.2%(+5.79)#44 | 2.1%(+5.83)#1,177 |
| 45. | 62956 | 8.0% | 2.2%(+5.77)#45 | 2.1%(+5.81)#1,182 |
| 46. | 61277 | 7.9% | 2.2%(+5.72)#46 | 2.1%(+5.76)#1,199 |
| 47. | 62546 | 7.9% | 2.2%(+5.68)#47 | 2.1%(+5.72)#1,216 |
| 48. | 62436 | 7.8% | 2.2%(+5.60)#48 | 2.1%(+5.64)#1,242 |
| 49. | 62943 | 7.7% | 2.2%(+5.50)#49 | 2.1%(+5.54)#1,268 |
| 50. | 61346 | 7.7% | 2.2%(+5.50)#50 | 2.1%(+5.54)#1,270 |
| 51. | 62274 | 7.6% | 2.2%(+5.43)#51 | 2.1%(+5.48)#1,285 |
| 52. | 62272 | 7.5% | 2.2%(+5.33)#52 | 2.1%(+5.37)#1,325 |
| 53. | 62084 | 7.5% | 2.2%(+5.28)#53 | 2.1%(+5.32)#1,345 |
| 54. | 62922 | 7.3% | 2.2%(+5.08)#54 | 2.1%(+5.12)#1,411 |
| 55. | 62987 | 7.2% | 2.2%(+5.05)#55 | 2.1%(+5.09)#1,428 |
| 56. | 62553 | 7.2% | 2.2%(+5.02)#56 | 2.1%(+5.07)#1,433 |
| 57. | 61754 | 7.1% | 2.2%(+4.94)#57 | 2.1%(+4.98)#1,479 |
| 58. | 61454 | 7.1% | 2.2%(+4.91)#58 | 2.1%(+4.96)#1,489 |
| 59. | 62610 | 7.0% | 2.2%(+4.83)#59 | 2.1%(+4.87)#1,524 |
| 60. | 62932 | 7.0% | 2.2%(+4.77)#60 | 2.1%(+4.82)#1,550 |
| 61. | 62983 | 6.9% | 2.2%(+4.75)#61 | 2.1%(+4.80)#1,557 |
| 62. | 62471 | 6.9% | 2.2%(+4.75)#62 | 2.1%(+4.79)#1,559 |
| 63. | 62535 | 6.9% | 2.2%(+4.74)#63 | 2.1%(+4.78)#1,564 |
| 64. | 62431 | 6.9% | 2.2%(+4.70)#64 | 2.1%(+4.75)#1,580 |
| 65. | 60437 | 6.9% | 2.2%(+4.70)#65 | 2.1%(+4.75)#1,584 |
| 66. | 62995 | 6.9% | 2.2%(+4.69)#66 | 2.1%(+4.73)#1,592 |
| 67. | 62334 | 6.8% | 2.2%(+4.66)#67 | 2.1%(+4.70)#1,609 |
| 68. | 60638 | 6.8% | 2.2%(+4.57)#68 | 2.1%(+4.62)#1,649 |
| 69. | 60656 | 6.8% | 2.2%(+4.57)#69 | 2.1%(+4.61)#1,654 |
| 70. | 60628 | 6.7% | 2.2%(+4.51)#70 | 2.1%(+4.55)#1,685 |
| 71. | 60636 | 6.6% | 2.2%(+4.44)#71 | 2.1%(+4.49)#1,721 |
| 72. | 62920 | 6.5% | 2.2%(+4.31)#72 | 2.1%(+4.35)#1,783 |
| 73. | 60644 | 6.4% | 2.2%(+4.23)#73 | 2.1%(+4.28)#1,816 |
| 74. | 61065 | 6.4% | 2.2%(+4.23)#74 | 2.1%(+4.27)#1,820 |
| 75. | 61039 | 6.4% | 2.2%(+4.22)#75 | 2.1%(+4.26)#1,824 |
| 76. | 61011 | 6.3% | 2.2%(+4.13)#76 | 2.1%(+4.18)#1,887 |
| 77. | 62015 | 6.3% | 2.2%(+4.08)#77 | 2.1%(+4.12)#1,912 |
| 78. | 62905 | 6.2% | 2.2%(+3.98)#78 | 2.1%(+4.02)#1,968 |
| 79. | 62666 | 6.2% | 2.2%(+3.98)#79 | 2.1%(+4.02)#1,969 |
| 80. | 61348 | 6.1% | 2.2%(+3.93)#80 | 2.1%(+3.97)#2,000 |
| 81. | 60155 | 6.1% | 2.2%(+3.88)#81 | 2.1%(+3.93)#2,030 |
| 82. | 62856 | 6.0% | 2.2%(+3.81)#82 | 2.1%(+3.85)#2,081 |
| 83. | 62051 | 6.0% | 2.2%(+3.80)#83 | 2.1%(+3.84)#2,086 |
| 84. | 60619 | 5.9% | 2.2%(+3.75)#84 | 2.1%(+3.80)#2,117 |
| 85. | 61362 | 5.8% | 2.2%(+3.65)#85 | 2.1%(+3.70)#2,180 |
| 86. | 62205 | 5.8% | 2.2%(+3.58)#86 | 2.1%(+3.63)#2,231 |
| 87. | 62362 | 5.8% | 2.2%(+3.56)#87 | 2.1%(+3.61)#2,247 |
| 88. | 61535 | 5.7% | 2.2%(+3.56)#88 | 2.1%(+3.60)#2,251 |
| 89. | 60180 | 5.7% | 2.2%(+3.55)#89 | 2.1%(+3.59)#2,256 |
| 90. | 62712 | 5.7% | 2.2%(+3.55)#90 | 2.1%(+3.59)#2,260 |
| 91. | 62919 | 5.7% | 2.2%(+3.49)#91 | 2.1%(+3.53)#2,298 |
| 92. | 60646 | 5.7% | 2.2%(+3.48)#92 | 2.1%(+3.53)#2,303 |
| 93. | 62688 | 5.7% | 2.2%(+3.47)#93 | 2.1%(+3.51)#2,316 |
| 94. | 62626 | 5.6% | 2.2%(+3.46)#94 | 2.1%(+3.50)#2,325 |
| 95. | 61064 | 5.6% | 2.2%(+3.44)#95 | 2.1%(+3.49)#2,341 |
| 96. | 62280 | 5.6% | 2.2%(+3.43)#96 | 2.1%(+3.47)#2,357 |
| 97. | 61462 | 5.6% | 2.2%(+3.40)#97 | 2.1%(+3.44)#2,376 |
| 98. | 60649 | 5.6% | 2.2%(+3.39)#98 | 2.1%(+3.43)#2,383 |
| 99. | 60512 | 5.6% | 2.2%(+3.39)#99 | 2.1%(+3.43)#2,384 |
| 100. | 62548 | 5.5% | 2.2%(+3.33)#100 | 2.1%(+3.38)#2,432 |
Common Questions
What are the Top 10 Zip Codes with the Highest Percentage of Population Employed in Security & Protection in Illinois?
Top 10 Zip Codes with the Highest Percentage of Population Employed in Security & Protection in Illinois are:
What zip code has the Highest Percentage of Population Employed in Security & Protection in Illinois?
60141 has the Highest Percentage of Population Employed in Security & Protection in Illinois with 100.0%.
What is the Percentage of Population Employed in Security & Protection in the State of Illinois?
Percentage of Population Employed in Security & Protection in Illinois is 2.2%.
What is the Percentage of Population Employed in Security & Protection in the United States?
Percentage of Population Employed in Security & Protection in the United States is 2.1%.