Zip Codes with the Highest Percentage of Population Employed in Security & Protection in Wisconsin
RELATED REPORTS & OPTIONS
Security & Protection
Wisconsin
Compare Zip Codes
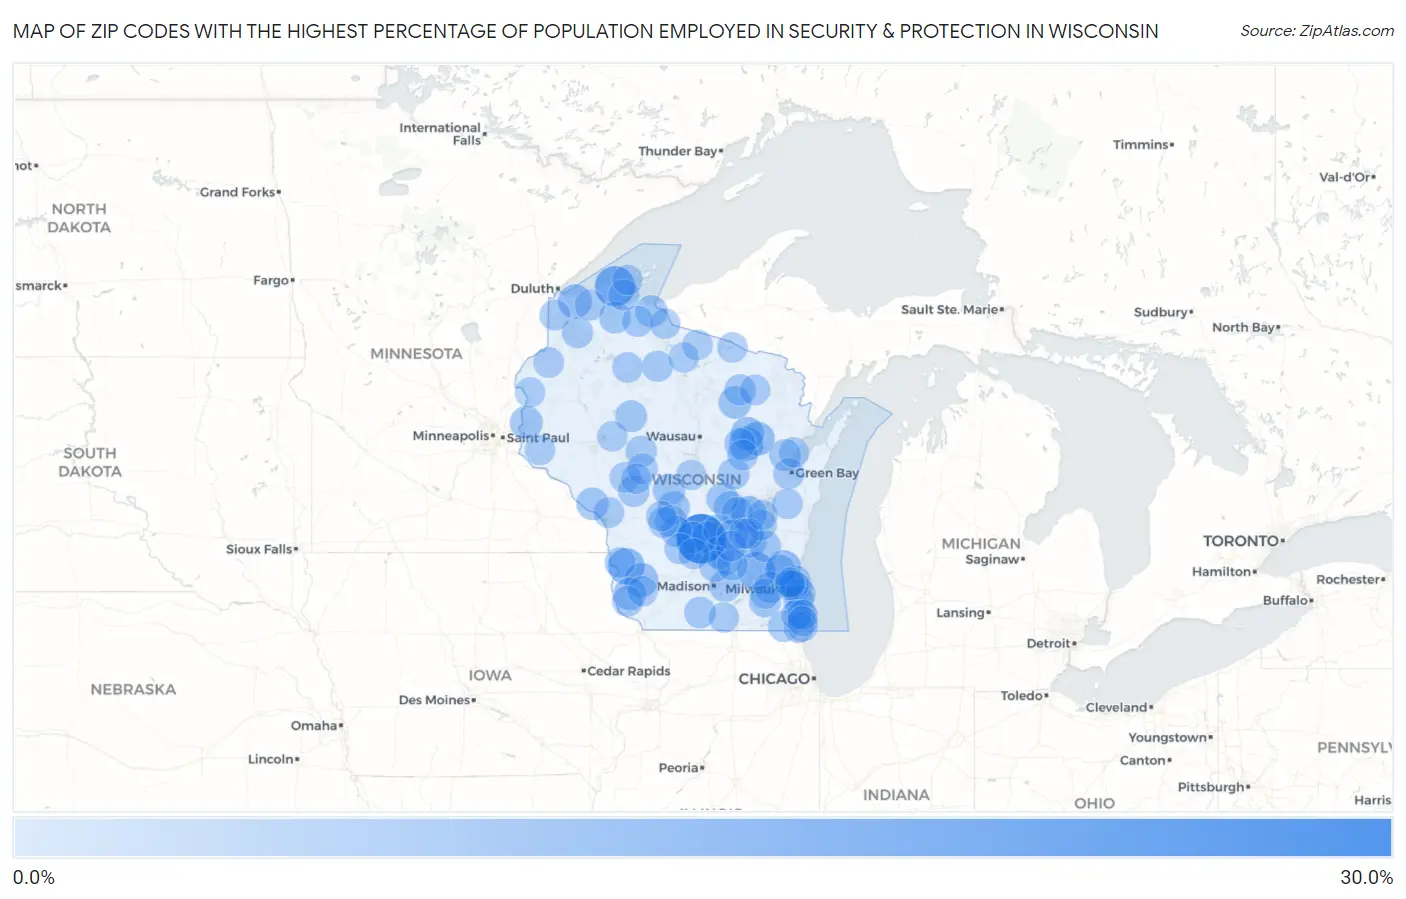
Map of Zip Codes with the Highest Percentage of Population Employed in Security & Protection in Wisconsin
0.0%
30.0%
Zip Codes with the Highest Percentage of Population Employed in Security & Protection in Wisconsin
| Zip Code | % Employed | vs State | vs National | |
| 1. | 53920 | 28.4% | 1.6%(+26.8)#1 | 2.1%(+26.3)#106 |
| 2. | 54827 | 15.8% | 1.6%(+14.2)#2 | 2.1%(+13.7)#326 |
| 3. | 53047 | 12.5% | 1.6%(+10.9)#3 | 2.1%(+10.4)#507 |
| 4. | 54645 | 10.6% | 1.6%(+9.00)#4 | 2.1%(+8.49)#688 |
| 5. | 54980 | 9.0% | 1.6%(+7.37)#5 | 2.1%(+6.85)#914 |
| 6. | 53037 | 8.2% | 1.6%(+6.54)#6 | 2.1%(+6.02)#1,104 |
| 7. | 54128 | 7.8% | 1.6%(+6.17)#7 | 2.1%(+5.66)#1,238 |
| 8. | 54135 | 7.6% | 1.6%(+6.00)#8 | 2.1%(+5.49)#1,282 |
| 9. | 54864 | 7.5% | 1.6%(+5.89)#9 | 2.1%(+5.38)#1,322 |
| 10. | 53805 | 7.5% | 1.6%(+5.88)#10 | 2.1%(+5.36)#1,330 |
| 11. | 54150 | 7.0% | 1.6%(+5.35)#11 | 2.1%(+4.84)#1,536 |
| 12. | 53963 | 6.4% | 1.6%(+4.74)#12 | 2.1%(+4.23)#1,842 |
| 13. | 54025 | 6.1% | 1.6%(+4.51)#13 | 2.1%(+3.99)#1,989 |
| 14. | 54462 | 5.7% | 1.6%(+4.04)#14 | 2.1%(+3.53)#2,304 |
| 15. | 53816 | 5.5% | 1.6%(+3.87)#15 | 2.1%(+3.35)#2,457 |
| 16. | 54625 | 5.3% | 1.6%(+3.68)#16 | 2.1%(+3.17)#2,619 |
| 17. | 53930 | 5.2% | 1.6%(+3.55)#17 | 2.1%(+3.03)#2,726 |
| 18. | 54646 | 5.2% | 1.6%(+3.52)#18 | 2.1%(+3.00)#2,761 |
| 19. | 54413 | 5.1% | 1.6%(+3.42)#19 | 2.1%(+2.90)#2,867 |
| 20. | 54559 | 5.0% | 1.6%(+3.40)#20 | 2.1%(+2.89)#2,881 |
| 21. | 54970 | 4.9% | 1.6%(+3.32)#21 | 2.1%(+2.80)#2,983 |
| 22. | 53119 | 4.8% | 1.6%(+3.19)#22 | 2.1%(+2.68)#3,150 |
| 23. | 54984 | 4.8% | 1.6%(+3.18)#23 | 2.1%(+2.67)#3,162 |
| 24. | 53969 | 4.7% | 1.6%(+3.09)#24 | 2.1%(+2.58)#3,269 |
| 25. | 53950 | 4.7% | 1.6%(+3.04)#25 | 2.1%(+2.52)#3,338 |
| 26. | 53048 | 4.6% | 1.6%(+2.99)#26 | 2.1%(+2.48)#3,396 |
| 27. | 54433 | 4.6% | 1.6%(+2.96)#27 | 2.1%(+2.44)#3,460 |
| 28. | 53209 | 4.6% | 1.6%(+2.95)#28 | 2.1%(+2.44)#3,472 |
| 29. | 53928 | 4.5% | 1.6%(+2.91)#29 | 2.1%(+2.40)#3,538 |
| 30. | 54856 | 4.5% | 1.6%(+2.88)#30 | 2.1%(+2.37)#3,586 |
| 31. | 54171 | 4.4% | 1.6%(+2.77)#31 | 2.1%(+2.26)#3,763 |
| 32. | 53570 | 4.3% | 1.6%(+2.71)#32 | 2.1%(+2.20)#3,871 |
| 33. | 53527 | 4.3% | 1.6%(+2.68)#33 | 2.1%(+2.17)#3,921 |
| 34. | 54962 | 4.2% | 1.6%(+2.60)#34 | 2.1%(+2.08)#4,064 |
| 35. | 53018 | 4.2% | 1.6%(+2.55)#35 | 2.1%(+2.03)#4,159 |
| 36. | 54615 | 4.1% | 1.6%(+2.51)#36 | 2.1%(+2.00)#4,213 |
| 37. | 54416 | 4.1% | 1.6%(+2.47)#37 | 2.1%(+1.96)#4,282 |
| 38. | 53965 | 4.1% | 1.6%(+2.44)#38 | 2.1%(+1.93)#4,345 |
| 39. | 54923 | 4.1% | 1.6%(+2.42)#39 | 2.1%(+1.90)#4,394 |
| 40. | 53205 | 4.0% | 1.6%(+2.41)#40 | 2.1%(+1.90)#4,408 |
| 41. | 54520 | 4.0% | 1.6%(+2.33)#41 | 2.1%(+1.81)#4,570 |
| 42. | 53170 | 4.0% | 1.6%(+2.32)#42 | 2.1%(+1.81)#4,582 |
| 43. | 53911 | 3.9% | 1.6%(+2.31)#43 | 2.1%(+1.79)#4,603 |
| 44. | 53949 | 3.9% | 1.6%(+2.22)#44 | 2.1%(+1.71)#4,786 |
| 45. | 54838 | 3.8% | 1.6%(+2.18)#45 | 2.1%(+1.67)#4,870 |
| 46. | 54846 | 3.8% | 1.6%(+2.16)#46 | 2.1%(+1.64)#4,924 |
| 47. | 53948 | 3.8% | 1.6%(+2.16)#47 | 2.1%(+1.64)#4,930 |
| 48. | 54437 | 3.8% | 1.6%(+2.14)#48 | 2.1%(+1.62)#4,974 |
| 49. | 53946 | 3.8% | 1.6%(+2.12)#49 | 2.1%(+1.61)#5,015 |
| 50. | 54524 | 3.7% | 1.6%(+2.05)#50 | 2.1%(+1.53)#5,192 |
| 51. | 54891 | 3.6% | 1.6%(+2.01)#51 | 2.1%(+1.50)#5,281 |
| 52. | 53235 | 3.6% | 1.6%(+1.95)#52 | 2.1%(+1.44)#5,432 |
| 53. | 53925 | 3.6% | 1.6%(+1.92)#53 | 2.1%(+1.40)#5,535 |
| 54. | 54304 | 3.5% | 1.6%(+1.91)#54 | 2.1%(+1.40)#5,551 |
| 55. | 53959 | 3.5% | 1.6%(+1.90)#55 | 2.1%(+1.38)#5,597 |
| 56. | 53406 | 3.5% | 1.6%(+1.89)#56 | 2.1%(+1.38)#5,614 |
| 57. | 54637 | 3.5% | 1.6%(+1.85)#57 | 2.1%(+1.34)#5,702 |
| 58. | 53076 | 3.4% | 1.6%(+1.79)#58 | 2.1%(+1.28)#5,860 |
| 59. | 54820 | 3.4% | 1.6%(+1.75)#59 | 2.1%(+1.23)#5,999 |
| 60. | 54636 | 3.4% | 1.6%(+1.74)#60 | 2.1%(+1.23)#6,009 |
| 61. | 54928 | 3.4% | 1.6%(+1.72)#61 | 2.1%(+1.20)#6,086 |
| 62. | 53143 | 3.3% | 1.6%(+1.70)#62 | 2.1%(+1.19)#6,140 |
| 63. | 53158 | 3.3% | 1.6%(+1.68)#63 | 2.1%(+1.16)#6,213 |
| 64. | 54611 | 3.2% | 1.6%(+1.60)#64 | 2.1%(+1.09)#6,443 |
| 65. | 53913 | 3.2% | 1.6%(+1.59)#65 | 2.1%(+1.08)#6,468 |
| 66. | 53804 | 3.2% | 1.6%(+1.54)#66 | 2.1%(+1.03)#6,605 |
| 67. | 54836 | 3.1% | 1.6%(+1.51)#67 | 2.1%(+0.998)#6,713 |
| 68. | 53154 | 3.1% | 1.6%(+1.50)#68 | 2.1%(+0.982)#6,772 |
| 69. | 54893 | 3.1% | 1.6%(+1.49)#69 | 2.1%(+0.973)#6,816 |
| 70. | 54979 | 3.1% | 1.6%(+1.48)#70 | 2.1%(+0.970)#6,824 |
| 71. | 54456 | 3.1% | 1.6%(+1.45)#71 | 2.1%(+0.938)#6,929 |
| 72. | 53935 | 3.1% | 1.6%(+1.44)#72 | 2.1%(+0.929)#6,971 |
| 73. | 53919 | 3.0% | 1.6%(+1.40)#73 | 2.1%(+0.887)#7,089 |
| 74. | 54754 | 3.0% | 1.6%(+1.36)#74 | 2.1%(+0.842)#7,264 |
| 75. | 54160 | 3.0% | 1.6%(+1.35)#75 | 2.1%(+0.837)#7,289 |
| 76. | 53216 | 3.0% | 1.6%(+1.34)#76 | 2.1%(+0.824)#7,333 |
| 77. | 54628 | 3.0% | 1.6%(+1.33)#77 | 2.1%(+0.817)#7,365 |
| 78. | 54541 | 3.0% | 1.6%(+1.32)#78 | 2.1%(+0.803)#7,427 |
| 79. | 54896 | 2.9% | 1.6%(+1.30)#79 | 2.1%(+0.781)#7,514 |
| 80. | 54727 | 2.9% | 1.6%(+1.28)#80 | 2.1%(+0.767)#7,580 |
| 81. | 53931 | 2.9% | 1.6%(+1.26)#81 | 2.1%(+0.742)#7,691 |
| 82. | 54902 | 2.9% | 1.6%(+1.24)#82 | 2.1%(+0.730)#7,733 |
| 83. | 54512 | 2.9% | 1.6%(+1.23)#83 | 2.1%(+0.712)#7,818 |
| 84. | 54554 | 2.9% | 1.6%(+1.22)#84 | 2.1%(+0.703)#7,858 |
| 85. | 54618 | 2.8% | 1.6%(+1.20)#85 | 2.1%(+0.685)#7,947 |
| 86. | 53177 | 2.8% | 1.6%(+1.19)#86 | 2.1%(+0.680)#7,985 |
| 87. | 54475 | 2.8% | 1.6%(+1.18)#87 | 2.1%(+0.668)#8,037 |
| 88. | 53403 | 2.8% | 1.6%(+1.17)#88 | 2.1%(+0.658)#8,089 |
| 89. | 54814 | 2.8% | 1.6%(+1.17)#89 | 2.1%(+0.656)#8,096 |
| 90. | 54538 | 2.8% | 1.6%(+1.16)#90 | 2.1%(+0.642)#8,151 |
| 91. | 53118 | 2.8% | 1.6%(+1.14)#91 | 2.1%(+0.627)#8,222 |
| 92. | 54534 | 2.8% | 1.6%(+1.13)#92 | 2.1%(+0.617)#8,257 |
| 93. | 53222 | 2.8% | 1.6%(+1.13)#93 | 2.1%(+0.615)#8,265 |
| 94. | 53537 | 2.8% | 1.6%(+1.12)#94 | 2.1%(+0.604)#8,304 |
| 95. | 54141 | 2.7% | 1.6%(+1.12)#95 | 2.1%(+0.601)#8,317 |
| 96. | 54024 | 2.7% | 1.6%(+1.09)#96 | 2.1%(+0.575)#8,421 |
| 97. | 53809 | 2.7% | 1.6%(+1.07)#97 | 2.1%(+0.554)#8,515 |
| 98. | 53140 | 2.7% | 1.6%(+1.05)#98 | 2.1%(+0.533)#8,622 |
| 99. | 54003 | 2.7% | 1.6%(+1.04)#99 | 2.1%(+0.530)#8,637 |
| 100. | 53225 | 2.6% | 1.6%(+1.01)#100 | 2.1%(+0.499)#8,782 |
Common Questions
What are the Top 10 Zip Codes with the Highest Percentage of Population Employed in Security & Protection in Wisconsin?
Top 10 Zip Codes with the Highest Percentage of Population Employed in Security & Protection in Wisconsin are:
What zip code has the Highest Percentage of Population Employed in Security & Protection in Wisconsin?
53920 has the Highest Percentage of Population Employed in Security & Protection in Wisconsin with 28.4%.
What is the Percentage of Population Employed in Security & Protection in the State of Wisconsin?
Percentage of Population Employed in Security & Protection in Wisconsin is 1.6%.
What is the Percentage of Population Employed in Security & Protection in the United States?
Percentage of Population Employed in Security & Protection in the United States is 2.1%.