Zip Codes with the Highest Percentage of Population Employed in Security & Protection in Minnesota
RELATED REPORTS & OPTIONS
Security & Protection
Minnesota
Compare Zip Codes
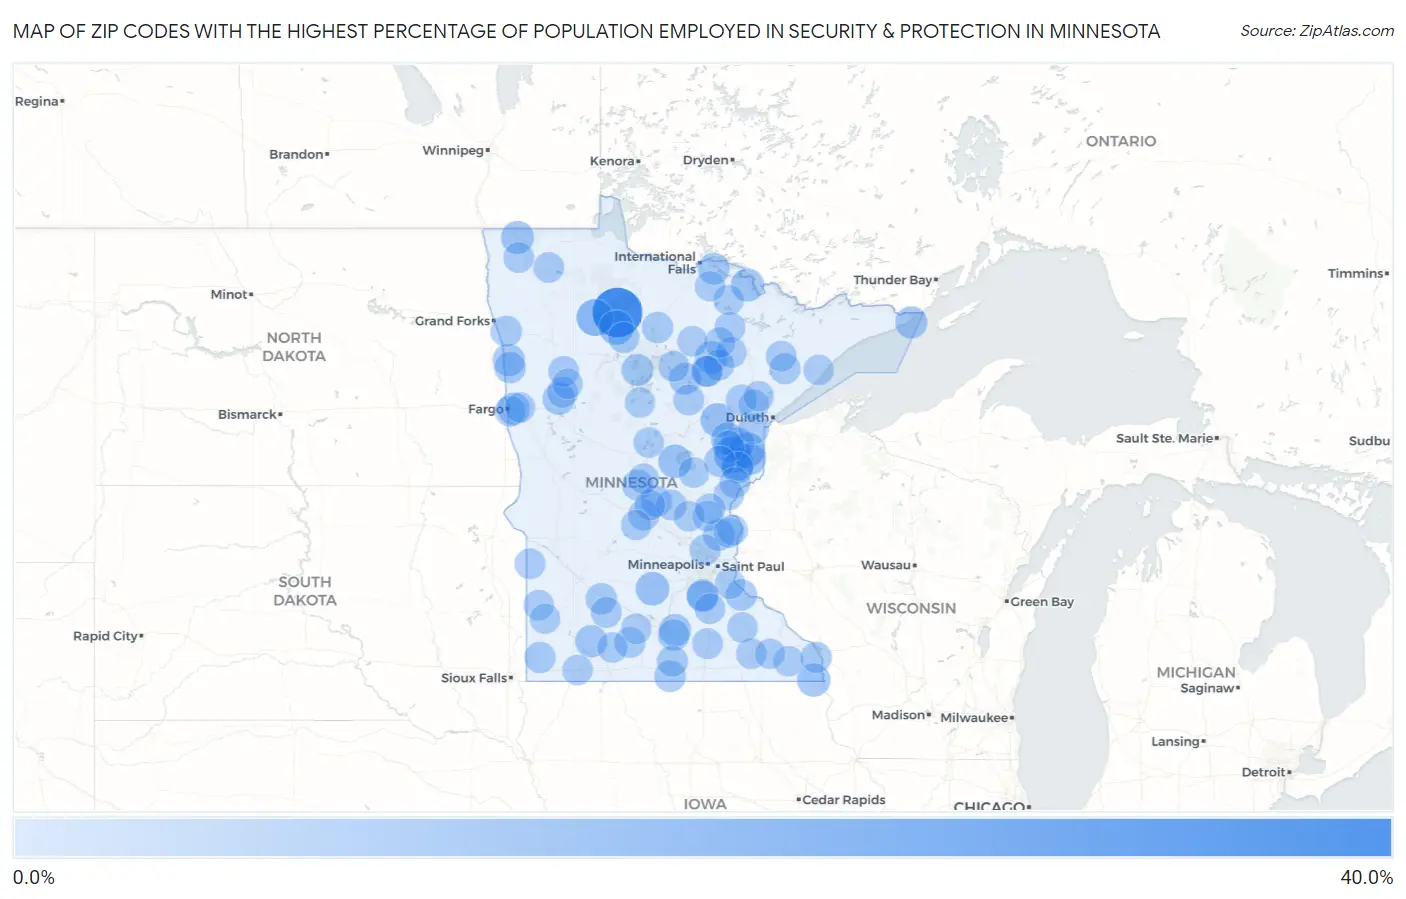
Map of Zip Codes with the Highest Percentage of Population Employed in Security & Protection in Minnesota
0.0%
40.0%
Zip Codes with the Highest Percentage of Population Employed in Security & Protection in Minnesota
| Zip Code | % Employed | vs State | vs National | |
| 1. | 56666 | 33.9% | 1.3%(+32.6)#1 | 2.1%(+31.8)#75 |
| 2. | 56671 | 12.7% | 1.3%(+11.4)#2 | 2.1%(+10.5)#495 |
| 3. | 55795 | 12.1% | 1.3%(+10.8)#3 | 2.1%(+9.99)#541 |
| 4. | 55756 | 9.6% | 1.3%(+8.30)#4 | 2.1%(+7.47)#816 |
| 5. | 56670 | 9.2% | 1.3%(+7.90)#5 | 2.1%(+7.07)#875 |
| 6. | 55787 | 7.9% | 1.3%(+6.61)#6 | 2.1%(+5.78)#1,191 |
| 7. | 55366 | 7.6% | 1.3%(+6.25)#7 | 2.1%(+5.42)#1,305 |
| 8. | 55704 | 7.5% | 1.3%(+6.16)#8 | 2.1%(+5.33)#1,343 |
| 9. | 56450 | 7.3% | 1.3%(+5.94)#9 | 2.1%(+5.11)#1,419 |
| 10. | 55767 | 7.1% | 1.3%(+5.73)#10 | 2.1%(+4.90)#1,511 |
| 11. | 55931 | 7.0% | 1.3%(+5.69)#11 | 2.1%(+4.86)#1,528 |
| 12. | 55725 | 6.7% | 1.3%(+5.35)#12 | 2.1%(+4.52)#1,711 |
| 13. | 56735 | 6.5% | 1.3%(+5.17)#13 | 2.1%(+4.34)#1,787 |
| 14. | 55757 | 6.4% | 1.3%(+5.08)#14 | 2.1%(+4.25)#1,828 |
| 15. | 55769 | 5.9% | 1.3%(+4.61)#15 | 2.1%(+3.78)#2,130 |
| 16. | 56174 | 5.5% | 1.3%(+4.14)#16 | 2.1%(+3.31)#2,489 |
| 17. | 56521 | 5.4% | 1.3%(+4.12)#17 | 2.1%(+3.29)#2,498 |
| 18. | 55712 | 5.4% | 1.3%(+4.12)#18 | 2.1%(+3.29)#2,500 |
| 19. | 56529 | 5.4% | 1.3%(+4.09)#19 | 2.1%(+3.26)#2,537 |
| 20. | 56581 | 5.3% | 1.3%(+4.02)#20 | 2.1%(+3.20)#2,594 |
| 21. | 55605 | 5.3% | 1.3%(+3.96)#21 | 2.1%(+3.13)#2,649 |
| 22. | 55721 | 5.1% | 1.3%(+3.73)#22 | 2.1%(+2.90)#2,859 |
| 23. | 56024 | 5.0% | 1.3%(+3.70)#23 | 2.1%(+2.87)#2,908 |
| 24. | 56633 | 5.0% | 1.3%(+3.66)#24 | 2.1%(+2.83)#2,951 |
| 25. | 55092 | 4.5% | 1.3%(+3.20)#25 | 2.1%(+2.37)#3,578 |
| 26. | 55783 | 4.5% | 1.3%(+3.17)#26 | 2.1%(+2.34)#3,631 |
| 27. | 56548 | 4.4% | 1.3%(+3.11)#27 | 2.1%(+2.28)#3,723 |
| 28. | 55072 | 4.4% | 1.3%(+3.08)#28 | 2.1%(+2.25)#3,773 |
| 29. | 56649 | 4.4% | 1.3%(+3.06)#29 | 2.1%(+2.23)#3,802 |
| 30. | 55020 | 4.3% | 1.3%(+2.99)#30 | 2.1%(+2.16)#3,932 |
| 31. | 56080 | 4.3% | 1.3%(+2.96)#31 | 2.1%(+2.13)#3,982 |
| 32. | 55089 | 4.2% | 1.3%(+2.92)#32 | 2.1%(+2.09)#4,050 |
| 33. | 56033 | 4.1% | 1.3%(+2.80)#33 | 2.1%(+1.98)#4,258 |
| 34. | 55054 | 4.1% | 1.3%(+2.76)#34 | 2.1%(+1.93)#4,339 |
| 35. | 55735 | 3.9% | 1.3%(+2.62)#35 | 2.1%(+1.79)#4,613 |
| 36. | 56661 | 3.9% | 1.3%(+2.60)#36 | 2.1%(+1.77)#4,647 |
| 37. | 55764 | 3.8% | 1.3%(+2.53)#37 | 2.1%(+1.70)#4,814 |
| 38. | 56283 | 3.8% | 1.3%(+2.49)#38 | 2.1%(+1.66)#4,884 |
| 39. | 56723 | 3.8% | 1.3%(+2.45)#39 | 2.1%(+1.62)#4,987 |
| 40. | 56321 | 3.8% | 1.3%(+2.43)#40 | 2.1%(+1.60)#5,025 |
| 41. | 56134 | 3.7% | 1.3%(+2.38)#41 | 2.1%(+1.56)#5,141 |
| 42. | 56367 | 3.7% | 1.3%(+2.37)#42 | 2.1%(+1.54)#5,176 |
| 43. | 55947 | 3.6% | 1.3%(+2.30)#43 | 2.1%(+1.47)#5,368 |
| 44. | 55602 | 3.5% | 1.3%(+2.22)#44 | 2.1%(+1.39)#5,573 |
| 45. | 56683 | 3.5% | 1.3%(+2.22)#45 | 2.1%(+1.39)#5,583 |
| 46. | 56025 | 3.5% | 1.3%(+2.17)#46 | 2.1%(+1.34)#5,700 |
| 47. | 55753 | 3.5% | 1.3%(+2.17)#47 | 2.1%(+1.34)#5,707 |
| 48. | 56328 | 3.4% | 1.3%(+2.05)#48 | 2.1%(+1.22)#6,021 |
| 49. | 56224 | 3.2% | 1.3%(+1.91)#49 | 2.1%(+1.08)#6,479 |
| 50. | 55750 | 3.2% | 1.3%(+1.87)#50 | 2.1%(+1.04)#6,579 |
| 51. | 56081 | 3.2% | 1.3%(+1.87)#51 | 2.1%(+1.04)#6,589 |
| 52. | 55702 | 3.1% | 1.3%(+1.82)#52 | 2.1%(+0.993)#6,730 |
| 53. | 56636 | 3.1% | 1.3%(+1.82)#53 | 2.1%(+0.992)#6,732 |
| 54. | 55716 | 3.1% | 1.3%(+1.77)#54 | 2.1%(+0.944)#6,911 |
| 55. | 55037 | 3.1% | 1.3%(+1.76)#55 | 2.1%(+0.935)#6,942 |
| 56. | 56569 | 3.1% | 1.3%(+1.76)#56 | 2.1%(+0.931)#6,960 |
| 57. | 56046 | 3.1% | 1.3%(+1.76)#57 | 2.1%(+0.929)#6,972 |
| 58. | 55718 | 3.1% | 1.3%(+1.75)#58 | 2.1%(+0.921)#6,989 |
| 59. | 56557 | 3.0% | 1.3%(+1.71)#59 | 2.1%(+0.876)#7,130 |
| 60. | 56257 | 3.0% | 1.3%(+1.67)#60 | 2.1%(+0.846)#7,251 |
| 61. | 55748 | 3.0% | 1.3%(+1.67)#61 | 2.1%(+0.842)#7,262 |
| 62. | 56329 | 3.0% | 1.3%(+1.65)#62 | 2.1%(+0.821)#7,346 |
| 63. | 55433 | 2.9% | 1.3%(+1.62)#63 | 2.1%(+0.791)#7,479 |
| 64. | 55045 | 2.9% | 1.3%(+1.60)#64 | 2.1%(+0.769)#7,572 |
| 65. | 56729 | 2.9% | 1.3%(+1.58)#65 | 2.1%(+0.750)#7,651 |
| 66. | 55719 | 2.9% | 1.3%(+1.56)#66 | 2.1%(+0.728)#7,747 |
| 67. | 55723 | 2.9% | 1.3%(+1.55)#67 | 2.1%(+0.724)#7,768 |
| 68. | 56560 | 2.8% | 1.3%(+1.51)#68 | 2.1%(+0.678)#7,991 |
| 69. | 56759 | 2.8% | 1.3%(+1.51)#69 | 2.1%(+0.676)#7,999 |
| 70. | 55371 | 2.8% | 1.3%(+1.46)#70 | 2.1%(+0.634)#8,182 |
| 71. | 55063 | 2.8% | 1.3%(+1.46)#71 | 2.1%(+0.633)#8,186 |
| 72. | 55019 | 2.8% | 1.3%(+1.44)#72 | 2.1%(+0.613)#8,271 |
| 73. | 56375 | 2.7% | 1.3%(+1.42)#73 | 2.1%(+0.594)#8,339 |
| 74. | 55781 | 2.7% | 1.3%(+1.38)#74 | 2.1%(+0.554)#8,518 |
| 75. | 55976 | 2.7% | 1.3%(+1.38)#75 | 2.1%(+0.551)#8,536 |
| 76. | 56589 | 2.7% | 1.3%(+1.35)#76 | 2.1%(+0.516)#8,695 |
| 77. | 56041 | 2.7% | 1.3%(+1.34)#77 | 2.1%(+0.513)#8,708 |
| 78. | 56628 | 2.6% | 1.3%(+1.32)#78 | 2.1%(+0.495)#8,804 |
| 79. | 56386 | 2.6% | 1.3%(+1.31)#79 | 2.1%(+0.483)#8,868 |
| 80. | 55008 | 2.6% | 1.3%(+1.30)#80 | 2.1%(+0.474)#8,908 |
| 81. | 56159 | 2.6% | 1.3%(+1.29)#81 | 2.1%(+0.460)#8,966 |
| 82. | 55963 | 2.6% | 1.3%(+1.29)#82 | 2.1%(+0.457)#8,981 |
| 83. | 56187 | 2.6% | 1.3%(+1.28)#83 | 2.1%(+0.446)#9,034 |
| 84. | 56468 | 2.6% | 1.3%(+1.27)#84 | 2.1%(+0.444)#9,043 |
| 85. | 56345 | 2.6% | 1.3%(+1.27)#85 | 2.1%(+0.441)#9,053 |
| 86. | 55033 | 2.6% | 1.3%(+1.26)#86 | 2.1%(+0.432)#9,097 |
| 87. | 55779 | 2.6% | 1.3%(+1.25)#87 | 2.1%(+0.422)#9,149 |
| 88. | 55080 | 2.6% | 1.3%(+1.24)#88 | 2.1%(+0.412)#9,197 |
| 89. | 56142 | 2.5% | 1.3%(+1.21)#89 | 2.1%(+0.378)#9,378 |
| 90. | 55614 | 2.5% | 1.3%(+1.20)#90 | 2.1%(+0.369)#9,424 |
| 91. | 55717 | 2.5% | 1.3%(+1.18)#91 | 2.1%(+0.352)#9,507 |
| 92. | 56368 | 2.5% | 1.3%(+1.18)#92 | 2.1%(+0.348)#9,528 |
| 93. | 55771 | 2.5% | 1.3%(+1.16)#93 | 2.1%(+0.330)#9,628 |
| 94. | 56452 | 2.5% | 1.3%(+1.16)#94 | 2.1%(+0.329)#9,635 |
| 95. | 55962 | 2.5% | 1.3%(+1.14)#95 | 2.1%(+0.311)#9,738 |
| 96. | 56547 | 2.5% | 1.3%(+1.14)#96 | 2.1%(+0.307)#9,757 |
| 97. | 55013 | 2.4% | 1.3%(+1.13)#97 | 2.1%(+0.296)#9,820 |
| 98. | 55923 | 2.4% | 1.3%(+1.12)#98 | 2.1%(+0.295)#9,834 |
| 99. | 56669 | 2.4% | 1.3%(+1.12)#99 | 2.1%(+0.291)#9,861 |
| 100. | 56178 | 2.4% | 1.3%(+1.09)#100 | 2.1%(+0.261)#10,012 |
Common Questions
What are the Top 10 Zip Codes with the Highest Percentage of Population Employed in Security & Protection in Minnesota?
Top 10 Zip Codes with the Highest Percentage of Population Employed in Security & Protection in Minnesota are:
What zip code has the Highest Percentage of Population Employed in Security & Protection in Minnesota?
56666 has the Highest Percentage of Population Employed in Security & Protection in Minnesota with 33.9%.
What is the Percentage of Population Employed in Security & Protection in the State of Minnesota?
Percentage of Population Employed in Security & Protection in Minnesota is 1.3%.
What is the Percentage of Population Employed in Security & Protection in the United States?
Percentage of Population Employed in Security & Protection in the United States is 2.1%.