Zip Codes with the Highest Percentage of Population Employed in Security & Protection in Nebraska
RELATED REPORTS & OPTIONS
Security & Protection
Nebraska
Compare Zip Codes
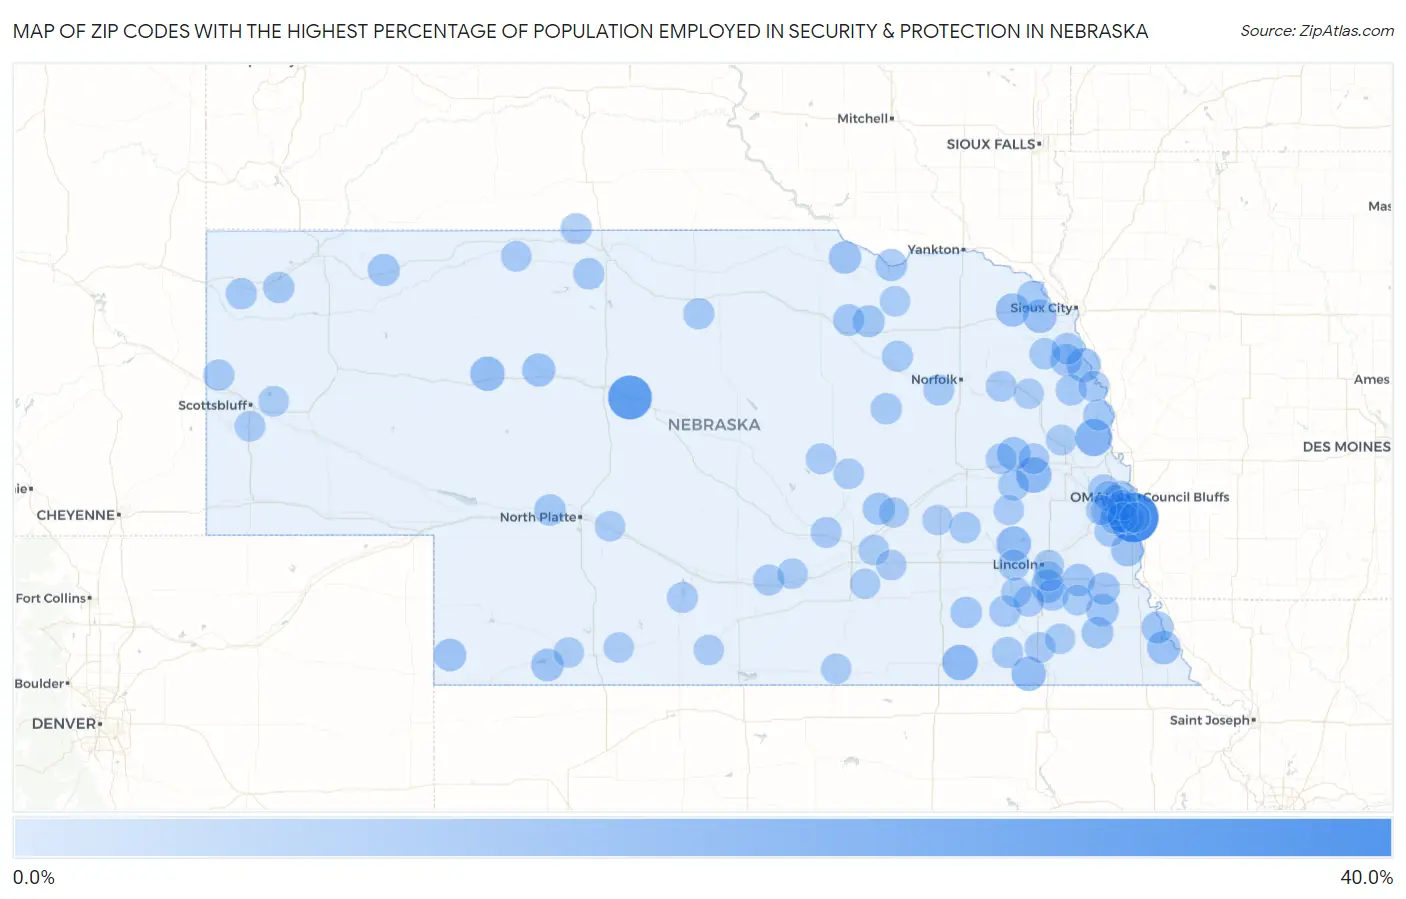
Map of Zip Codes with the Highest Percentage of Population Employed in Security & Protection in Nebraska
0.0%
40.0%
Zip Codes with the Highest Percentage of Population Employed in Security & Protection in Nebraska
| Zip Code | % Employed | vs State | vs National | |
| 1. | 68113 | 31.2% | 1.7%(+29.6)#1 | 2.1%(+29.1)#88 |
| 2. | 69142 | 22.4% | 1.7%(+20.7)#2 | 2.1%(+20.2)#158 |
| 3. | 68029 | 12.4% | 1.7%(+10.7)#3 | 2.1%(+10.2)#519 |
| 4. | 68648 | 10.1% | 1.7%(+8.41)#4 | 2.1%(+7.94)#756 |
| 5. | 68362 | 10.0% | 1.7%(+8.32)#5 | 2.1%(+7.85)#767 |
| 6. | 68360 | 8.8% | 1.7%(+7.08)#6 | 2.1%(+6.61)#961 |
| 7. | 69366 | 8.3% | 1.7%(+6.60)#7 | 2.1%(+6.13)#1,078 |
| 8. | 68415 | 8.1% | 1.7%(+6.47)#8 | 2.1%(+5.99)#1,112 |
| 9. | 68039 | 8.0% | 1.7%(+6.35)#9 | 2.1%(+5.88)#1,158 |
| 10. | 68785 | 7.0% | 1.7%(+5.30)#10 | 2.1%(+4.83)#1,543 |
| 11. | 68437 | 6.8% | 1.7%(+5.10)#11 | 2.1%(+4.63)#1,640 |
| 12. | 68732 | 6.8% | 1.7%(+5.10)#12 | 2.1%(+4.63)#1,641 |
| 13. | 68430 | 6.7% | 1.7%(+4.99)#13 | 2.1%(+4.52)#1,699 |
| 14. | 68659 | 6.6% | 1.7%(+4.88)#14 | 2.1%(+4.41)#1,770 |
| 15. | 69152 | 6.4% | 1.7%(+4.76)#15 | 2.1%(+4.29)#1,813 |
| 16. | 68409 | 6.0% | 1.7%(+4.33)#16 | 2.1%(+3.86)#2,071 |
| 17. | 69044 | 5.7% | 1.7%(+3.99)#17 | 2.1%(+3.52)#2,310 |
| 18. | 68746 | 5.6% | 1.7%(+3.88)#18 | 2.1%(+3.41)#2,412 |
| 19. | 69030 | 5.5% | 1.7%(+3.83)#19 | 2.1%(+3.36)#2,452 |
| 20. | 68329 | 5.4% | 1.7%(+3.75)#20 | 2.1%(+3.28)#2,514 |
| 21. | 68321 | 5.2% | 1.7%(+3.48)#21 | 2.1%(+3.01)#2,757 |
| 22. | 68418 | 5.1% | 1.7%(+3.44)#22 | 2.1%(+2.97)#2,792 |
| 23. | 68446 | 5.0% | 1.7%(+3.34)#23 | 2.1%(+2.87)#2,900 |
| 24. | 68067 | 5.0% | 1.7%(+3.31)#24 | 2.1%(+2.84)#2,939 |
| 25. | 68816 | 4.9% | 1.7%(+3.20)#25 | 2.1%(+2.73)#3,072 |
| 26. | 69360 | 4.8% | 1.7%(+3.15)#26 | 2.1%(+2.68)#3,137 |
| 27. | 68760 | 4.8% | 1.7%(+3.07)#27 | 2.1%(+2.60)#3,235 |
| 28. | 68764 | 4.7% | 1.7%(+3.04)#28 | 2.1%(+2.57)#3,271 |
| 29. | 68450 | 4.6% | 1.7%(+2.88)#29 | 2.1%(+2.41)#3,500 |
| 30. | 68071 | 4.2% | 1.7%(+2.55)#30 | 2.1%(+2.07)#4,083 |
| 31. | 68766 | 4.1% | 1.7%(+2.46)#31 | 2.1%(+1.99)#4,231 |
| 32. | 68406 | 4.0% | 1.7%(+2.36)#32 | 2.1%(+1.89)#4,426 |
| 33. | 69143 | 4.0% | 1.7%(+2.30)#33 | 2.1%(+1.83)#4,544 |
| 34. | 68465 | 3.9% | 1.7%(+2.26)#34 | 2.1%(+1.79)#4,604 |
| 35. | 68372 | 3.9% | 1.7%(+2.22)#35 | 2.1%(+1.75)#4,682 |
| 36. | 68116 | 3.7% | 1.7%(+2.02)#36 | 2.1%(+1.55)#5,155 |
| 37. | 68652 | 3.7% | 1.7%(+2.02)#37 | 2.1%(+1.54)#5,170 |
| 38. | 69201 | 3.7% | 1.7%(+2.00)#38 | 2.1%(+1.53)#5,198 |
| 39. | 69358 | 3.6% | 1.7%(+1.96)#39 | 2.1%(+1.49)#5,308 |
| 40. | 68367 | 3.6% | 1.7%(+1.95)#40 | 2.1%(+1.48)#5,342 |
| 41. | 68062 | 3.6% | 1.7%(+1.91)#41 | 2.1%(+1.44)#5,422 |
| 42. | 68001 | 3.6% | 1.7%(+1.89)#42 | 2.1%(+1.42)#5,480 |
| 43. | 69339 | 3.5% | 1.7%(+1.87)#43 | 2.1%(+1.40)#5,546 |
| 44. | 68061 | 3.5% | 1.7%(+1.86)#44 | 2.1%(+1.39)#5,588 |
| 45. | 69212 | 3.5% | 1.7%(+1.83)#45 | 2.1%(+1.36)#5,649 |
| 46. | 68423 | 3.5% | 1.7%(+1.79)#46 | 2.1%(+1.32)#5,746 |
| 47. | 68377 | 3.5% | 1.7%(+1.79)#47 | 2.1%(+1.32)#5,761 |
| 48. | 69346 | 3.4% | 1.7%(+1.77)#48 | 2.1%(+1.30)#5,810 |
| 49. | 68123 | 3.4% | 1.7%(+1.76)#49 | 2.1%(+1.29)#5,825 |
| 50. | 68038 | 3.4% | 1.7%(+1.68)#50 | 2.1%(+1.21)#6,045 |
| 51. | 69217 | 3.4% | 1.7%(+1.67)#51 | 2.1%(+1.20)#6,087 |
| 52. | 68770 | 3.3% | 1.7%(+1.63)#52 | 2.1%(+1.16)#6,220 |
| 53. | 68849 | 3.3% | 1.7%(+1.61)#53 | 2.1%(+1.14)#6,282 |
| 54. | 68756 | 3.3% | 1.7%(+1.60)#54 | 2.1%(+1.13)#6,322 |
| 55. | 68016 | 3.3% | 1.7%(+1.59)#55 | 2.1%(+1.12)#6,342 |
| 56. | 68715 | 3.2% | 1.7%(+1.47)#56 | 2.1%(+1.00)#6,694 |
| 57. | 68937 | 3.1% | 1.7%(+1.40)#57 | 2.1%(+0.932)#6,957 |
| 58. | 68020 | 3.1% | 1.7%(+1.40)#58 | 2.1%(+0.929)#6,969 |
| 59. | 68768 | 3.0% | 1.7%(+1.35)#59 | 2.1%(+0.882)#7,108 |
| 60. | 68368 | 3.0% | 1.7%(+1.35)#60 | 2.1%(+0.882)#7,110 |
| 61. | 68649 | 3.0% | 1.7%(+1.35)#61 | 2.1%(+0.879)#7,118 |
| 62. | 68824 | 3.0% | 1.7%(+1.33)#62 | 2.1%(+0.862)#7,192 |
| 63. | 68875 | 3.0% | 1.7%(+1.30)#63 | 2.1%(+0.826)#7,324 |
| 64. | 68661 | 2.9% | 1.7%(+1.25)#64 | 2.1%(+0.784)#7,504 |
| 65. | 68182 | 2.9% | 1.7%(+1.25)#65 | 2.1%(+0.777)#7,531 |
| 66. | 68310 | 2.9% | 1.7%(+1.20)#66 | 2.1%(+0.729)#7,739 |
| 67. | 69211 | 2.8% | 1.7%(+1.16)#67 | 2.1%(+0.692)#7,913 |
| 68. | 69341 | 2.8% | 1.7%(+1.16)#68 | 2.1%(+0.684)#7,951 |
| 69. | 68157 | 2.8% | 1.7%(+1.09)#69 | 2.1%(+0.621)#8,242 |
| 70. | 68138 | 2.7% | 1.7%(+1.07)#70 | 2.1%(+0.596)#8,332 |
| 71. | 68128 | 2.7% | 1.7%(+1.04)#71 | 2.1%(+0.571)#8,446 |
| 72. | 68124 | 2.7% | 1.7%(+1.01)#72 | 2.1%(+0.541)#8,585 |
| 73. | 68031 | 2.6% | 1.7%(+0.970)#73 | 2.1%(+0.500)#8,774 |
| 74. | 68344 | 2.6% | 1.7%(+0.942)#74 | 2.1%(+0.472)#8,914 |
| 75. | 68840 | 2.6% | 1.7%(+0.940)#75 | 2.1%(+0.469)#8,920 |
| 76. | 68865 | 2.6% | 1.7%(+0.939)#76 | 2.1%(+0.468)#8,923 |
| 77. | 69356 | 2.6% | 1.7%(+0.922)#77 | 2.1%(+0.452)#8,999 |
| 78. | 68882 | 2.6% | 1.7%(+0.903)#78 | 2.1%(+0.432)#9,100 |
| 79. | 68970 | 2.6% | 1.7%(+0.902)#79 | 2.1%(+0.431)#9,105 |
| 80. | 68154 | 2.6% | 1.7%(+0.882)#80 | 2.1%(+0.412)#9,202 |
| 81. | 68046 | 2.5% | 1.7%(+0.837)#81 | 2.1%(+0.366)#9,440 |
| 82. | 68789 | 2.5% | 1.7%(+0.822)#82 | 2.1%(+0.352)#9,509 |
| 83. | 68818 | 2.5% | 1.7%(+0.818)#83 | 2.1%(+0.347)#9,534 |
| 84. | 68117 | 2.5% | 1.7%(+0.778)#84 | 2.1%(+0.307)#9,754 |
| 85. | 68626 | 2.5% | 1.7%(+0.776)#85 | 2.1%(+0.306)#9,764 |
| 86. | 68133 | 2.5% | 1.7%(+0.774)#86 | 2.1%(+0.304)#9,775 |
| 87. | 68357 | 2.4% | 1.7%(+0.761)#87 | 2.1%(+0.291)#9,859 |
| 88. | 68005 | 2.4% | 1.7%(+0.710)#88 | 2.1%(+0.239)#10,112 |
| 89. | 68333 | 2.4% | 1.7%(+0.673)#89 | 2.1%(+0.203)#10,320 |
| 90. | 69024 | 2.3% | 1.7%(+0.666)#90 | 2.1%(+0.195)#10,360 |
| 91. | 68967 | 2.3% | 1.7%(+0.662)#91 | 2.1%(+0.192)#10,394 |
| 92. | 69151 | 2.3% | 1.7%(+0.659)#92 | 2.1%(+0.188)#10,419 |
| 93. | 68666 | 2.3% | 1.7%(+0.651)#93 | 2.1%(+0.180)#10,465 |
| 94. | 68510 | 2.3% | 1.7%(+0.649)#94 | 2.1%(+0.178)#10,480 |
| 95. | 68516 | 2.3% | 1.7%(+0.644)#95 | 2.1%(+0.173)#10,507 |
| 96. | 69034 | 2.3% | 1.7%(+0.637)#96 | 2.1%(+0.166)#10,557 |
| 97. | 68980 | 2.3% | 1.7%(+0.616)#97 | 2.1%(+0.145)#10,678 |
| 98. | 68136 | 2.3% | 1.7%(+0.611)#98 | 2.1%(+0.140)#10,713 |
| 99. | 68826 | 2.3% | 1.7%(+0.599)#99 | 2.1%(+0.128)#10,791 |
| 100. | 68716 | 2.3% | 1.7%(+0.595)#100 | 2.1%(+0.124)#10,812 |
Common Questions
What are the Top 10 Zip Codes with the Highest Percentage of Population Employed in Security & Protection in Nebraska?
Top 10 Zip Codes with the Highest Percentage of Population Employed in Security & Protection in Nebraska are:
What zip code has the Highest Percentage of Population Employed in Security & Protection in Nebraska?
68113 has the Highest Percentage of Population Employed in Security & Protection in Nebraska with 31.2%.
What is the Percentage of Population Employed in Security & Protection in the State of Nebraska?
Percentage of Population Employed in Security & Protection in Nebraska is 1.7%.
What is the Percentage of Population Employed in Security & Protection in the United States?
Percentage of Population Employed in Security & Protection in the United States is 2.1%.