Zip Codes with the Highest Percentage of Population Taking Taxi / Cab to Work in Los Angeles, CA
RELATED REPORTS & OPTIONS
Taxi / Cab
Los Angeles
Compare Zip Codes
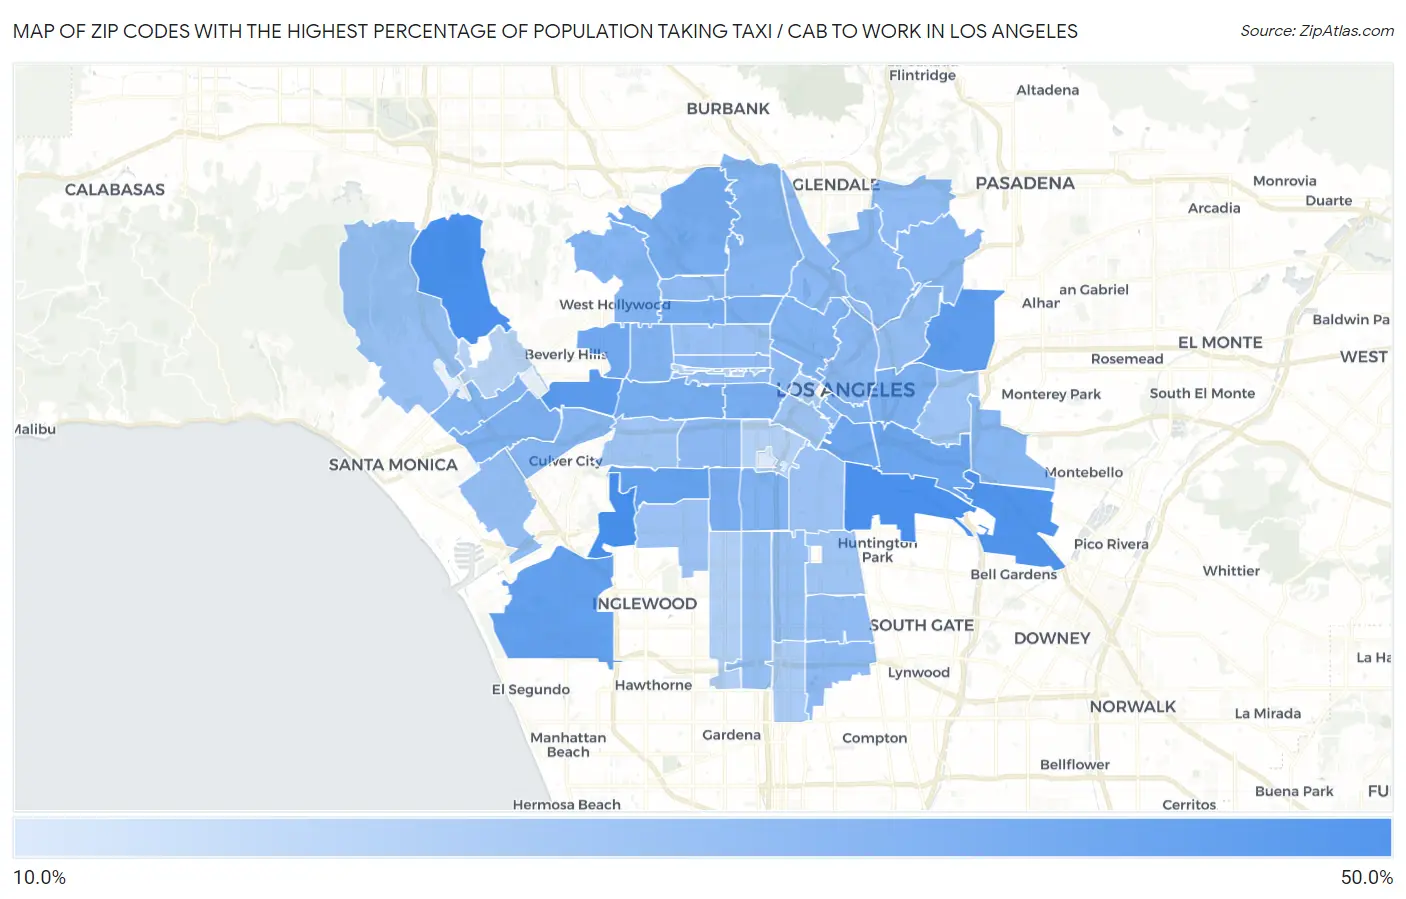
Map of Zip Codes with the Highest Percentage of Population Taking Taxi / Cab to Work in Los Angeles
18.9%
48.7%
Zip Codes with the Highest Percentage of Population Taking Taxi / Cab to Work in Los Angeles, CA
| Zip Code | % Take Taxi / Cab | vs State | vs National | |
| 1. | 90056 | 48.7% | 37.2%(+11.5)#189 | 38.2%(+10.5)#3,365 |
| 2. | 90077 | 48.3% | 37.2%(+11.1)#204 | 38.2%(+10.1)#3,514 |
| 3. | 90058 | 48.3% | 37.2%(+11.1)#205 | 38.2%(+10.1)#3,523 |
| 4. | 90040 | 47.3% | 37.2%(+10.1)#237 | 38.2%(+9.10)#3,877 |
| 5. | 90035 | 44.9% | 37.2%(+7.70)#311 | 38.2%(+6.70)#4,685 |
| 6. | 90032 | 43.7% | 37.2%(+6.50)#343 | 38.2%(+5.50)#5,084 |
| 7. | 90045 | 42.6% | 37.2%(+5.40)#381 | 38.2%(+4.40)#5,474 |
| 8. | 90008 | 42.4% | 37.2%(+5.20)#390 | 38.2%(+4.20)#5,573 |
| 9. | 90023 | 40.9% | 37.2%(+3.70)#436 | 38.2%(+2.70)#6,187 |
| 10. | 90021 | 40.4% | 37.2%(+3.20)#470 | 38.2%(+2.20)#6,458 |
| 11. | 90048 | 39.7% | 37.2%(+2.50)#495 | 38.2%(+1.50)#6,744 |
| 12. | 90038 | 38.9% | 37.2%(+1.70)#530 | 38.2%(+0.700)#7,102 |
| 13. | 90019 | 38.6% | 37.2%(+1.40)#546 | 38.2%(+0.400)#7,206 |
| 14. | 90068 | 38.5% | 37.2%(+1.30)#557 | 38.2%(+0.300)#7,273 |
| 15. | 90006 | 38.4% | 37.2%(+1.20)#560 | 38.2%(+0.200)#7,311 |
| 16. | 90029 | 37.7% | 37.2%(+0.500)#591 | 38.2%(-0.500)#7,620 |
| 17. | 90062 | 37.7% | 37.2%(+0.500)#592 | 38.2%(-0.500)#7,621 |
| 18. | 90033 | 37.4% | 37.2%(+0.200)#601 | 38.2%(-0.800)#7,762 |
| 19. | 90064 | 37.1% | 37.2%(-0.100)#619 | 38.2%(-1.10)#7,901 |
| 20. | 90037 | 36.5% | 37.2%(-0.700)#643 | 38.2%(-1.70)#8,171 |
| 21. | 90026 | 36.4% | 37.2%(-0.800)#650 | 38.2%(-1.80)#8,240 |
| 22. | 90036 | 36.4% | 37.2%(-0.800)#654 | 38.2%(-1.80)#8,255 |
| 23. | 90013 | 36.4% | 37.2%(-0.800)#657 | 38.2%(-1.80)#8,274 |
| 24. | 90027 | 35.7% | 37.2%(-1.50)#692 | 38.2%(-2.50)#8,550 |
| 25. | 90025 | 35.6% | 37.2%(-1.60)#696 | 38.2%(-2.60)#8,609 |
| 26. | 90046 | 35.3% | 37.2%(-1.90)#710 | 38.2%(-2.90)#8,771 |
| 27. | 90022 | 35.1% | 37.2%(-2.10)#717 | 38.2%(-3.10)#8,830 |
| 28. | 90034 | 35.0% | 37.2%(-2.20)#725 | 38.2%(-3.20)#8,866 |
| 29. | 90065 | 34.6% | 37.2%(-2.60)#750 | 38.2%(-3.60)#9,068 |
| 30. | 90039 | 34.5% | 37.2%(-2.70)#755 | 38.2%(-3.70)#9,125 |
| 31. | 90042 | 34.4% | 37.2%(-2.80)#757 | 38.2%(-3.80)#9,166 |
| 32. | 90012 | 34.4% | 37.2%(-2.80)#758 | 38.2%(-3.80)#9,175 |
| 33. | 90014 | 34.3% | 37.2%(-2.90)#765 | 38.2%(-3.90)#9,234 |
| 34. | 90018 | 33.9% | 37.2%(-3.30)#783 | 38.2%(-4.30)#9,369 |
| 35. | 90057 | 33.9% | 37.2%(-3.30)#785 | 38.2%(-4.30)#9,371 |
| 36. | 90020 | 33.7% | 37.2%(-3.50)#796 | 38.2%(-4.50)#9,475 |
| 37. | 90059 | 33.6% | 37.2%(-3.60)#802 | 38.2%(-4.60)#9,514 |
| 38. | 90041 | 33.6% | 37.2%(-3.60)#805 | 38.2%(-4.60)#9,527 |
| 39. | 90028 | 33.5% | 37.2%(-3.70)#813 | 38.2%(-4.70)#9,576 |
| 40. | 90005 | 33.4% | 37.2%(-3.80)#820 | 38.2%(-4.80)#9,617 |
| 41. | 90002 | 33.2% | 37.2%(-4.00)#825 | 38.2%(-5.00)#9,687 |
| 42. | 90031 | 32.8% | 37.2%(-4.40)#846 | 38.2%(-5.40)#9,836 |
| 43. | 90066 | 32.6% | 37.2%(-4.60)#854 | 38.2%(-5.60)#9,936 |
| 44. | 90044 | 32.4% | 37.2%(-4.80)#860 | 38.2%(-5.80)#10,026 |
| 45. | 90003 | 32.4% | 37.2%(-4.80)#862 | 38.2%(-5.80)#10,028 |
| 46. | 90004 | 32.0% | 37.2%(-5.20)#876 | 38.2%(-6.20)#10,149 |
| 47. | 90049 | 31.8% | 37.2%(-5.40)#886 | 38.2%(-6.40)#10,236 |
| 48. | 90015 | 31.1% | 37.2%(-6.10)#915 | 38.2%(-7.10)#10,500 |
| 49. | 90011 | 31.0% | 37.2%(-6.20)#916 | 38.2%(-7.20)#10,510 |
| 50. | 90043 | 30.9% | 37.2%(-6.30)#924 | 38.2%(-7.30)#10,543 |
| 51. | 90016 | 30.5% | 37.2%(-6.70)#943 | 38.2%(-7.70)#10,738 |
| 52. | 90001 | 30.4% | 37.2%(-6.80)#949 | 38.2%(-7.80)#10,776 |
| 53. | 90063 | 30.4% | 37.2%(-6.80)#950 | 38.2%(-7.80)#10,777 |
| 54. | 90017 | 28.9% | 37.2%(-8.30)#992 | 38.2%(-9.30)#11,276 |
| 55. | 90061 | 28.2% | 37.2%(-9.00)#1,008 | 38.2%(-10.0)#11,495 |
| 56. | 90047 | 26.8% | 37.2%(-10.4)#1,029 | 38.2%(-11.4)#11,864 |
| 57. | 90007 | 26.6% | 37.2%(-10.6)#1,039 | 38.2%(-11.6)#11,927 |
| 58. | 90010 | 26.6% | 37.2%(-10.6)#1,041 | 38.2%(-11.6)#11,942 |
| 59. | 90024 | 25.8% | 37.2%(-11.4)#1,047 | 38.2%(-12.4)#12,060 |
| 60. | 90089 | 18.9% | 37.2%(-18.3)#1,093 | 38.2%(-19.3)#13,153 |
1
Common Questions
What are the Top 10 Zip Codes with the Highest Percentage of Population Taking Taxi / Cab to Work in Los Angeles, CA?
Top 10 Zip Codes with the Highest Percentage of Population Taking Taxi / Cab to Work in Los Angeles, CA are:
What zip code has the Highest Percentage of Population Taking Taxi / Cab to Work in Los Angeles, CA?
90056 has the Highest Percentage of Population Taking Taxi / Cab to Work in Los Angeles, CA with 48.7%.
What is the Percentage of Population Taking Taxi / Cab to Work in Los Angeles, CA?
Percentage of Population Taking Taxi / Cab to Work in Los Angeles is 36.0%.
What is the Percentage of Population Taking Taxi / Cab to Work in California?
Percentage of Population Taking Taxi / Cab to Work in California is 37.2%.
What is the Percentage of Population Taking Taxi / Cab to Work in the United States?
Percentage of Population Taking Taxi / Cab to Work in the United States is 38.2%.