Zip Codes with the Highest Percentage of Population Employed in Security & Protection in Maine
RELATED REPORTS & OPTIONS
Security & Protection
Maine
Compare Zip Codes
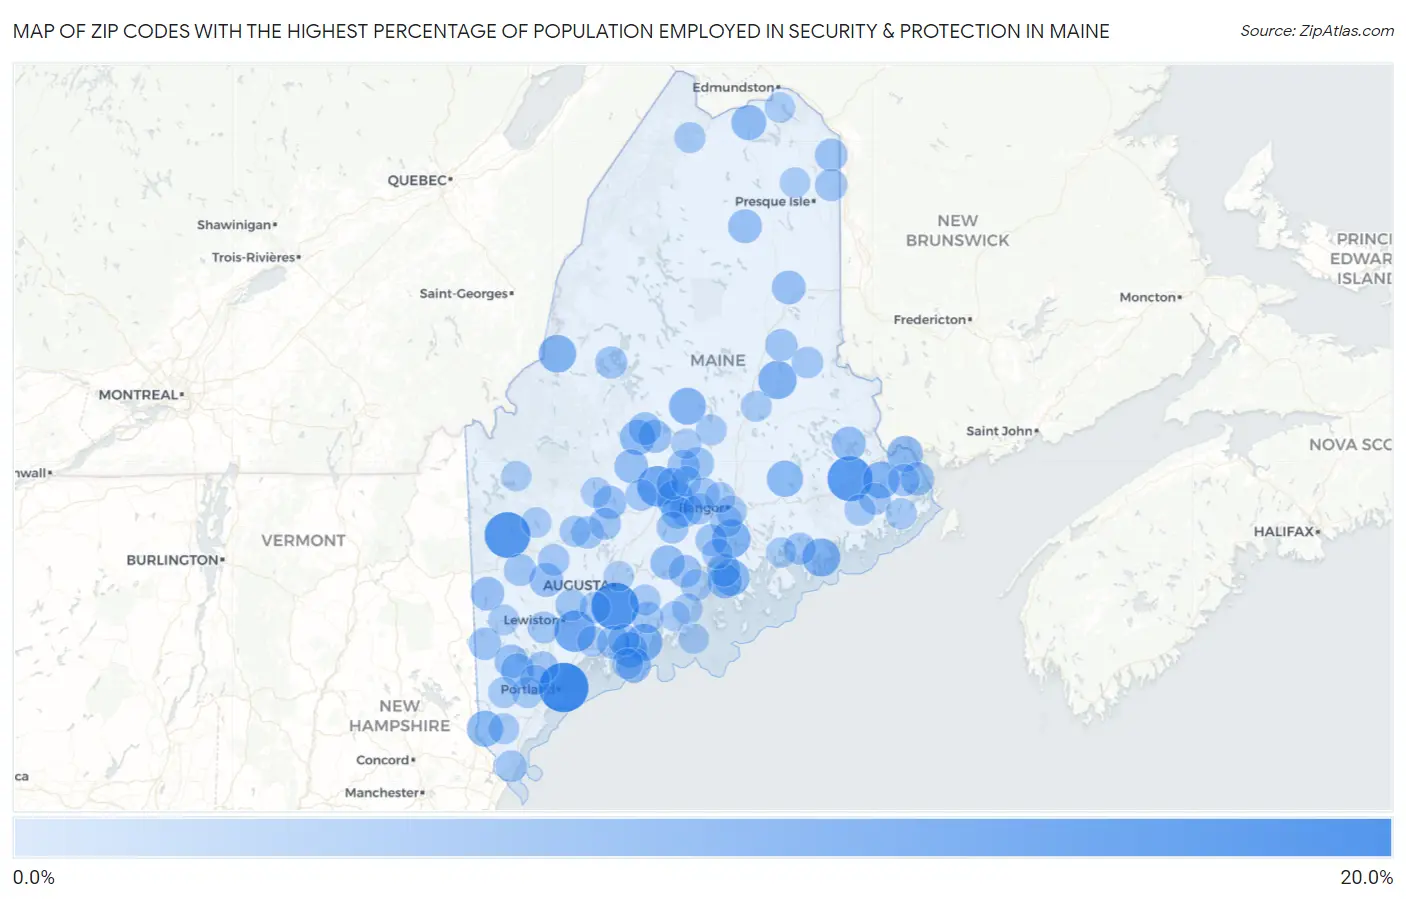
Map of Zip Codes with the Highest Percentage of Population Employed in Security & Protection in Maine
0.0%
20.0%
Zip Codes with the Highest Percentage of Population Employed in Security & Protection in Maine
| Zip Code | % Employed | vs State | vs National | |
| 1. | 04109 | 16.7% | 1.6%(+15.0)#1 | 2.1%(+14.5)#291 |
| 2. | 04359 | 14.8% | 1.6%(+13.2)#2 | 2.1%(+12.7)#370 |
| 3. | 04226 | 13.8% | 1.6%(+12.2)#3 | 2.1%(+11.6)#427 |
| 4. | 04686 | 13.3% | 1.6%(+11.6)#4 | 2.1%(+11.1)#465 |
| 5. | 04250 | 10.4% | 1.6%(+8.81)#5 | 2.1%(+8.30)#716 |
| 6. | 04971 | 9.9% | 1.6%(+8.30)#6 | 2.1%(+7.78)#776 |
| 7. | 04459 | 8.2% | 1.6%(+6.52)#7 | 2.1%(+6.01)#1,108 |
| 8. | 04416 | 8.1% | 1.6%(+6.44)#8 | 2.1%(+5.93)#1,139 |
| 9. | 04680 | 7.9% | 1.6%(+6.29)#9 | 2.1%(+5.77)#1,193 |
| 10. | 04945 | 7.5% | 1.6%(+5.91)#10 | 2.1%(+5.40)#1,315 |
| 11. | 04953 | 7.4% | 1.6%(+5.74)#11 | 2.1%(+5.22)#1,372 |
| 12. | 04539 | 7.3% | 1.6%(+5.71)#12 | 2.1%(+5.20)#1,381 |
| 13. | 04414 | 7.1% | 1.6%(+5.48)#13 | 2.1%(+4.96)#1,486 |
| 14. | 04657 | 7.1% | 1.6%(+5.44)#14 | 2.1%(+4.93)#1,499 |
| 15. | 04617 | 6.8% | 1.6%(+5.20)#15 | 2.1%(+4.69)#1,614 |
| 16. | 04408 | 6.6% | 1.6%(+4.97)#16 | 2.1%(+4.46)#1,731 |
| 17. | 04027 | 6.5% | 1.6%(+4.84)#17 | 2.1%(+4.32)#1,796 |
| 18. | 04619 | 6.2% | 1.6%(+4.57)#18 | 2.1%(+4.06)#1,946 |
| 19. | 04537 | 6.0% | 1.6%(+4.37)#19 | 2.1%(+3.86)#2,077 |
| 20. | 04406 | 5.9% | 1.6%(+4.25)#20 | 2.1%(+3.73)#2,154 |
| 21. | 04781 | 5.8% | 1.6%(+4.12)#21 | 2.1%(+3.60)#2,249 |
| 22. | 04544 | 5.4% | 1.6%(+3.77)#22 | 2.1%(+3.26)#2,531 |
| 23. | 04642 | 5.2% | 1.6%(+3.54)#23 | 2.1%(+3.02)#2,736 |
| 24. | 04941 | 5.1% | 1.6%(+3.48)#24 | 2.1%(+2.97)#2,796 |
| 25. | 04668 | 5.0% | 1.6%(+3.40)#25 | 2.1%(+2.89)#2,880 |
| 26. | 04732 | 4.8% | 1.6%(+3.21)#26 | 2.1%(+2.69)#3,121 |
| 27. | 04220 | 4.8% | 1.6%(+3.19)#27 | 2.1%(+2.68)#3,142 |
| 28. | 04942 | 4.8% | 1.6%(+3.15)#28 | 2.1%(+2.63)#3,189 |
| 29. | 04780 | 4.7% | 1.6%(+3.09)#29 | 2.1%(+2.58)#3,263 |
| 30. | 04231 | 4.7% | 1.6%(+3.08)#30 | 2.1%(+2.57)#3,283 |
| 31. | 04421 | 4.6% | 1.6%(+2.94)#31 | 2.1%(+2.43)#3,480 |
| 32. | 04579 | 4.6% | 1.6%(+2.93)#32 | 2.1%(+2.42)#3,495 |
| 33. | 04667 | 4.6% | 1.6%(+2.93)#33 | 2.1%(+2.41)#3,498 |
| 34. | 04024 | 4.5% | 1.6%(+2.91)#34 | 2.1%(+2.40)#3,530 |
| 35. | 04085 | 4.4% | 1.6%(+2.80)#35 | 2.1%(+2.29)#3,710 |
| 36. | 04443 | 4.4% | 1.6%(+2.79)#36 | 2.1%(+2.28)#3,728 |
| 37. | 04950 | 4.4% | 1.6%(+2.79)#37 | 2.1%(+2.27)#3,742 |
| 38. | 04434 | 4.3% | 1.6%(+2.71)#38 | 2.1%(+2.20)#3,861 |
| 39. | 04422 | 4.2% | 1.6%(+2.58)#39 | 2.1%(+2.06)#4,102 |
| 40. | 04464 | 4.2% | 1.6%(+2.53)#40 | 2.1%(+2.02)#4,186 |
| 41. | 04750 | 4.1% | 1.6%(+2.44)#41 | 2.1%(+1.92)#4,355 |
| 42. | 04952 | 4.0% | 1.6%(+2.33)#42 | 2.1%(+1.82)#4,564 |
| 43. | 04939 | 3.9% | 1.6%(+2.27)#43 | 2.1%(+1.75)#4,683 |
| 44. | 04010 | 3.8% | 1.6%(+2.21)#44 | 2.1%(+1.70)#4,812 |
| 45. | 04742 | 3.8% | 1.6%(+2.14)#45 | 2.1%(+1.63)#4,957 |
| 46. | 04955 | 3.8% | 1.6%(+2.14)#46 | 2.1%(+1.62)#4,965 |
| 47. | 04062 | 3.7% | 1.6%(+2.11)#47 | 2.1%(+1.60)#5,041 |
| 48. | 04969 | 3.7% | 1.6%(+2.07)#48 | 2.1%(+1.56)#5,117 |
| 49. | 04928 | 3.7% | 1.6%(+2.05)#49 | 2.1%(+1.54)#5,181 |
| 50. | 04666 | 3.7% | 1.6%(+2.03)#50 | 2.1%(+1.51)#5,243 |
| 51. | 04219 | 3.7% | 1.6%(+2.02)#51 | 2.1%(+1.50)#5,271 |
| 52. | 04478 | 3.6% | 1.6%(+1.99)#52 | 2.1%(+1.48)#5,340 |
| 53. | 04957 | 3.6% | 1.6%(+1.95)#53 | 2.1%(+1.44)#5,431 |
| 54. | 04474 | 3.6% | 1.6%(+1.94)#54 | 2.1%(+1.42)#5,465 |
| 55. | 04664 | 3.6% | 1.6%(+1.93)#55 | 2.1%(+1.41)#5,502 |
| 56. | 04776 | 3.5% | 1.6%(+1.91)#56 | 2.1%(+1.40)#5,541 |
| 57. | 04987 | 3.5% | 1.6%(+1.86)#57 | 2.1%(+1.34)#5,691 |
| 58. | 04456 | 3.4% | 1.6%(+1.78)#58 | 2.1%(+1.27)#5,884 |
| 59. | 04274 | 3.3% | 1.6%(+1.67)#59 | 2.1%(+1.15)#6,236 |
| 60. | 04630 | 3.3% | 1.6%(+1.66)#60 | 2.1%(+1.15)#6,258 |
| 61. | 04236 | 3.3% | 1.6%(+1.65)#61 | 2.1%(+1.14)#6,288 |
| 62. | 04438 | 3.3% | 1.6%(+1.65)#62 | 2.1%(+1.13)#6,305 |
| 63. | 04221 | 3.2% | 1.6%(+1.58)#63 | 2.1%(+1.06)#6,514 |
| 64. | 04497 | 3.2% | 1.6%(+1.53)#64 | 2.1%(+1.02)#6,651 |
| 65. | 04578 | 3.2% | 1.6%(+1.53)#65 | 2.1%(+1.02)#6,653 |
| 66. | 03909 | 3.1% | 1.6%(+1.51)#66 | 2.1%(+0.997)#6,717 |
| 67. | 04555 | 3.1% | 1.6%(+1.49)#67 | 2.1%(+0.977)#6,795 |
| 68. | 04943 | 3.1% | 1.6%(+1.46)#68 | 2.1%(+0.951)#6,886 |
| 69. | 04350 | 3.1% | 1.6%(+1.46)#69 | 2.1%(+0.950)#6,891 |
| 70. | 04419 | 3.0% | 1.6%(+1.39)#70 | 2.1%(+0.876)#7,128 |
| 71. | 04093 | 2.9% | 1.6%(+1.30)#71 | 2.1%(+0.783)#7,508 |
| 72. | 04691 | 2.9% | 1.6%(+1.29)#72 | 2.1%(+0.780)#7,521 |
| 73. | 04849 | 2.9% | 1.6%(+1.29)#73 | 2.1%(+0.780)#7,522 |
| 74. | 04412 | 2.9% | 1.6%(+1.28)#74 | 2.1%(+0.766)#7,584 |
| 75. | 04654 | 2.9% | 1.6%(+1.23)#75 | 2.1%(+0.716)#7,803 |
| 76. | 04061 | 2.8% | 1.6%(+1.20)#76 | 2.1%(+0.688)#7,929 |
| 77. | 04348 | 2.8% | 1.6%(+1.18)#77 | 2.1%(+0.664)#8,063 |
| 78. | 04938 | 2.8% | 1.6%(+1.17)#78 | 2.1%(+0.659)#8,082 |
| 79. | 04576 | 2.8% | 1.6%(+1.14)#79 | 2.1%(+0.629)#8,207 |
| 80. | 04073 | 2.8% | 1.6%(+1.12)#80 | 2.1%(+0.606)#8,300 |
| 81. | 04463 | 2.7% | 1.6%(+1.08)#81 | 2.1%(+0.568)#8,465 |
| 82. | 04743 | 2.7% | 1.6%(+1.05)#82 | 2.1%(+0.541)#8,587 |
| 83. | 04457 | 2.7% | 1.6%(+1.04)#83 | 2.1%(+0.525)#8,662 |
| 84. | 04401 | 2.6% | 1.6%(+1.01)#84 | 2.1%(+0.492)#8,819 |
| 85. | 04040 | 2.6% | 1.6%(+0.945)#85 | 2.1%(+0.432)#9,099 |
| 86. | 04856 | 2.6% | 1.6%(+0.918)#86 | 2.1%(+0.405)#9,229 |
| 87. | 04086 | 2.5% | 1.6%(+0.881)#87 | 2.1%(+0.368)#9,431 |
| 88. | 04981 | 2.5% | 1.6%(+0.858)#88 | 2.1%(+0.345)#9,545 |
| 89. | 04958 | 2.5% | 1.6%(+0.856)#89 | 2.1%(+0.343)#9,555 |
| 90. | 04038 | 2.4% | 1.6%(+0.766)#90 | 2.1%(+0.253)#10,047 |
| 91. | 04435 | 2.4% | 1.6%(+0.745)#91 | 2.1%(+0.233)#10,155 |
| 92. | 04426 | 2.4% | 1.6%(+0.732)#92 | 2.1%(+0.219)#10,242 |
| 93. | 04640 | 2.3% | 1.6%(+0.695)#93 | 2.1%(+0.183)#10,452 |
| 94. | 04786 | 2.3% | 1.6%(+0.690)#94 | 2.1%(+0.177)#10,486 |
| 95. | 04772 | 2.3% | 1.6%(+0.663)#95 | 2.1%(+0.150)#10,649 |
| 96. | 04285 | 2.3% | 1.6%(+0.655)#96 | 2.1%(+0.142)#10,706 |
| 97. | 04330 | 2.3% | 1.6%(+0.642)#97 | 2.1%(+0.129)#10,780 |
| 98. | 04970 | 2.3% | 1.6%(+0.637)#98 | 2.1%(+0.124)#10,808 |
| 99. | 04864 | 2.3% | 1.6%(+0.626)#99 | 2.1%(+0.113)#10,872 |
| 100. | 04854 | 2.2% | 1.6%(+0.605)#100 | 2.1%(+0.092)#11,006 |
Common Questions
What are the Top 10 Zip Codes with the Highest Percentage of Population Employed in Security & Protection in Maine?
Top 10 Zip Codes with the Highest Percentage of Population Employed in Security & Protection in Maine are:
What zip code has the Highest Percentage of Population Employed in Security & Protection in Maine?
04109 has the Highest Percentage of Population Employed in Security & Protection in Maine with 16.7%.
What is the Percentage of Population Employed in Security & Protection in the State of Maine?
Percentage of Population Employed in Security & Protection in Maine is 1.6%.
What is the Percentage of Population Employed in Security & Protection in the United States?
Percentage of Population Employed in Security & Protection in the United States is 2.1%.