Zip Codes with the Highest Percentage of Population Employed in Security & Protection in Wyoming
RELATED REPORTS & OPTIONS
Security & Protection
Wyoming
Compare Zip Codes
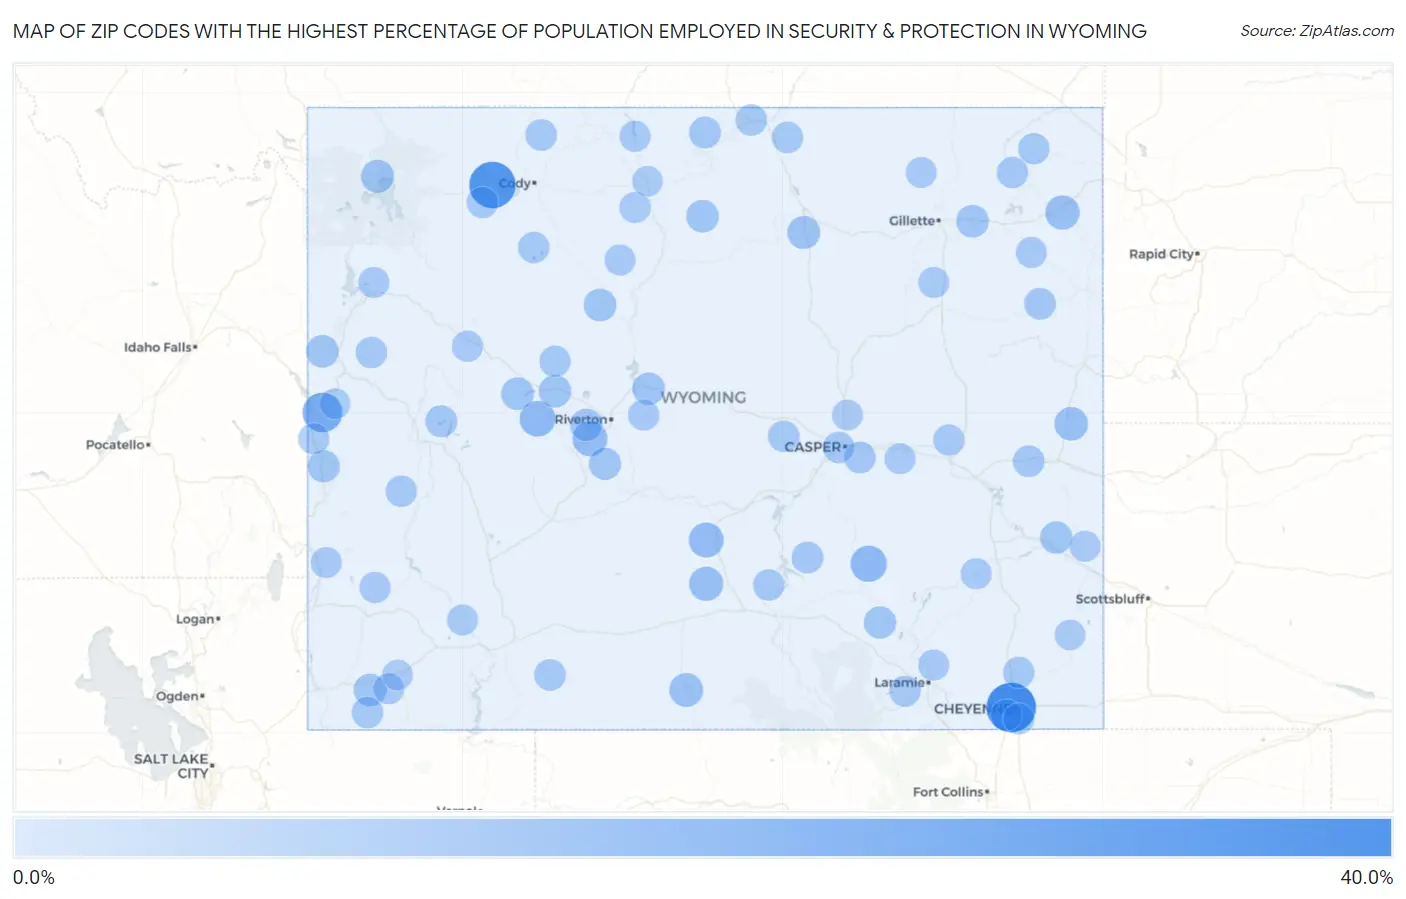
Map of Zip Codes with the Highest Percentage of Population Employed in Security & Protection in Wyoming
0.0%
40.0%
Zip Codes with the Highest Percentage of Population Employed in Security & Protection in Wyoming
| Zip Code | % Employed | vs State | vs National | |
| 1. | 82005 | 40.0% | 1.9%(+38.1)#1 | 2.1%(+37.9)#56 |
| 2. | 82450 | 33.3% | 1.9%(+31.4)#2 | 2.1%(+31.2)#78 |
| 3. | 83118 | 19.2% | 1.9%(+17.2)#3 | 2.1%(+17.0)#220 |
| 4. | 82329 | 11.9% | 1.9%(+9.93)#4 | 2.1%(+9.73)#561 |
| 5. | 82514 | 10.8% | 1.9%(+8.83)#5 | 2.1%(+8.63)#669 |
| 6. | 82515 | 9.3% | 1.9%(+7.34)#6 | 2.1%(+7.13)#865 |
| 7. | 82322 | 9.1% | 1.9%(+7.14)#7 | 2.1%(+6.94)#896 |
| 8. | 82729 | 7.8% | 1.9%(+5.87)#8 | 2.1%(+5.67)#1,233 |
| 9. | 82301 | 7.6% | 1.9%(+5.68)#9 | 2.1%(+5.48)#1,286 |
| 10. | 82321 | 7.0% | 1.9%(+5.06)#10 | 2.1%(+4.86)#1,529 |
| 11. | 82225 | 6.4% | 1.9%(+4.49)#11 | 2.1%(+4.29)#1,810 |
| 12. | 82834 | 5.1% | 1.9%(+3.19)#12 | 2.1%(+2.99)#2,774 |
| 13. | 82190 | 5.0% | 1.9%(+3.06)#13 | 2.1%(+2.86)#2,921 |
| 14. | 82443 | 4.6% | 1.9%(+2.67)#14 | 2.1%(+2.46)#3,418 |
| 15. | 82512 | 4.5% | 1.9%(+2.60)#15 | 2.1%(+2.40)#3,533 |
| 16. | 82516 | 4.4% | 1.9%(+2.50)#16 | 2.1%(+2.30)#3,700 |
| 17. | 82727 | 4.4% | 1.9%(+2.49)#17 | 2.1%(+2.29)#3,715 |
| 18. | 83014 | 4.4% | 1.9%(+2.45)#18 | 2.1%(+2.25)#3,778 |
| 19. | 82933 | 4.4% | 1.9%(+2.43)#19 | 2.1%(+2.23)#3,810 |
| 20. | 82428 | 4.3% | 1.9%(+2.40)#20 | 2.1%(+2.20)#3,869 |
| 21. | 82510 | 4.1% | 1.9%(+2.14)#21 | 2.1%(+1.94)#4,327 |
| 22. | 82649 | 4.1% | 1.9%(+2.11)#22 | 2.1%(+1.91)#4,370 |
| 23. | 83110 | 3.9% | 1.9%(+1.90)#23 | 2.1%(+1.70)#4,802 |
| 24. | 82083 | 3.8% | 1.9%(+1.87)#24 | 2.1%(+1.67)#4,862 |
| 25. | 82520 | 3.7% | 1.9%(+1.75)#25 | 2.1%(+1.55)#5,145 |
| 26. | 82212 | 3.7% | 1.9%(+1.74)#26 | 2.1%(+1.54)#5,179 |
| 27. | 82941 | 3.1% | 1.9%(+1.15)#27 | 2.1%(+0.949)#6,898 |
| 28. | 82836 | 3.0% | 1.9%(+1.07)#28 | 2.1%(+0.865)#7,179 |
| 29. | 82327 | 2.8% | 1.9%(+0.848)#29 | 2.1%(+0.647)#8,129 |
| 30. | 82701 | 2.5% | 1.9%(+0.552)#30 | 2.1%(+0.351)#9,514 |
| 31. | 82227 | 2.5% | 1.9%(+0.512)#31 | 2.1%(+0.311)#9,741 |
| 32. | 82609 | 2.4% | 1.9%(+0.436)#32 | 2.1%(+0.234)#10,140 |
| 33. | 82901 | 2.3% | 1.9%(+0.358)#33 | 2.1%(+0.157)#10,615 |
| 34. | 82435 | 2.3% | 1.9%(+0.334)#34 | 2.1%(+0.133)#10,755 |
| 35. | 82930 | 2.2% | 1.9%(+0.246)#35 | 2.1%(+0.045)#11,296 |
| 36. | 82644 | 2.2% | 1.9%(+0.241)#36 | 2.1%(+0.039)#11,325 |
| 37. | 82604 | 2.2% | 1.9%(+0.228)#37 | 2.1%(+0.027)#11,403 |
| 38. | 82839 | 2.2% | 1.9%(+0.210)#38 | 2.1%(+0.009)#11,526 |
| 39. | 82414 | 2.1% | 1.9%(+0.193)#39 | 2.1%(-0.009)#11,630 |
| 40. | 82001 | 2.1% | 1.9%(+0.171)#40 | 2.1%(-0.030)#11,775 |
| 41. | 82801 | 2.1% | 1.9%(+0.158)#41 | 2.1%(-0.043)#11,863 |
| 42. | 82009 | 2.1% | 1.9%(+0.147)#42 | 2.1%(-0.054)#11,954 |
| 43. | 83113 | 2.0% | 1.9%(+0.101)#43 | 2.1%(-0.100)#12,260 |
| 44. | 82721 | 2.0% | 1.9%(+0.023)#44 | 2.1%(-0.178)#12,753 |
| 45. | 82433 | 2.0% | 1.9%(+0.004)#45 | 2.1%(-0.197)#12,880 |
| 46. | 83001 | 1.9% | 1.9%(-0.087)#46 | 2.1%(-0.289)#13,491 |
| 47. | 82334 | 1.9% | 1.9%(-0.095)#47 | 2.1%(-0.297)#13,544 |
| 48. | 82720 | 1.6% | 1.9%(-0.353)#48 | 2.1%(-0.554)#15,456 |
| 49. | 82523 | 1.6% | 1.9%(-0.367)#49 | 2.1%(-0.568)#15,567 |
| 50. | 82501 | 1.6% | 1.9%(-0.392)#50 | 2.1%(-0.593)#15,765 |
| 51. | 82431 | 1.5% | 1.9%(-0.422)#51 | 2.1%(-0.623)#15,987 |
| 52. | 82410 | 1.5% | 1.9%(-0.443)#52 | 2.1%(-0.644)#16,155 |
| 53. | 82070 | 1.5% | 1.9%(-0.458)#53 | 2.1%(-0.659)#16,302 |
| 54. | 83101 | 1.5% | 1.9%(-0.484)#54 | 2.1%(-0.686)#16,477 |
| 55. | 82633 | 1.5% | 1.9%(-0.493)#55 | 2.1%(-0.694)#16,543 |
| 56. | 82007 | 1.4% | 1.9%(-0.502)#56 | 2.1%(-0.704)#16,624 |
| 57. | 82513 | 1.4% | 1.9%(-0.517)#57 | 2.1%(-0.718)#16,733 |
| 58. | 83127 | 1.4% | 1.9%(-0.558)#58 | 2.1%(-0.759)#17,028 |
| 59. | 82730 | 1.4% | 1.9%(-0.585)#59 | 2.1%(-0.786)#17,233 |
| 60. | 82240 | 1.2% | 1.9%(-0.707)#60 | 2.1%(-0.908)#18,202 |
| 61. | 82935 | 1.2% | 1.9%(-0.718)#61 | 2.1%(-0.919)#18,282 |
| 62. | 83114 | 1.2% | 1.9%(-0.757)#62 | 2.1%(-0.958)#18,580 |
| 63. | 82201 | 1.1% | 1.9%(-0.857)#63 | 2.1%(-1.06)#19,362 |
| 64. | 82072 | 1.1% | 1.9%(-0.868)#64 | 2.1%(-1.07)#19,441 |
| 65. | 82401 | 1.1% | 1.9%(-0.870)#65 | 2.1%(-1.07)#19,453 |
| 66. | 82718 | 1.0% | 1.9%(-0.903)#66 | 2.1%(-1.10)#19,708 |
| 67. | 82939 | 1.0% | 1.9%(-0.935)#67 | 2.1%(-1.14)#19,947 |
| 68. | 83013 | 0.99% | 1.9%(-0.957)#68 | 2.1%(-1.16)#20,130 |
| 69. | 82637 | 0.95% | 1.9%(-0.994)#69 | 2.1%(-1.20)#20,416 |
| 70. | 82716 | 0.94% | 1.9%(-1.01)#70 | 2.1%(-1.21)#20,493 |
| 71. | 82601 | 0.77% | 1.9%(-1.18)#71 | 2.1%(-1.38)#21,633 |
| 72. | 83128 | 0.62% | 1.9%(-1.33)#72 | 2.1%(-1.53)#22,558 |
| 73. | 82426 | 0.61% | 1.9%(-1.33)#73 | 2.1%(-1.53)#22,586 |
| 74. | 82937 | 0.60% | 1.9%(-1.34)#74 | 2.1%(-1.54)#22,642 |
| 75. | 82221 | 0.39% | 1.9%(-1.56)#75 | 2.1%(-1.76)#23,774 |
1
2Common Questions
What are the Top 10 Zip Codes with the Highest Percentage of Population Employed in Security & Protection in Wyoming?
Top 10 Zip Codes with the Highest Percentage of Population Employed in Security & Protection in Wyoming are:
What zip code has the Highest Percentage of Population Employed in Security & Protection in Wyoming?
82005 has the Highest Percentage of Population Employed in Security & Protection in Wyoming with 40.0%.
What is the Percentage of Population Employed in Security & Protection in the State of Wyoming?
Percentage of Population Employed in Security & Protection in Wyoming is 1.9%.
What is the Percentage of Population Employed in Security & Protection in the United States?
Percentage of Population Employed in Security & Protection in the United States is 2.1%.