Zip Codes with the Highest Percentage of Population Employed in Security & Protection in Florida
RELATED REPORTS & OPTIONS
Security & Protection
Florida
Compare Zip Codes
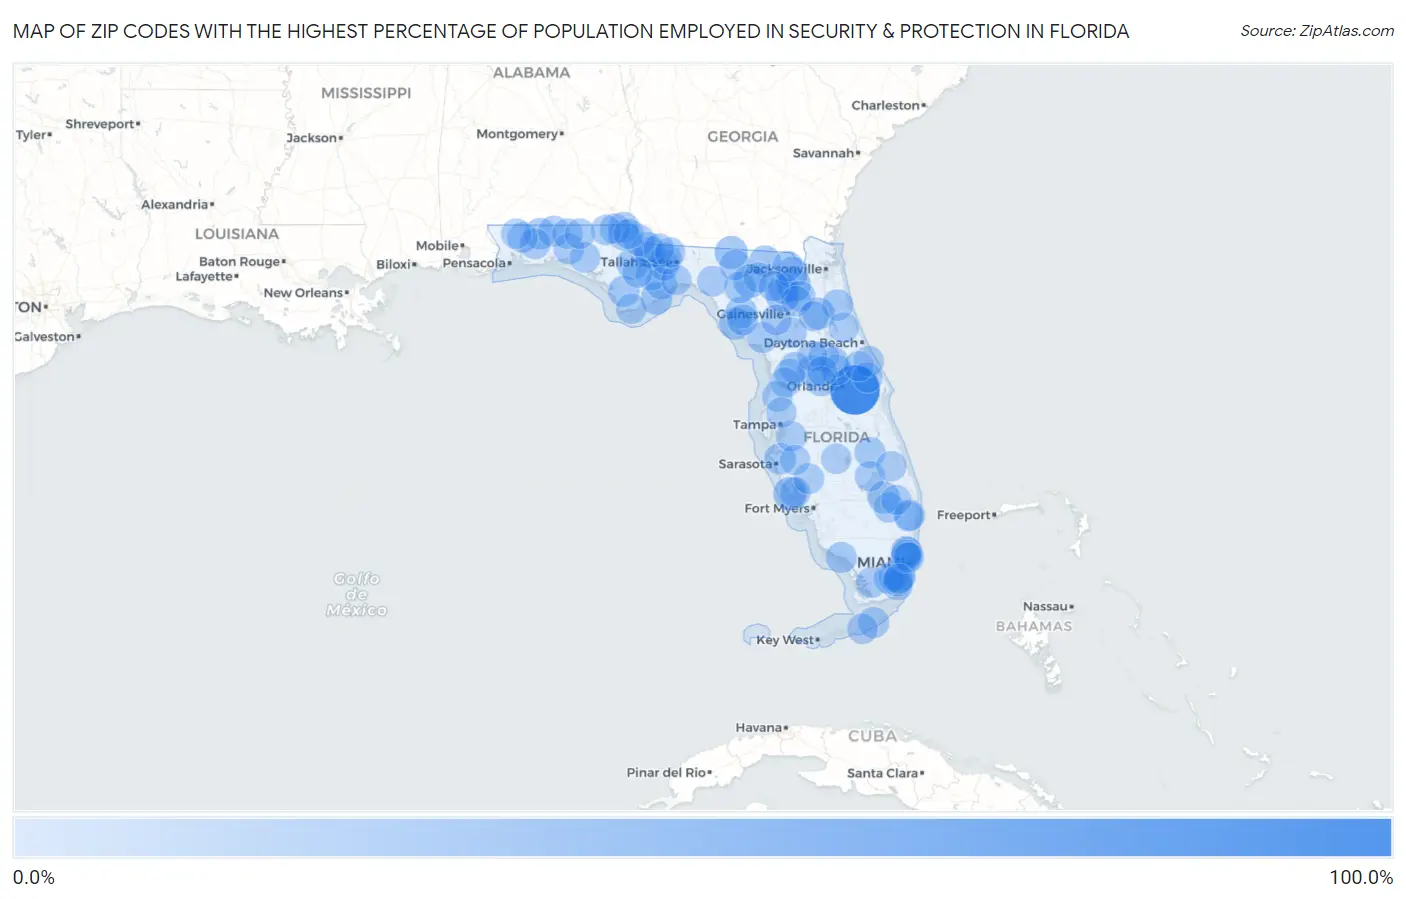
Map of Zip Codes with the Highest Percentage of Population Employed in Security & Protection in Florida
0.0%
100.0%
Zip Codes with the Highest Percentage of Population Employed in Security & Protection in Florida
| Zip Code | % Employed | vs State | vs National | |
| 1. | 32831 | 100.0% | 2.4%(+97.6)#1 | 2.1%(+97.9)#1 |
| 2. | 32083 | 22.9% | 2.4%(+20.5)#2 | 2.1%(+20.7)#150 |
| 3. | 32697 | 22.4% | 2.4%(+19.9)#3 | 2.1%(+20.2)#159 |
| 4. | 33946 | 19.9% | 2.4%(+17.5)#4 | 2.1%(+17.8)#201 |
| 5. | 32062 | 18.9% | 2.4%(+16.4)#5 | 2.1%(+16.7)#228 |
| 6. | 32350 | 17.7% | 2.4%(+15.3)#6 | 2.1%(+15.6)#262 |
| 7. | 33476 | 13.7% | 2.4%(+11.3)#7 | 2.1%(+11.5)#433 |
| 8. | 32147 | 13.6% | 2.4%(+11.1)#8 | 2.1%(+11.4)#441 |
| 9. | 32648 | 13.4% | 2.4%(+11.0)#9 | 2.1%(+11.3)#451 |
| 10. | 32424 | 12.3% | 2.4%(+9.93)#10 | 2.1%(+10.2)#522 |
| 11. | 32322 | 11.8% | 2.4%(+9.34)#11 | 2.1%(+9.61)#575 |
| 12. | 32628 | 11.5% | 2.4%(+9.10)#12 | 2.1%(+9.37)#598 |
| 13. | 32066 | 11.4% | 2.4%(+8.93)#13 | 2.1%(+9.20)#618 |
| 14. | 32358 | 11.2% | 2.4%(+8.82)#14 | 2.1%(+9.09)#622 |
| 15. | 32460 | 11.2% | 2.4%(+8.81)#15 | 2.1%(+9.08)#623 |
| 16. | 34201 | 11.1% | 2.4%(+8.66)#16 | 2.1%(+8.93)#640 |
| 17. | 32096 | 11.1% | 2.4%(+8.65)#17 | 2.1%(+8.93)#641 |
| 18. | 34762 | 10.8% | 2.4%(+8.42)#18 | 2.1%(+8.69)#660 |
| 19. | 32040 | 10.5% | 2.4%(+8.07)#19 | 2.1%(+8.34)#704 |
| 20. | 32334 | 10.3% | 2.4%(+7.85)#20 | 2.1%(+8.13)#733 |
| 21. | 32465 | 10.1% | 2.4%(+7.68)#21 | 2.1%(+7.95)#752 |
| 22. | 32531 | 9.9% | 2.4%(+7.53)#22 | 2.1%(+7.80)#772 |
| 23. | 32310 | 9.5% | 2.4%(+7.06)#23 | 2.1%(+7.33)#843 |
| 24. | 32330 | 9.1% | 2.4%(+6.64)#24 | 2.1%(+6.91)#902 |
| 25. | 33538 | 9.0% | 2.4%(+6.57)#25 | 2.1%(+6.84)#916 |
| 26. | 32445 | 8.9% | 2.4%(+6.48)#26 | 2.1%(+6.75)#934 |
| 27. | 32033 | 8.8% | 2.4%(+6.37)#27 | 2.1%(+6.64)#954 |
| 28. | 32683 | 8.1% | 2.4%(+5.72)#28 | 2.1%(+5.99)#1,114 |
| 29. | 34972 | 8.1% | 2.4%(+5.69)#29 | 2.1%(+5.96)#1,123 |
| 30. | 33001 | 8.1% | 2.4%(+5.69)#30 | 2.1%(+5.96)#1,127 |
| 31. | 32446 | 8.1% | 2.4%(+5.67)#31 | 2.1%(+5.95)#1,133 |
| 32. | 32680 | 8.1% | 2.4%(+5.66)#32 | 2.1%(+5.93)#1,140 |
| 33. | 32567 | 8.0% | 2.4%(+5.60)#33 | 2.1%(+5.87)#1,161 |
| 34. | 34139 | 7.9% | 2.4%(+5.47)#34 | 2.1%(+5.75)#1,204 |
| 35. | 32343 | 7.6% | 2.4%(+5.15)#35 | 2.1%(+5.42)#1,306 |
| 36. | 32686 | 7.5% | 2.4%(+5.09)#36 | 2.1%(+5.36)#1,333 |
| 37. | 32324 | 7.3% | 2.4%(+4.84)#37 | 2.1%(+5.11)#1,416 |
| 38. | 32059 | 7.1% | 2.4%(+4.73)#38 | 2.1%(+5.00)#1,465 |
| 39. | 32618 | 7.1% | 2.4%(+4.67)#39 | 2.1%(+4.94)#1,497 |
| 40. | 32564 | 7.0% | 2.4%(+4.58)#40 | 2.1%(+4.85)#1,533 |
| 41. | 32435 | 7.0% | 2.4%(+4.56)#41 | 2.1%(+4.83)#1,547 |
| 42. | 33190 | 7.0% | 2.4%(+4.53)#42 | 2.1%(+4.80)#1,556 |
| 43. | 33035 | 6.9% | 2.4%(+4.45)#43 | 2.1%(+4.72)#1,597 |
| 44. | 33034 | 6.9% | 2.4%(+4.44)#44 | 2.1%(+4.71)#1,604 |
| 45. | 32054 | 6.9% | 2.4%(+4.43)#45 | 2.1%(+4.71)#1,606 |
| 46. | 34436 | 6.7% | 2.4%(+4.30)#46 | 2.1%(+4.57)#1,677 |
| 47. | 33169 | 6.7% | 2.4%(+4.25)#47 | 2.1%(+4.52)#1,696 |
| 48. | 32776 | 6.5% | 2.4%(+4.11)#48 | 2.1%(+4.38)#1,774 |
| 49. | 33170 | 6.5% | 2.4%(+4.08)#49 | 2.1%(+4.35)#1,784 |
| 50. | 32347 | 6.5% | 2.4%(+4.08)#50 | 2.1%(+4.35)#1,785 |
| 51. | 33981 | 6.4% | 2.4%(+3.99)#51 | 2.1%(+4.26)#1,825 |
| 52. | 33051 | 6.4% | 2.4%(+3.97)#52 | 2.1%(+4.24)#1,834 |
| 53. | 32141 | 6.4% | 2.4%(+3.97)#53 | 2.1%(+4.24)#1,835 |
| 54. | 32087 | 6.3% | 2.4%(+3.91)#54 | 2.1%(+4.18)#1,883 |
| 55. | 32462 | 6.3% | 2.4%(+3.91)#55 | 2.1%(+4.18)#1,884 |
| 56. | 32352 | 6.3% | 2.4%(+3.90)#56 | 2.1%(+4.17)#1,891 |
| 57. | 32091 | 6.3% | 2.4%(+3.89)#57 | 2.1%(+4.16)#1,895 |
| 58. | 32426 | 6.3% | 2.4%(+3.86)#58 | 2.1%(+4.13)#1,908 |
| 59. | 34269 | 6.3% | 2.4%(+3.84)#59 | 2.1%(+4.11)#1,918 |
| 60. | 33472 | 6.1% | 2.4%(+3.68)#60 | 2.1%(+3.95)#2,014 |
| 61. | 33187 | 6.1% | 2.4%(+3.67)#61 | 2.1%(+3.94)#2,020 |
| 62. | 34610 | 6.0% | 2.4%(+3.60)#62 | 2.1%(+3.87)#2,064 |
| 63. | 34974 | 6.0% | 2.4%(+3.54)#63 | 2.1%(+3.81)#2,109 |
| 64. | 32433 | 5.9% | 2.4%(+3.50)#64 | 2.1%(+3.77)#2,136 |
| 65. | 32784 | 5.9% | 2.4%(+3.45)#65 | 2.1%(+3.72)#2,171 |
| 66. | 33033 | 5.8% | 2.4%(+3.37)#66 | 2.1%(+3.64)#2,217 |
| 67. | 32094 | 5.8% | 2.4%(+3.35)#67 | 2.1%(+3.62)#2,232 |
| 68. | 32570 | 5.8% | 2.4%(+3.34)#68 | 2.1%(+3.61)#2,246 |
| 69. | 32440 | 5.7% | 2.4%(+3.31)#69 | 2.1%(+3.58)#2,261 |
| 70. | 32321 | 5.7% | 2.4%(+3.31)#70 | 2.1%(+3.58)#2,262 |
| 71. | 33875 | 5.7% | 2.4%(+3.31)#71 | 2.1%(+3.58)#2,265 |
| 72. | 32327 | 5.7% | 2.4%(+3.30)#72 | 2.1%(+3.57)#2,272 |
| 73. | 33473 | 5.7% | 2.4%(+3.29)#73 | 2.1%(+3.56)#2,280 |
| 74. | 32320 | 5.7% | 2.4%(+3.29)#74 | 2.1%(+3.56)#2,289 |
| 75. | 34601 | 5.7% | 2.4%(+3.26)#75 | 2.1%(+3.53)#2,300 |
| 76. | 32736 | 5.6% | 2.4%(+3.22)#76 | 2.1%(+3.50)#2,331 |
| 77. | 33056 | 5.6% | 2.4%(+3.22)#77 | 2.1%(+3.49)#2,336 |
| 78. | 33503 | 5.6% | 2.4%(+3.19)#78 | 2.1%(+3.47)#2,363 |
| 79. | 33430 | 5.6% | 2.4%(+3.19)#79 | 2.1%(+3.46)#2,369 |
| 80. | 33549 | 5.6% | 2.4%(+3.17)#80 | 2.1%(+3.44)#2,378 |
| 81. | 32565 | 5.5% | 2.4%(+3.13)#81 | 2.1%(+3.40)#2,418 |
| 82. | 32195 | 5.5% | 2.4%(+3.12)#82 | 2.1%(+3.39)#2,427 |
| 83. | 32044 | 5.5% | 2.4%(+3.10)#83 | 2.1%(+3.37)#2,437 |
| 84. | 32754 | 5.5% | 2.4%(+3.08)#84 | 2.1%(+3.35)#2,454 |
| 85. | 33147 | 5.4% | 2.4%(+3.02)#85 | 2.1%(+3.29)#2,504 |
| 86. | 32443 | 5.4% | 2.4%(+3.01)#86 | 2.1%(+3.28)#2,513 |
| 87. | 33167 | 5.4% | 2.4%(+2.93)#87 | 2.1%(+3.20)#2,580 |
| 88. | 32333 | 5.4% | 2.4%(+2.93)#88 | 2.1%(+3.20)#2,584 |
| 89. | 33150 | 5.3% | 2.4%(+2.90)#89 | 2.1%(+3.17)#2,618 |
| 90. | 34987 | 5.3% | 2.4%(+2.89)#90 | 2.1%(+3.16)#2,630 |
| 91. | 32464 | 5.3% | 2.4%(+2.89)#91 | 2.1%(+3.16)#2,635 |
| 92. | 32764 | 5.1% | 2.4%(+2.73)#92 | 2.1%(+3.00)#2,763 |
| 93. | 32025 | 5.1% | 2.4%(+2.70)#93 | 2.1%(+2.98)#2,787 |
| 94. | 33032 | 5.1% | 2.4%(+2.68)#94 | 2.1%(+2.95)#2,806 |
| 95. | 34251 | 5.1% | 2.4%(+2.67)#95 | 2.1%(+2.94)#2,821 |
| 96. | 32148 | 5.1% | 2.4%(+2.67)#96 | 2.1%(+2.94)#2,823 |
| 97. | 32110 | 5.1% | 2.4%(+2.65)#97 | 2.1%(+2.92)#2,847 |
| 98. | 33470 | 5.0% | 2.4%(+2.62)#98 | 2.1%(+2.89)#2,886 |
| 99. | 34715 | 5.0% | 2.4%(+2.59)#99 | 2.1%(+2.86)#2,913 |
| 100. | 32778 | 5.0% | 2.4%(+2.59)#100 | 2.1%(+2.86)#2,917 |
Common Questions
What are the Top 10 Zip Codes with the Highest Percentage of Population Employed in Security & Protection in Florida?
Top 10 Zip Codes with the Highest Percentage of Population Employed in Security & Protection in Florida are:
What zip code has the Highest Percentage of Population Employed in Security & Protection in Florida?
32831 has the Highest Percentage of Population Employed in Security & Protection in Florida with 100.0%.
What is the Percentage of Population Employed in Security & Protection in the State of Florida?
Percentage of Population Employed in Security & Protection in Florida is 2.4%.
What is the Percentage of Population Employed in Security & Protection in the United States?
Percentage of Population Employed in Security & Protection in the United States is 2.1%.